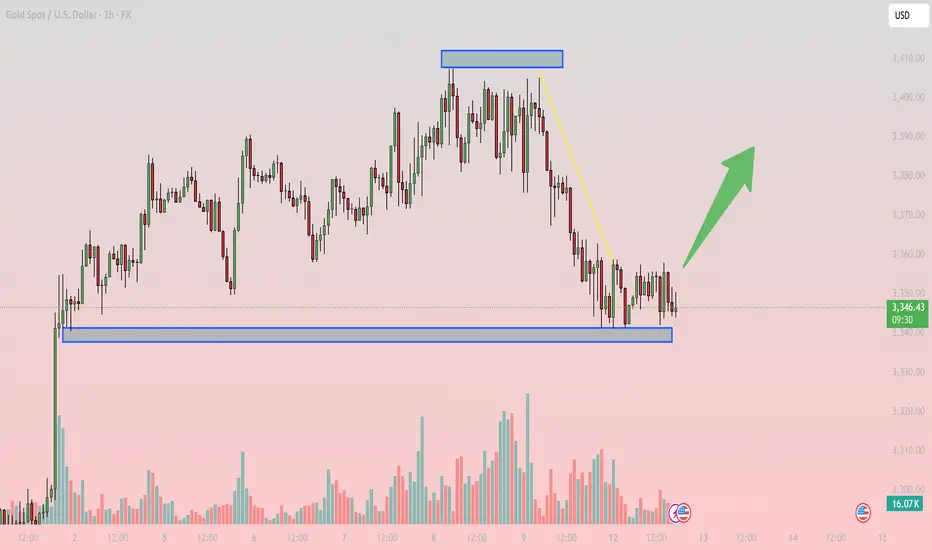
GOLD 1H – Key Support Holding, Breakout Setup AheadThis chart is a technical analysis of GOLD (XAU/USD) on the 1-hour timeframe, showing possible price movement scenarios based on support, resistance, and trend structure.
Here’s the breakdown:
Uptrend channel (yellow shaded area): Price previously moved within an upward channel, creating higher highs and higher lows before breaking down.
Resistance point (~3,400): A key level where price previously reversed; if price breaks above, it could push much higher.
Support zone (~3,340–3,345): Price has bounced here multiple times, indicating buyers are defending this level.
Short-term support zone (~3,355–3,360): This is acting as a near-term ceiling in the sideways consolidation.
Supertrend indicator (red & green zones): Shows bearish momentum at the moment (red zone) after a breakdown from the channel.
Possible scenarios:
Bullish breakout: If price breaks the short-term resistance (~3,360), it could rally toward the main resistance near 3,400.
Bearish continuation: If price fails to break resistance and drops below 3,340, it could lead to further downside.
In short, the chart shows gold consolidating between support and resistance, with traders watching for a breakout to determine the next strong move.
XAUUSD trade ideas

Xau Usd Neyork time buy set up (05/08/2025)XAU USD Can buy with below level as swing as well as intraday
BUY FROM 3352/58
tp1- 3272
tp-2-3284
tp3-3393
tp4- 3410
SL- 3347/45 (for swing i prefer to hold
i use SMC/ fib tools. and truly a price action method for this entry
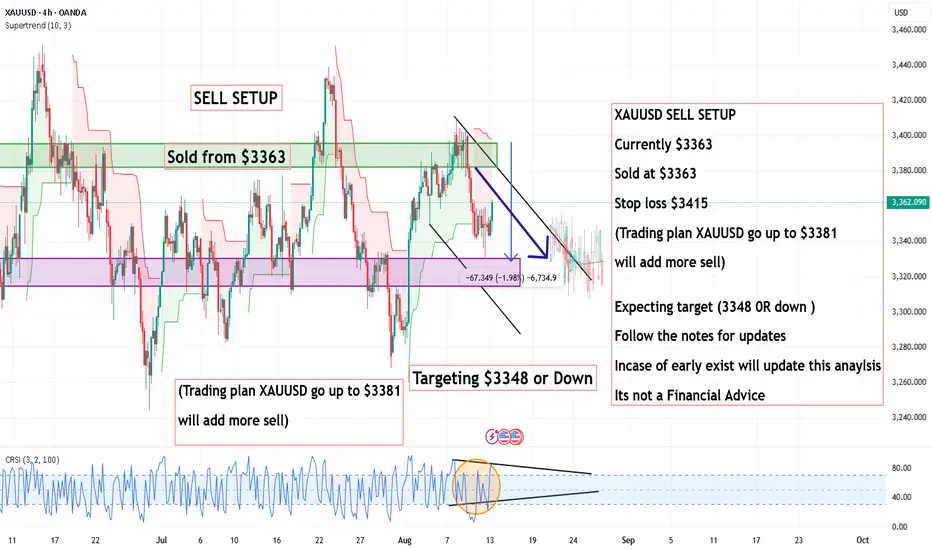
XAUUSD SELL SETUP ,Sold at $3363XAUUSD SELL SETUP
Currently $3363
Sold at $3363
Stop loss $3415
(Trading plan XAUUSD go up to $3381
will add more sell)
Expecting target (3348 0R down )
Follow the notes for updates
Incase of early exist will update this anaylsis
Its not a Financial Advice
ACCORDING TO DXYAccording to dxy Gold maybe will move 500 to 700 pips on Monday. So if you want to sell 1st session if 1H close below 3395 than make sell and last tp 3378 and wait for buy signal.

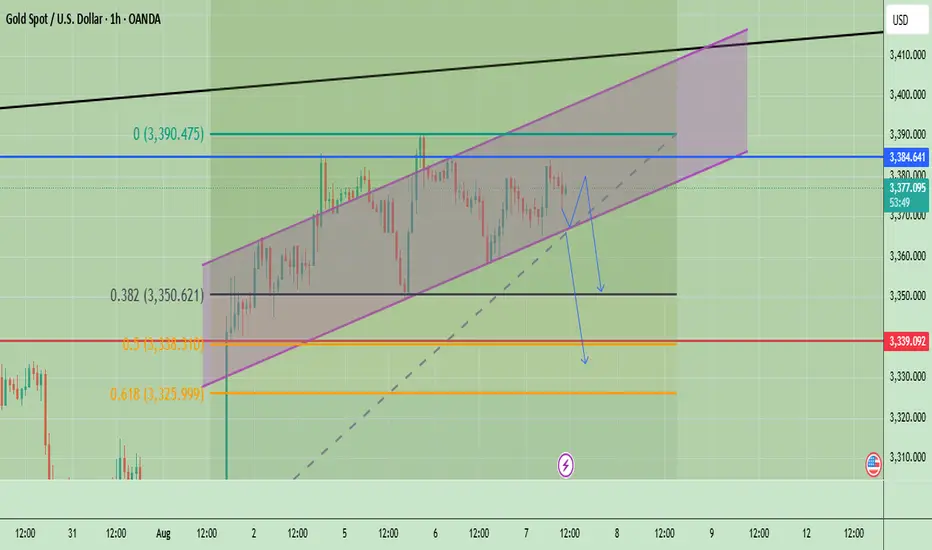
Gold Technical Analysis - Bearish Bias Below $3,384Gold is currently trading near $3,373 within an ascending channel but showing signs of weakness. A rejection near the $3,384–$3,390 resistance zone could trigger a downside move toward key supports at $3,350, $3,338, and $3,326. If price breaks below the channel midline, bearish momentum may strengthen. However, a bounce from support could push gold back toward the upper range. Keep an eye on breakout zones for the next move.
🔑 Key Levels to Watch
- Resistance: $3,384 → $3,390: Strong resistance zone
- Support: $3,350 → $3,338 → $3,326
- Breakout Zones: Below $3,338: Opens room to $3,310 and below. Above $3,390: May lead to fresh highs toward $3,410+
🧭 Trend Outlook
- Short-Term: Bearish bias within the ascending channel, especially if price breaks below mid-channel.
- Medium-Term: Neutral to bullish as long as the lower channel trendline holds.
- Momentum: Losing bullish momentum; potential for downside correction.
Price is at a decision point within the ascending channel. A clean break below the mid-channel and $3,365 area can accelerate downside correction. Stay alert to key support zones and any reversal signals.
Note
Please risk management in trading is a Key so use your money accordingly. If you like the idea then please like and boost. Thank you and Good Luck!
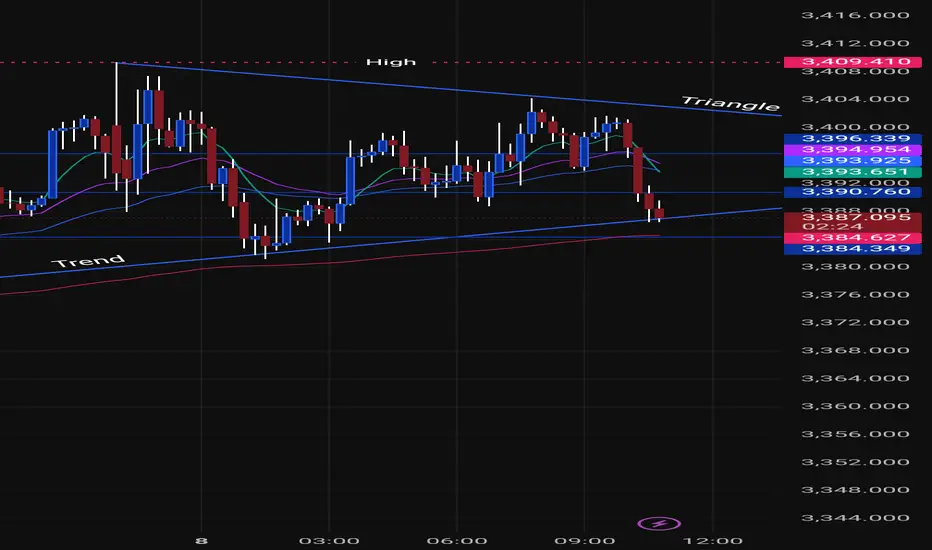
XAUUSD BUYProbably buy gold if it not go under the triangle. Im waiting for a breakout. What do you think?
Give me some feedback and what do you think about gold. I have trading about 3 months, so im a Newbie🧐💰
Gold (XAU/USD) - Bullish Breakout Opportunity Above Golden ZoneGold (XAU/USD) has recently shown strong bullish momentum, moving upward from a "Strong Support Area" and a lower "Golden Zone." The price is currently consolidating just below a significant resistance area, the 1st TG (Target), which is also labeled as a "Golden Zone." This presents a potential high-probability setup.
My analysis suggests that the current consolidation is a period of accumulation before the next leg of the uptrend. The key to a successful trade here will be a confirmed breakout above the 1st TG. This would indicate that buyers have absorbed the selling pressure at this resistance and are ready to push the price higher.
Bullish Scenario: The primary scenario I'm watching is a breakout above the 1st TG and its corresponding "Golden Zone" resistance. A clear 4-hour candle closing above this area would be a strong bullish signal.
Bearish Scenario: A failure to break the resistance, followed by a sharp move back down below the current consolidation level (1st SUP), would invalidate the bullish thesis and suggest a potential deeper retracement.
Trading Plan:
Long Entry: Enter a long position on a confirmed breakout and close above the 1st TG (Golden Zone) resistance level.
Profit Target 1: The 2nd TG level, which sits at the top of the chart.
Stop Loss: A stop loss should be placed below the 1st SUP level to protect against a false breakout or a reversal.

XAUMO Golden Report: FULL KILL ZONE BREAKDOWN.🔍 FULL MULTI-TIMEFRAME TECHNICAL DESTRUCTION
Short below 3,348.80, SL 3,353.20, TP 3,343.00.
MM building trap around VWAP, expecting breakdown. Jewel trade = short. Avoid breakout long unless clear volume shows up.
1. PRICE ACTION ANALYSIS (ALL TIMEFRAMES)
Multiple Pin bars & inverted hammers at POC zone (3,350.55) = clear signs of order absorption & rejection.
Wicks into 3,352.20 zone got rejected = trap move during kill hour yesterday.
Inside bar formation in H1 = energy buildup, coiling for one-directional expansion.
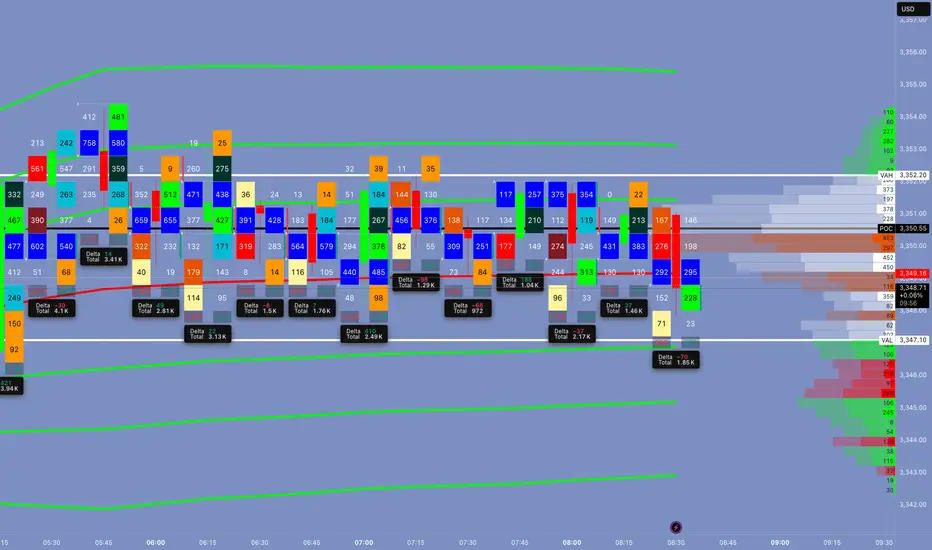
2. RANGE BOUND ZONE
Market is stuck between:
Value Area High (VAH) → 3,352.20
Point of Control (POC) → 3,350.55
Value Area Low (VAL) → 3,346.80
This is your MM battlefield. They’ll fake the top or bottom.
3. VOLUME & DELTA INTELLIGENCE
Massive volume trapped near 3,350 — over 1.18M contracts, likely MM liquidity build.
Bullish delta spike without breakout = distribution confirmed.
Negative divergence on volume as price inches up = fading buyer pressure.
4. TREND STRUCTURE
Macro: Corrective rally inside a bear cycle.
Micro: Sideways drift with upward fakeouts.
This is distribution phase, not accumulation.
5. VWAP + VWAP Golden Zone
Daily VWAP: 3,350.00
Golden Zone VWAP: 3,352.20
Price is hugging this zone without commitment.
Classic Schabacker “congestion before collapse” setup.
6. MOMENTUM SNAPSHOT
RSI divergence + failing upward thrusts = buyers can’t push this shit higher.
Bears are slowly reloading near VWAP.
7. SUPPORT/RESISTANCE LEVELS
🔺 Resistance: 3,352.20 → VAH + VWAP + trap zone
🔻 Support: 3,346.80 → VAL + last buyer response
🔻 Hidden Bear Target: 3,343.00 → fair value rejection + unfinished auction zone
8. LIQUIDITY TRAPS / MM BAIT ZONES
Liquidity stack above 3,352.20 → bait to trap longs
Liquidity pockets at 3,344.80 – 3,346.00 → possible trap for late shorts
Market Makers will stab both sides before choosing a direction.
9. MARKET MAKER PSYCHOLOGY (Schabacker Style)
MMs:
Built liquidity around POC.
Faked breakout at VAH.
Absorbed breakout buyers, preparing to flush price down.
This is textbook “Congestion before Reversal” — Schabacker style.
Watch for the Kill Candle during 10:15–11:00 Cairo time.
⚖️ HEDGE PLAN (LONG & SHORT SETUPS)
🟢 LONG HEDGE SETUP (LOWER PROBABILITY)
Entry: 3,353.00 (Break above VAH + Hold)
Stop: 3,349.00
TP: 3,357.50
Probability: 35%
Justification: Only viable if VWAP breaks & holds with volume. Otherwise, it’s a trap.
🔴 SHORT SETUP (HIGHER PROBABILITY TRADE)
Entry: 3,348.80
Stop: 3,353.20
TP: 3,343.00
Probability: 85%
Justification: VWAP trap + absorption + bearish delta + exhaustion = imminent drop.
🎯 JEWEL TRADE OF THE DAY (CONFIRMED SETUP)
🔥 Sell Stop Order Below VAL Trap Zone
Type Entry Stop Loss Take Profit Confidence
🔴 Sell Stop 3,348.80 3,353.20 3,343.00 85%
Timing: Golden Hour (10:15 – 11:30 Cairo Time)
Watch for MM trap at VWAP → kill candle confirms.
💣 CONTINGENCY PLAN FOR STOP HUNTS
✅ Where Will MM Try to Stop-Hunt?
Above 3,352.20 = bull trap zone
Below 3,346.00 = bear trap zone
🧨 How to Exploit It?
If price wicks below 3,346.00 then rebounds with delta spike:
➕ Buy Stop @ 3,348.20
SL: 3,345.50
TP: 3,352.00
Classic Schabacker reversal from congestion low.
XAUUSD swing readyH1-H4 TIMEFRAME SETUP
Currently XAUUSD is following the implusive down Trend as we mentioned once 3370 breaks 3345 is on mark I expecting market will renounce from 3335-3342 zone.
What possible scenarios we have ?
• Market has to gives closing of H4 above 3335-3340 for the implusive bounce for HH on D1 & H4 candles ,also I'm ready for buying at & my Targets are 3358 then 3370
• secondly If gold breaks to 3332-3330 and candle closes below then our buying will be invalid and market will retest 3310
#XAUUSD
XAUUSD 13.08.2025~+ Yesterday's mild inflation data
~+ Dovish Fed expectations
~+ Strong bullish seasonals for gold on Aug 15
XAUUSD: Buy ideaOn XAUUSD as you can see on the chart we would have a hight probability to have an uptrend if and only if of we have the breakout with force the resistance line by a big green candle.
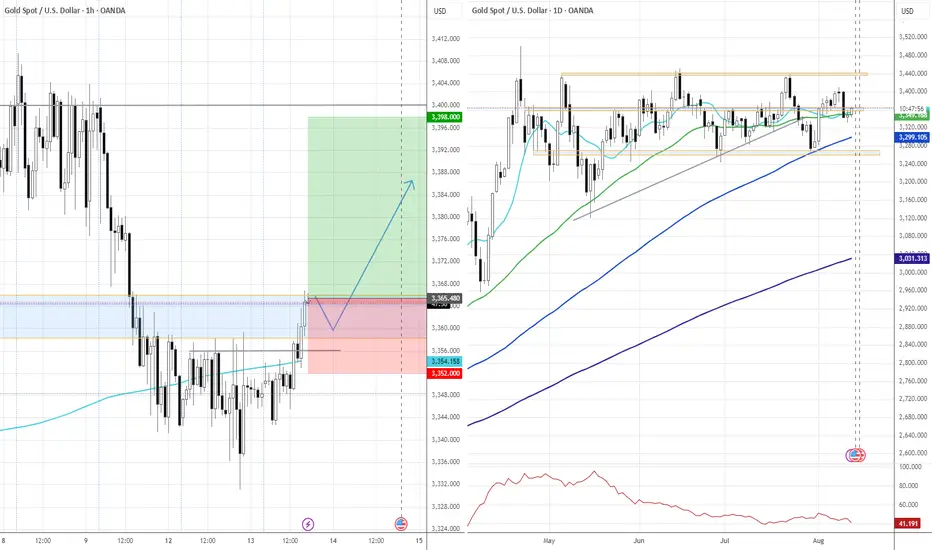
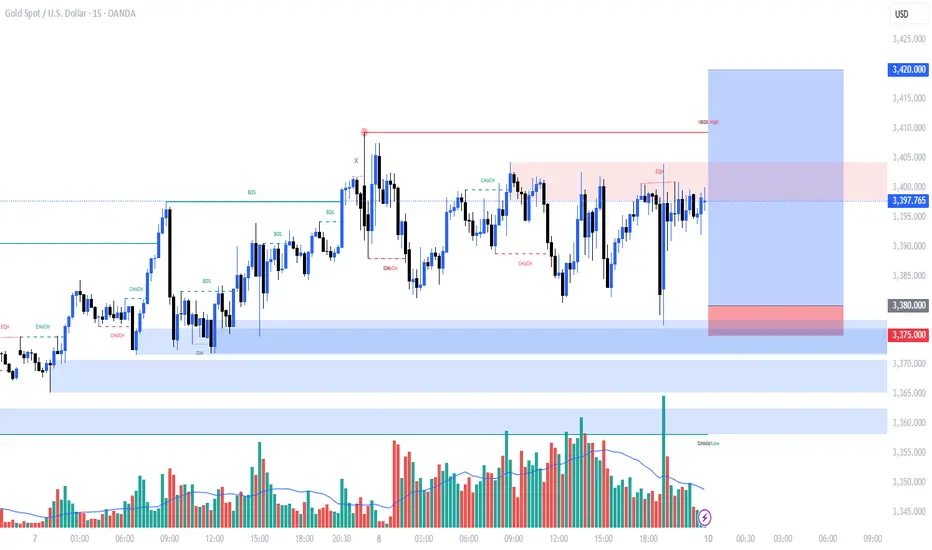
MY ANALYSIS ON XAUUSDLet's go through a top-down analysis for XAUUSD using the charts you've provided, starting from the 4-hour timeframe down to the 15-minute timeframe. I'll highlight key levels and POIs (order blocks, breaker blocks, and FVG) for possible trade setups.
1. 4-Hour Timeframe (Overall Market Structure)
* Market Structure: From the 4-hour chart, the market is in a bullish structure as it is making higher highs and higher lows.
* Key POI (Order Block / Breaker Block): There is a recent order block formed around 3,360.000, where the market pushed strongly upwards after a consolidation phase. This could be an area of interest if price revisits this level.
* Liquidity Sweep / Inducement: A potential inducement occurred when price broke the 3,375.000 level earlier, sweeping liquidity before pushing higher. This move suggests price could look to continue its upward momentum after a retrace.
* FVG: There's a gap between 3,375.000 and 3,380.000, which might get filled on a retrace. If the market revisits this level, we could expect a continuation.
2. 1-Hour Timeframe (Refining POIs)
* Market Structure: The price action continues to reflect a bullish trend , with higher highs and higher lows. The structure on this timeframe aligns with the 4-hour view.
* Key POI (Order Block / Breaker Block): There's another order block formed near 3,385.000 – 3,390.000. This is where the market saw a sharp upward movement, indicating a potential support zone for a retracement.
* Liquidity Sweep / Inducement: On this timeframe, we observe a small sweep of liquidity around 3,375.000, where price broke a minor support before rallying. This suggests further potential upside if the market returns to this level.
* FVG: There’s a noticeable gap around 3,400.000 – 3,405.000. If price comes back down into this zone, it could fill the gap before continuing the upward trend.
3. 15-Minute Timeframe (Entry Setup)
* Market Structure: The price continues to be bullish with a series of higher highs and higher lows in recent price action. Price is currently consolidating near the recent highs.
* Key POI (Order Block / Breaker Block): There is an order block near 3,395.000 where a sharp move upwards occurred. This could act as a potential entry point if price revisits it.
* Liquidity Sweep / Inducement: There's a liquidity sweep around 3,380.000, where price broke below before pushing upwards. If price returns to this area, we could expect a potential bounce to the upside.
* FVG: A small FVG is visible near 3,395.000. If price fills this gap and finds support, a long position could be considered.
---
TRADE SETUP
Bias: Bullish (uptrend).
* Buy Setup:
* Entry: Look for a price retracement to the order block near 3,395.000 – 3,380.000 (15-minute timeframe).
* Stop Loss: Place a stop below the recent swing low (around 3,375.000) to minimize risk.
* Target: The next target is around 3,400.000 – 3,410.000 , with a secondary target at the recent high near 3,420.000 on the 4-hour timeframe.
This setup aligns with the overall bullish structure and key points of interest. If price comes back into these zones, watch for confirmation signals like rejection or reversal candlestick patterns to enter.
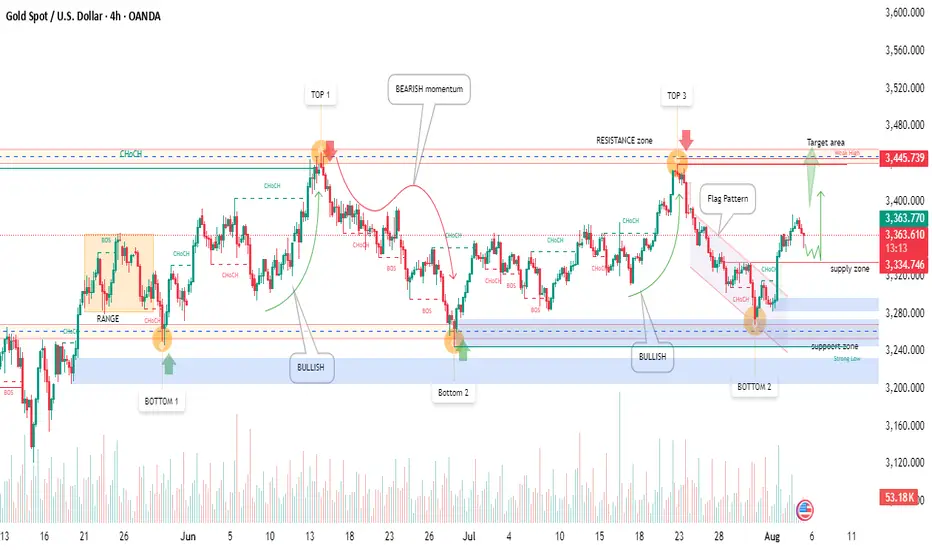
Gold(XAU/USD) 4H 5Aug2025 Price Analysis-Bullish Setup in Play!🧠 Technical Overview:
Gold has shown a solid bullish structure after rebounding from a strong support zone marked around the $3,250 area. We witnessed a textbook flag pattern breakout followed by a Change of Character (ChoCH) confirming bullish momentum.
🔹 Support Zones:
Strong demand near $3,250 – $3,280
Bullish reaction visible from Bottom 2
🔹 Resistance Zones:
Key supply zone at $3,334 – $3,356
Target area near the weekly high at $3,445
🏹 Trade Idea:
A bullish continuation is expected from the current zone after price retested the flag breakout.
🔸 Entry Zone: $3,334 – $3,356 (supply flip)
🔸 Target: $3,445 (Weekly High)
🔸 Stop Loss: Below $3,280 (support zone)
📊 Market Sentiment:
✅ Bullish momentum confirmed by multiple ChoCHs
✅ Strong buying volume at support
❗ Watch for price action confirmation at current supply zone
🏁 Summary:
Gold is currently respecting bullish structure with a clear path toward the $3,445 target. Traders can look for long opportunities after confirmation within the supply zone.
💬 What’s your outlook on Gold? Bullish or Bearish? Comment below!
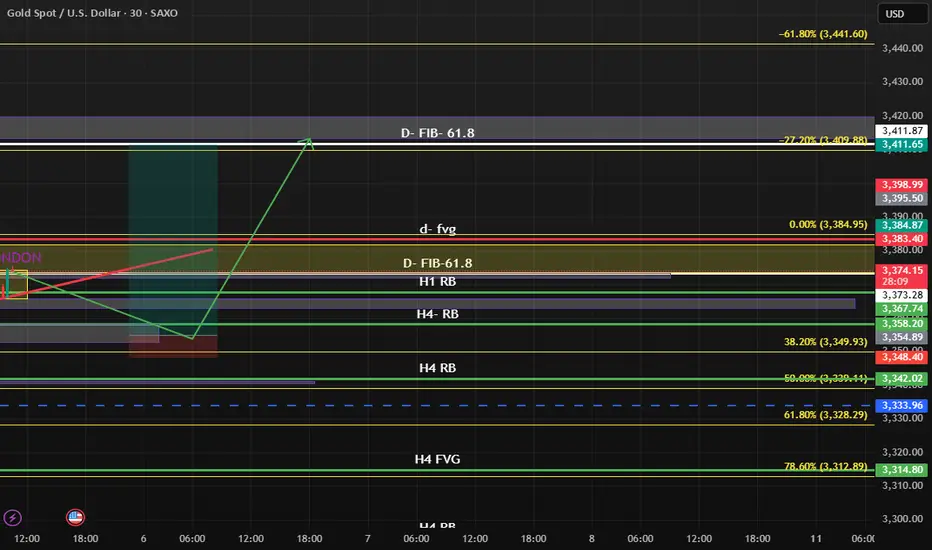
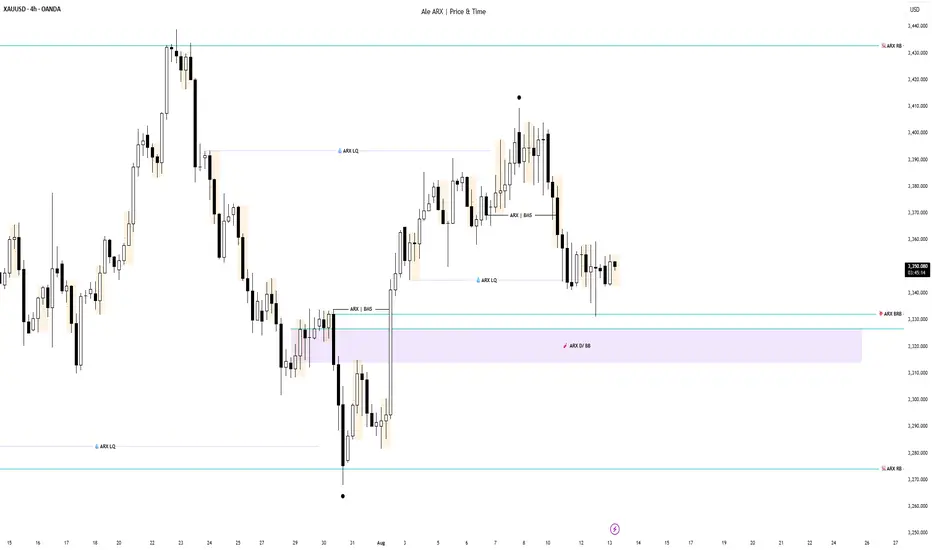
Gold (XAUUSD) 4H & Daily Structure ObservationOn the 4H timeframe, price is currently ranging between 3432.835 and 3274.175.
After tapping into the Rejection Block (RB) around 3274.175, price broke market structure (BMS) and left behind a daily Breaker Block (D/BB), which was later mitigated.
Yesterday, price reached the 4H Breaker Block near 3332.285, where a reaction occurred but without follow-through to confirm a directional shift.
From a structural perspective, if the market continues respecting the current price action flow, we could see further movement towards the daily Breaker Block for potential mitigation.
This is an educational market structure breakdown for chart study purposes only, not financial advice.
📌For more structured price action breakdowns and chart studies, check out my other analyses under ARX Price & Time here on TradingView or on our other educational platforms.
XAU/USD | Bounce in Play – Watching $3350 Support for Next Move!By analyzing the gold chart on the 4-hour timeframe, we can see that after hitting the first target at $3361, gold continued its rally and reached our second supply level at $3385. Upon reaching this key level, the price faced strong selling pressure, dropping over 350 pips down to $3349. Gold is now trading around $3363, and if it can hold above the $3350 support level, we could expect another bullish push. The next upside targets are $3367, $3375, and $3385. This analysis will be updated in the coming hours with your continued support!
Please support me with your likes and comments to motivate me to share more analysis with you and share your opinion about the possible trend of this chart with me !
Best Regards , Arman Shaban

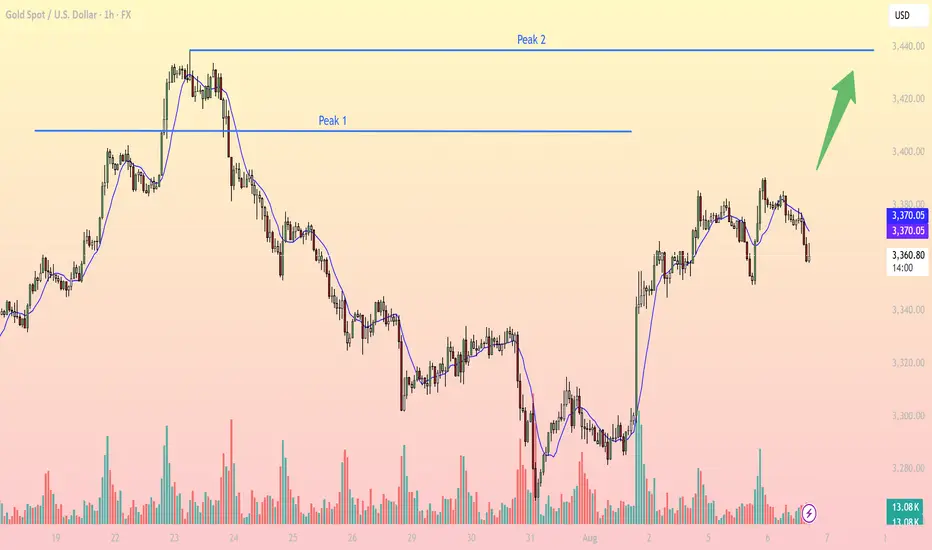
Intraday Gold Price Analysis – Key Levels and Strategy1. Technical Overview – Gold OANDA:XAUUSD on 1H Timeframe
At the time of writing, gold is trading around 3,361 USD, continuing to range just below the key resistance zones after a short-term bullish recovery. Price structure is forming a potential higher low, but a clear breakout above resistance is still pending for trend confirmation.
2. Key Levels to Watch
Support 1: 3,335 – 3,340 - Near EMA10 + previous demand zone, potential bounce area
Resistance 1 (Peak 1): 3,375 – 3,380 - Previous local top, acted as rejection zone recently
Resistance 2 (Peak 2): 3,435 – 3,440 - Major breakout target from previous double top pattern
3. Indicators Analysis
EMA10 (blue line): Currently serving as dynamic intraday resistance. Price is oscillating around it, showing consolidation.
Volume Profile: Rising on bullish candles – indicates accumulation pressure, though not yet confirmed by breakout.
RSI (not shown): Likely hovering near 50 – neutral bias, awaiting directional trigger.
4. Price Behavior and Structure
Market has recovered from end-of-July selloff, creating a local bottom near 3,280.
Forming a potential cup-and-handle pattern targeting break of 3,375, with bullish continuation targeting 3,440.
Sideways movement on lower volume suggests accumulation phase before breakout.
5. Trading Strategy Suggestion (Intraday)
- Bullish Scenario:
Entry: Buy on confirmed breakout above 3,375 (Peak 1) with strong candle + volume.
SL: Below 3,360.
TP1: 3,400
TP2: 3,440 (Peak 2 – measured move from breakout)
- Reversal Scenario:
Sell on rejection from 3,375 if price forms double top or bearish engulfing candle.
SL: Above 3,380.
TP1: 3,345
TP2: 3,330
- Neutral Bias:
Wait for price to retest EMA10 and demand zone near 3,340 before entering long, especially if RSI and volume show divergence.
6. Final Notes
Price action is coiling below major resistance, hinting at a potential explosive move. Patience and level-based execution are key today. Scalpers can utilize 15m confirmation inside key zones for tighter entries.
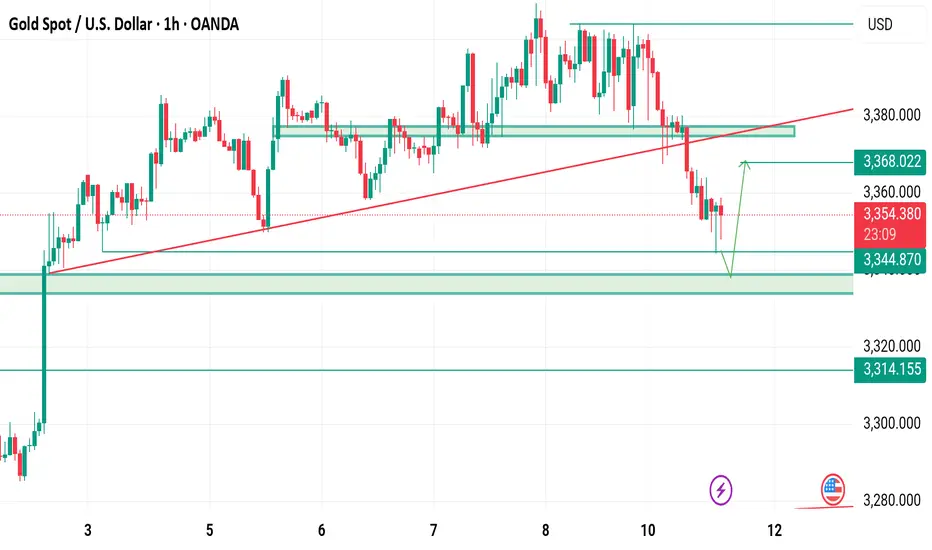
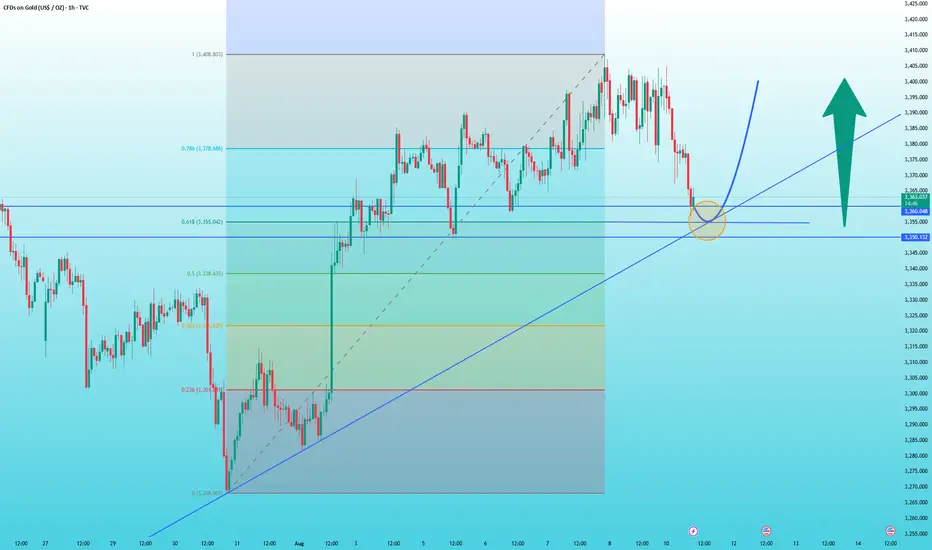
Gold ushers in a good buying opportunityAfter today's rapid pullback, the current price of gold has come near the key support level, which is the 3350-3360 range.
Based on the Fibonacci retracement indicator for the 3268-3408 uptrend, the 618 support level is located at 3355. Furthermore, the rising trendline also suggests downward support at 3350-3360.
Thus, I believe it's a good idea to enter a long position if the price retraces back to the 3350-3360 range.
Settings are as follows:
3350-3360 BUY
Take Profit Target 1: 3380
Take Profit Target 2: 3340
Stop Loss 0.5 Support: 3338
Personal opinion, for reference only
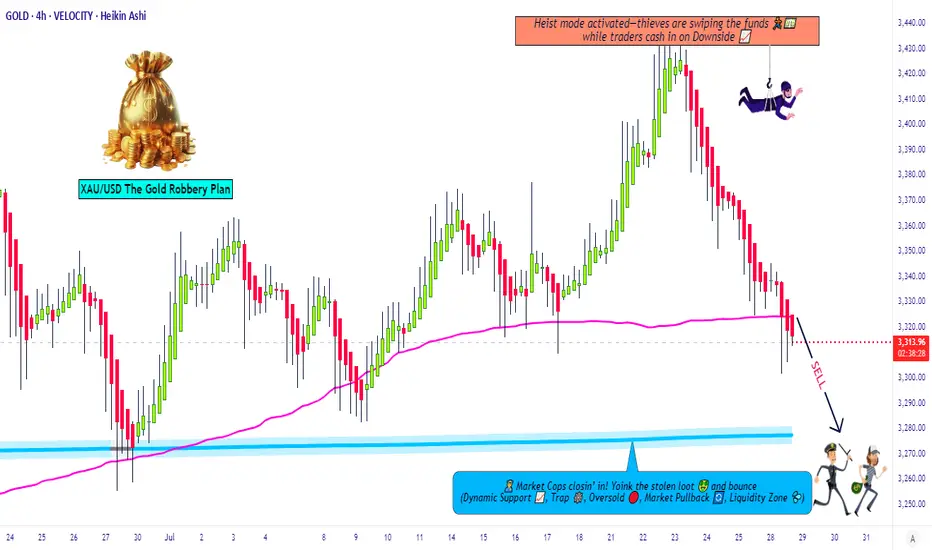
Gold Robbery Blueprint: Smart Bears on the Move Now!💣 XAU/USD GOLD HEIST PLAN: Robbery Begins at Resistance Zone! 🔐💰
🌟Hi! Hola! Ola! Bonjour! Hallo! Marhaba!🌟
Dear Money Makers & Market Robbers, 🕵️♂️💸🚀
Welcome to another strategic strike by Thief Trading Style™—where smart analysis meets bold execution. We're targeting XAU/USD (Gold) in this scalping/day-trade opportunity, primed with fundamentals, technicals, and pure robbery logic.
🔍 THE GAME PLAN
We're looking at a neutral zone turning bearish, and here’s how the robbery unfolds:
🔑 ENTRY POINTS
🎯 “Vault wide open” signal!
Initiate short orders at current price zones or set layered SELL LIMITS near swing highs on 15M/30M charts. We're running a DCA-style pullback entry for max loot.
🕵️♀️ Entry isn't about one shot—it's about precision raids.
🛑 STOP LOSS: THE ALARM SYSTEM
Set SL just above the nearest swing high (4H timeframe preferred).
Use candle wick tips as your defense line (Example: 3350.00).
Adjust SL based on risk appetite and number of orders stacked.
🎯 TARGET: THE GETAWAY PLAN
💸 First Vault: 3280.00
💨 Or escape earlier if price action signals reversal. Protect your gains. Professional thieves don't get greedy.
📊 WHY WE’RE ROBBING HERE
This level is a high-risk barricade zone—police aka "market makers" are strong here.
We spotted consolidation, oversold signals, trend reversal setups, and a bullish trap disguised as support. A perfect time to strike. 🧠🔍
📰 FUNDAMENTAL & SENTIMENTAL CHECKPOINTS
🔎 Stay updated with:
Global news drivers
Macro & Intermarket analysis
COT reports & future trend targets
👉 Check the 🔗🔗🔗
⚠️ TRADING ALERT - STAY SAFE DURING NEWS BOMBS!
Avoid entries during major economic data releases.
Use trailing SL to protect running profits.
Monitor volatility spikes & price anomalies.
💖 JOIN THE CREW, BOOST THE HEIST!
If this plan adds value to your trades, hit that Boost Button 💥
Support the Robberhood and help grow the gang of smart money snipers 🕶️💼💣
Every boost = more ammo for next mission. Let's rob the market—not each other. 🚀🤑
📌 Remember: Market is fluid. Stay sharp, adapt quick, and trade like a shadow.
Catch you soon in the next grand heist 🎭💼
#XAUUSD #GoldTrade #ScalpingStrategy #DayTrading #ThiefTrader #RobTheMarket #BoostForMore #NoChaseNoCase
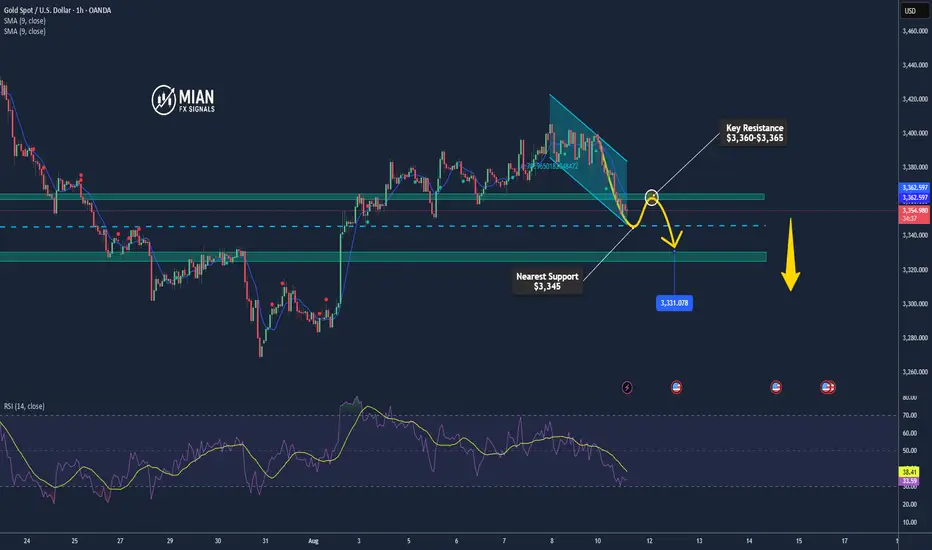
Gold Breaks $3,352 Support – Further Downside Risk📊 Market Overview:
• Spot gold is now trading at $3,352–3,356/oz, sliding sharply on profit-taking and uncertainty over potential U.S. import tariffs on gold.
• Weak buying interest at support pushed the price below the 200-hour MA, opening the door for deeper declines.
📉 Technical Analysis:
• Key resistance: $3,360–$3,365
• Nearest support: $3,345; next at $3,330
• EMA 09: Price remains below EMA09 → short-term trend is bearish
• Momentum: RSI below 45, sellers maintain control
📌 Outlook:
• Gold may continue to decline toward $3,345 or $3,330 if the H1 candle closes below $3,350.
• Only a break back above $3,365 with strong volume could trigger a short-term reversal.
💡 Suggested Trading Strategy:
SELL XAU/USD: $3,362–3,365
🎯 TP: 40/80/200 pips
❌ SL: $3,368
BUY XAU/USD: $3,345–$3,348 (only if clear bullish reversal candlestick forms)
🎯 TP: 40/80/200 pips
❌ SL: $3,342
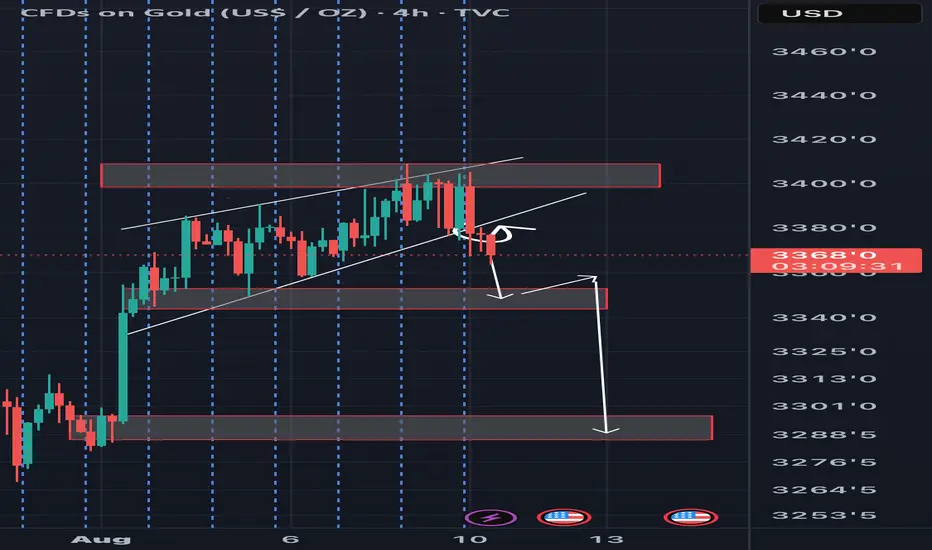
Price broke below lower trendline. Price finally broke below lower trendline thus signaling more downsides for this week . It should be notedworthy that 3340s is our next target then 3280s support zones . A break below 3280s - 3270s brings us down to 3180s . Signal service available . Its free , PM for more details .
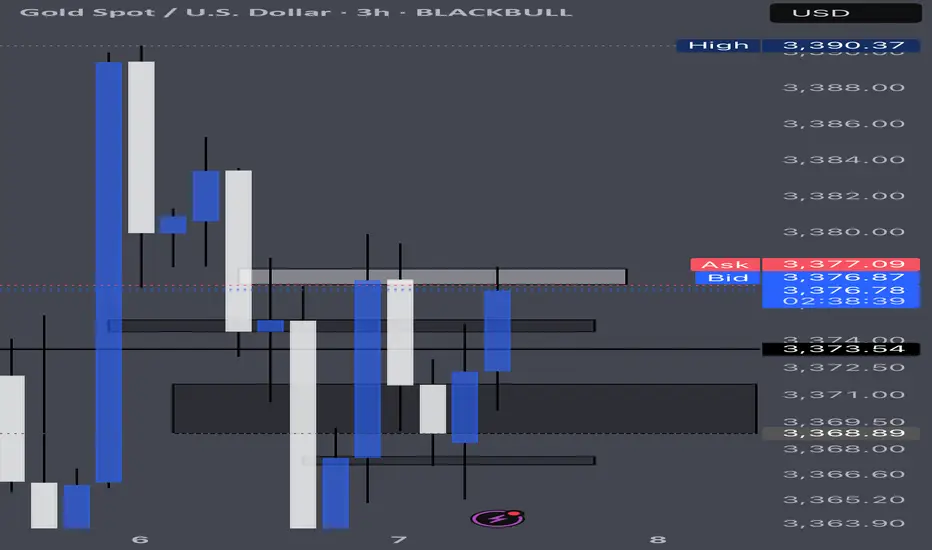
Prediction Xxauusd keeps rejecting of this box on the 3 hour if we see a close above we will see the 90s
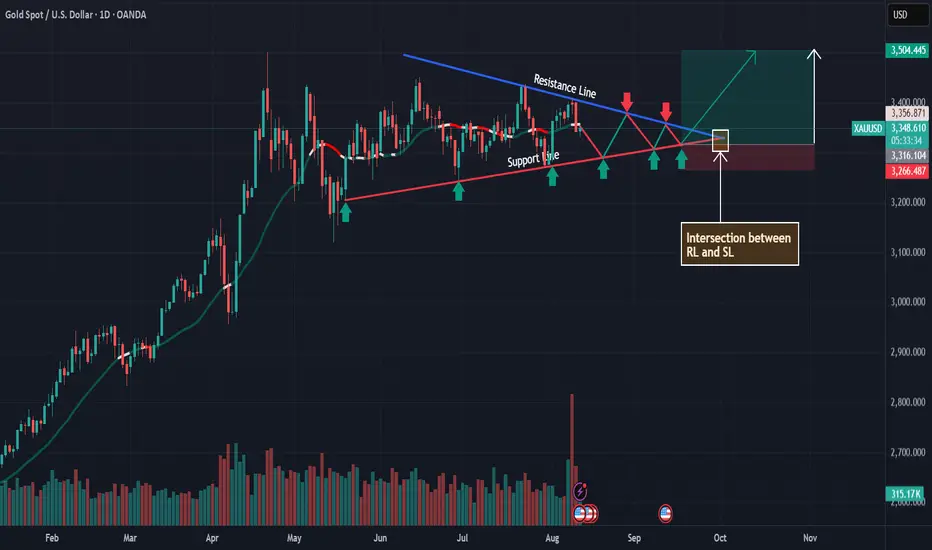
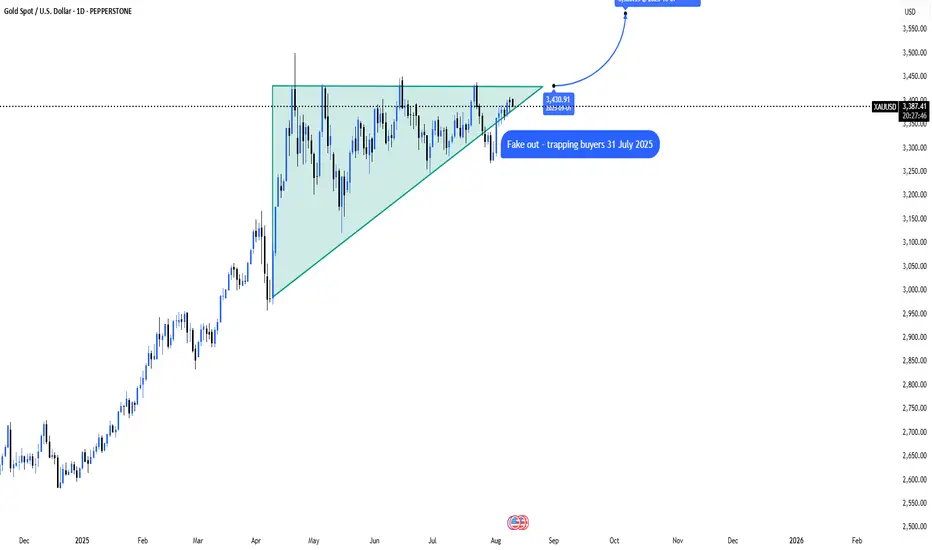
XAU/USD to break out - next target 3500Gold Technical Outlook & Macro Setup
Gold appears to be forming a bullish flag pattern on the daily chart, following a brief dip in late July that didn’t gain traction. If prices can hold above the $3,406–$3,412 range, the trend remains upward. A daily close above this level, followed by a break of the early August high near $3,418, could trigger a move toward the June highs in the $3,448–$3,458 zone, and potentially up to the psychological level of $3,500.
This $3,500 target aligns with a classic flag breakout projection—adding the height of the flagpole (around $130) to the breakout base near $3,400. Supporting this view, COMEX gold futures hit an intraday record of ~$3,534 on August 8, showing the upside potential even as spot prices consolidate just below the June 13 peak of ~$3,448.
Key Macro Catalysts This Week
Several economic events this week could influence gold’s direction:
Reserve Bank of Australia (RBA) Rate Decision – Tuesday, August 12 at 2:30 pm AEST (4:30 pm NZT). A dovish outcome could weaken the USD slightly, which tends to support gold.
U.S. CPI (July) – Tuesday, August 12 at 8:30 am ET (Wednesday, August 13 at 12:30 am NZT). This is the main event for market volatility, especially for the dollar and real yields.
UK GDP (June) – Thursday, August 14 at 6:00 pm NZT.
China’s July Economic Data – Industrial production and retail sales expected between Thursday and Friday (August 14–15). These could affect global risk sentiment and the dollar.
U.S. PPI (July) – Friday, August 15 at 8:30 am ET (Saturday, August 16 at 12:30 am NZT), rounding out the inflation picture.
Trading Levels to Watch
Bullish Scenario: A daily close above $3,406–$3,412, followed by a break of $3,418, opens the door to $3,448 and potentially $3,500. Expect resistance near $3,500.
Bearish Scenario: A close below ~$3,395–$3,384 suggests the flag pattern is still developing, and gold may remain range-bound until macro data provides a clearer direction.
Bottom Line: The technical setup supports a bullish breakout toward $3,500. This week’s economic data will likely determine whether that move materialises.
XAUUSD Intraday Analysis – H1 Chart 12/8Technical Overview:
On the H1 chart, gold (XAUUSD) is trading around 3,346 USD after a decline from the recent high near 3,394 USD. Price is now reacting at the strong support zone 3,340 – 3,335 USD, which previously acted as a key demand area before a bullish breakout.
Key Technical Levels:
Major Support: 3,340 – 3,335 USD (recent low, aligned with prior accumulation zone).
Near-term Resistance: 3,360 – 3,370 USD (short-term supply zone).
Major Resistance: 3,390 – 3,394 USD (previous swing high).
Short-term Structure: Price is showing signs of forming a double bottom around support, with selling pressure slowing down
RSI (if applied) is approaching oversold territory → potential rebound setup.
EMA Outlook: If price holds above 3,340 and reclaims short-term EMAs, a strong bullish recovery could follow.
Trading Strategy Ideas:
Primary Long Setup
Entry: 3,340 – 3,335 USD.
Stop Loss: Below 3,328 USD.
Take Profit 1: 3,360 USD.
Take Profit 2: 3,390 USD.
Alternative Short Setup
Condition: A clean break below 3,335 USD with strong volume.
Stop Loss: Above 3,345 USD.
Target: 3,320 USD.
Outlook:
If the 3,335 USD support holds, gold could stage a rebound toward 3,360 and 3,390 USD. Traders should closely watch price action in this zone for confirmation before entering positions.
Follow for more high-quality trading strategies.