U.S. Slaps 39% Tariff on Swiss Gold BarsU.S. Slaps 39% Tariff on Swiss Gold Bars, Shaking the Global Bullion Market
By Hirad Aryanejad – Macroeconomic & Gold Markets Analyst
---
The United States has moved to impose a 39% tariff on imports of one-kilogram and 100-ounce gold bars from Switzerland — a shock decision that could ripple across the global bullion market.
In a letter dated July 31, 2025, the U.S. Customs and Border Protection (CBP) reclassified these widely traded bullion products — critical to the Comex futures market — as “semi-manufactured”, making them subject to duties.
Previously, they were classified as “unwrought, nonmonetary gold” , exempting them from earlier tariff rounds.
---
A Blow to the World’s Largest Refining Hub
The decision follows former President Donald Trump’s broader tariff package on all Swiss goods, announced after rejecting Switzerland’s proposal for a 10% tariff in exchange for \$150 billion in U.S.-bound investment.
Switzerland — the world’s largest gold refining hub — exported roughly $61.5 billion in gold to the U.S. over the 12 months ending June 2025. The new tariff could add nearly $24 billion in duties.
Christoph Wild, President of the Swiss Association of Manufacturers and Traders of Precious Metals, called the ruling “another blow” to Swiss-U.S. gold trade, warning that exports may become “economically unviable”.
---
Market Reaction: Record Gold Prices
The ruling triggered an immediate market shock. Gold futures in New York surged past $3,500 per troy ounce, hitting a record $3,534 on August 8, before pulling back slightly.
Analysts say the rally was driven by both the tariff announcement and gold’s safe-haven appeal amid escalating trade tensions and geopolitical uncertainty.
Some traders described the CBP’s decision as “shocking” and possibly mistaken, predicting legal challenges ahead. The lack of clarity has already caused certain shipments to freeze in transit.
---
The Critical Role of Switzerland in Bullion Logistics
Global bullion trade depends on a triangular supply chain:
Raw gold refined in Switzerland Cast into kilo bars for the U.S. market or 400-ounce bars for London Delivered to satisfy Comex contracts and central bank reserves
This logistical network is now under threat. UBS strategist Joni Teves has questioned whether U.S. gold futures trading can remain viable if tariffs on deliverable products persist.
The Swiss Precious Metals Association noted that the CBP’s clarification applies to all 1kg and 100oz gold bars imported into the U.S. not only those from Switzerland — raising the stakes for global trade flows.
---
Negotiations and Uncertainty Ahead
Switzerland continues to negotiate with Washington to reduce the tariff burden, but uncertainty remains.
The White House is reportedly preparing a clarification on the bullion tariffs that could determine whether the market stabilizes or faces prolonged disruption.
Until then, gold industry players — from major banks to refining houses — are bracing for further volatility, both in pricing and physical supply chains.
---
Keywords: gold market news, Swiss gold bars, U.S. gold tariffs, Comex gold futures, bullion trade, Switzerland gold exports, precious metals refining, gold price surge, macroeconomic analysis.
XAUUSD trade ideas
Opportunities only come to those who are preparedThe market expects the probability of the Federal Reserve cutting interest rates in September to be over 70%, with some institutions even predicting as high as 93.6%. Fed officials have recently released dovish remarks. If the rate cut is implemented, it will reduce the opportunity cost of holding gold, which is good for gold prices. The US has imposed tariffs on India and Switzerland, exacerbating global trade tensions and boosting demand for gold as a safe haven. The deadlock in the Iran nuclear talks and the shipping risks in the Red Sea have increased market risk aversion. Focus is on US initial jobless claims data and speeches by Fed officials. If the data is stronger than expected, it may suppress expectations of a rate cut and be bearish for gold. If the US dollar strengthens or geopolitical risks ease, gold prices may come under pressure and fall. Today, gold mainly showed a high-level fluctuation trend, hitting a high of $3397.25/oz in European trading before falling sharply. It is currently trading around $3382. Although gold prices are still in an upward channel, they have recently shown a high sideways trend. The market lacks unilateral driving factors. Gold can be shorted at high levels. It is recommended to short gold in batches around the highs of 3390-3405.
Accurate Price Model for Trading Smart Money Concepts SMC (=
If you trade Smart Money Concepts SMC, there is one single pattern that you should learn to identify.
In this article, you will learn an accurate price model that you can use to predict a strong bullish or bearish movement way before it happens.
Read carefully and discover how to track the silent actions of smart money on any market.
The only thing that you need to learn to easily find this pattern is basic Structure Mapping . After you map significant highs and lows, you will quickly recognize it.
This SMC pattern has 2 models: bullish and bearish ones.
Let's start with a bearish setup first.
Examine a structure of this pattern
it should be based on 2 important elements.
The price should set a sequence of equal lows.
These equal lows will compose a demand zone.
The area where a buying interest will concentrate.
The minimum number of equal lows and lowers highs should be 2 to make a model valid.
Exhausting of bullish moves will signify a loss of confidence in a demand zone . Less and less market participants will open buy positions from that.
At some moment, a demand zone will stop holding. Its bearish breakout will provide a strong bearish signal , and a bearish continuation will most likely follow.
This price model will signify a market manipulation by Smart Money.
They will not intentionally let the price fall, not letting it break a demand zone. A buying interest that will arise consequently will be used as a source of liquidity.
Smart money will grab liquidity of the buyers, silently accumulating huge volumes of selling orders.
Once they get enough of that, a bearish rally will start, with a demand zone breakout as a trigger.
Though, the chart model that I shared above has a strong bullish impulse, preceding its formation, remember that it is not mandatory.
The price may also form a bearish impulse first and for a pattern then.
Each bullish movement that initiates after a formation of an equal low should be weaker than a previous one.
So that the price should set a lower high every time after a formation of an equal low.
Look at a price action on USDCHF forex pair. Way before the price dropped, you could easily identify a market manipulation of Smart Money and selling orders accumulation.
A breakout of a horizontal demand zone was a final bearish confirmation signal.
Let's study its bullish model.
It has a similar structure.
The price should set a sequence of equal highs, respecting a horizontal supply zone.
Each bearish move that follows after its test should have a shorter length, forming a higher low with its completion.
This model will be also valid if it forms after a completion of a bearish impulse.
Weakening bearish movements will signify a loss of confidence in a supply zone, with fewer and fewer market participants selling that.
Its bullish breakout will be an important even that will confirm a highly probable strong bullish continuation.
Smart Money will use this price model to manipulate the market and accumulate buying orders, not letting the price go through a supply zone. They will grab a liquidity of the sellers each time a bearish move follows from a supply zone.
When they finally get enough of a liquidity, a bullish rally will initiate and a supply zone will be broken , providing a strong confirmation signal.
That price model was spotted on GBPJPY forex pair.
Smart Money were manipulating the market, not letting it continue rallying by creating a significant horizontal supply zone.
Selling orders that were executed after its tests provided a liquidity for them.
A bullish breakout of the underlined zone provides a strong bullish confirmation signal.
A breakout and a future rise could be easily predicted once this price model appeared.
Why they do it?
But why do Smart Money manipulate the markets that way?
The answer is simple: in comparison to retail traders, they trade with huge trading orders . To hide their presence and to not impact market prices much, they split their positions into a set of tiny orders that they execute, grabbing the liquidity.
The price model that we discussed today is the example how they do it.
The important thing to note about this pattern is that it efficiently works on any market and any time frame. You can use that for scalping, day trading, swing trading. And it can help you find great investing opportunities.
❤️Please, support my work with like, thank you!❤️
I am part of Trade Nation's Influencer program and receive a monthly fee for using their TradingView charts in my analysis.
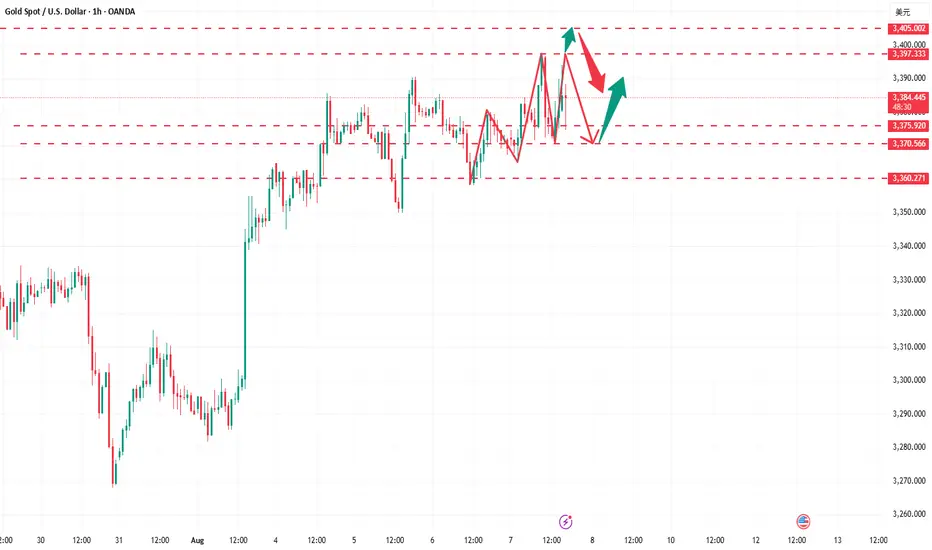
Gold’s Balancing Act – Pressure Builds at the Pivot ZoneGold is moving within a defined upward channel, currently trading near 3,378, with both buyers and sellers focusing on the same critical area — the 3,360–3,370 pivot zone.
A sustained hold above this zone could shift momentum in favor of the bulls, opening the path toward 3,400 and the channel ceiling at 3,416.
Conversely, a decisive break below 3,360 may trigger further downside, with potential targets at 3,340 and 3,320. This is the type of level where markets commit to a direction — and once that decision is made, price movement often accelerates.
What’s your view?
Do you see gold holding this support for another rally, or is a breakdown more likely this week? Share your thoughts and analysis in the comments below.
Disclaimer:
This is not financial advice. Please ensure you apply prudent risk management in all trading decisions.
Gold Surges on Weak NFP Hello everyone, what’s your take on XAUUSD?
Gold prices soared at the end of the last session and are now trading around $3,380. This sharp rise followed a weaker-than-expected U.S. Non-Farm Payrolls (NFP) report, which shifted market sentiment toward expectations that the Fed may delay interest rate cuts. As a result, the U.S. dollar weakened and demand for gold as a safe haven surged.
Technically, gold appears to be forming a cup and handle pattern, with the first resistance target at $3,400, followed by $3,435.
What do you think? Could this rally continue? Let us know in the comments!

Gold prices plummeted, will the bulls fight back strongly?
International gold prices continued to fall on Monday. Last Friday, the White House announced it would issue an executive order clarifying its position on gold bar tariffs. As the market digests the initial impact of US tariffs, which could disrupt the circulation of gold bars, both spot and futures prices have fallen. Elsewhere, President Trump and Russian President Vladimir Putin plan to meet in Alaska on Friday to discuss ending the war in Ukraine.
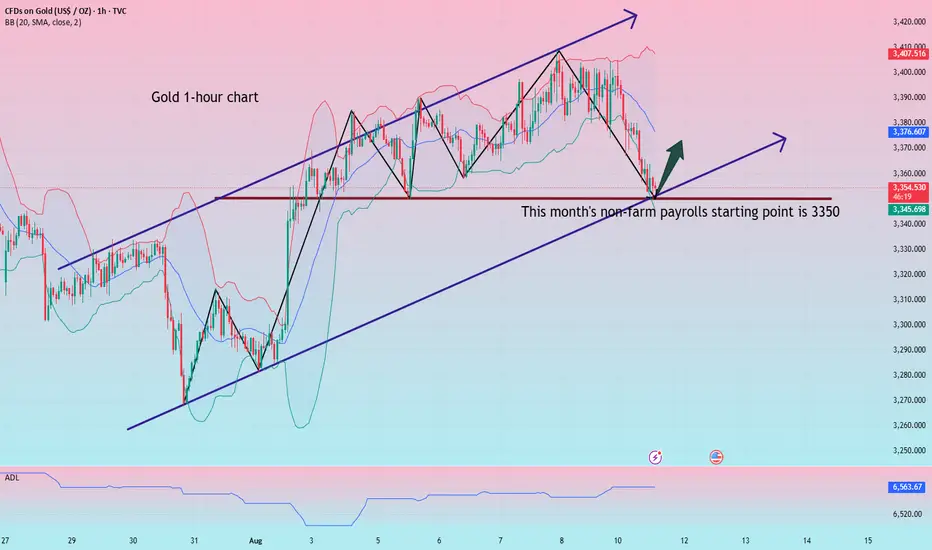
A gold market outlook!
Gold opened high and closed low today, having fallen $55 to date. With the price now re-entering the key support level of 3350, whether it can rebound is the key to today's market. I am currently bullish on 3350, as it was a key support level during previous periods of multiple resonance. A break below this level would be highly unfavorable for bulls.
In the short term, 3350 is the starting point for the non-farm payroll report. If it breaks, it could potentially reach the early-month low of 3340. Today, I suggest continuing to try a long position at the current level of 3349. The defensive retracement point is at the early-month low of 3340, hoping for a pullback. The upward trend is towards 3365-73!
Gold: Enter a long position directly at the current price of 3349-50, with a defensive level at 40 and a target of 3365-73!
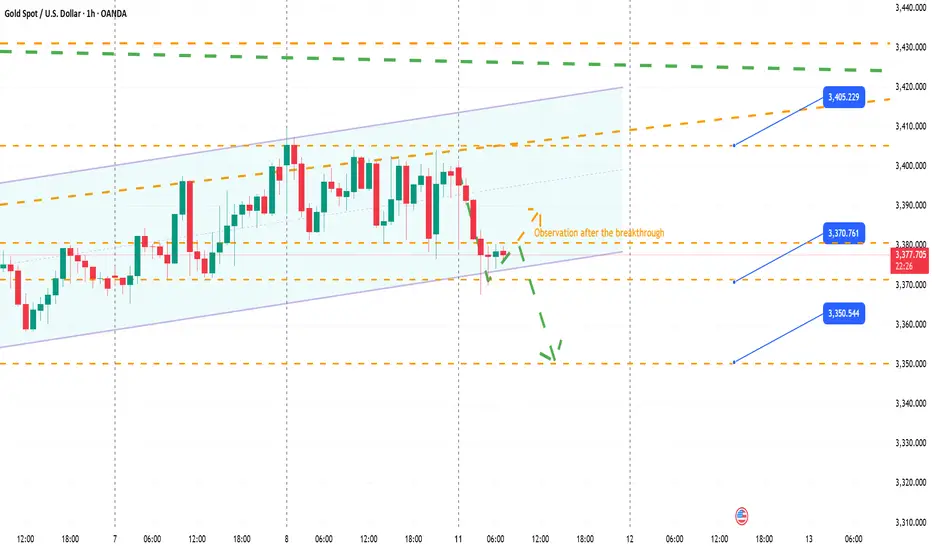
XAUUSD - The bullish backdrop remains strongOverall Market Sentiment
The bullish background remains strong: the dollar index is putting pressure on gold, while geopolitical tensions and expectations of a rate cut by the Fed are increasing demand for the safe-haven asset
Direction by indicators: on Investing.com — 9 “Buy” signals against 3 “Sell” signals on moving averages and a neutral overall state
Support and resistance levels
Key support levels: $3,320 and $3,368–$3,340. A rebound from this zone could serve as a starting point for growth
Resistance: it is important to break $3,400 — a psychological and technical barrier, above which a directional move to $3,450 and beyond will open
Short-term scenario (LiteFinance): gold is testing resistance in the $3,380–$3,391 zone; a drop from there could lead to $3,330 → $3,268, and a breakout to the upside would accelerate growth to $3,493–$3,515
Union traders are noting the movement after the breakout of $3,375: possible targets are $3,390, $3,402.56 and $3,416.39. A breakout below $3,374.91 could send gold to $3,358.25, $3,350.01 and $3,341.18
1H chart analysis: Gold confidently broke through the $3,350 level, opening a bullish scenario, confirmed by macro dynamics and expectations of monetary policy easing
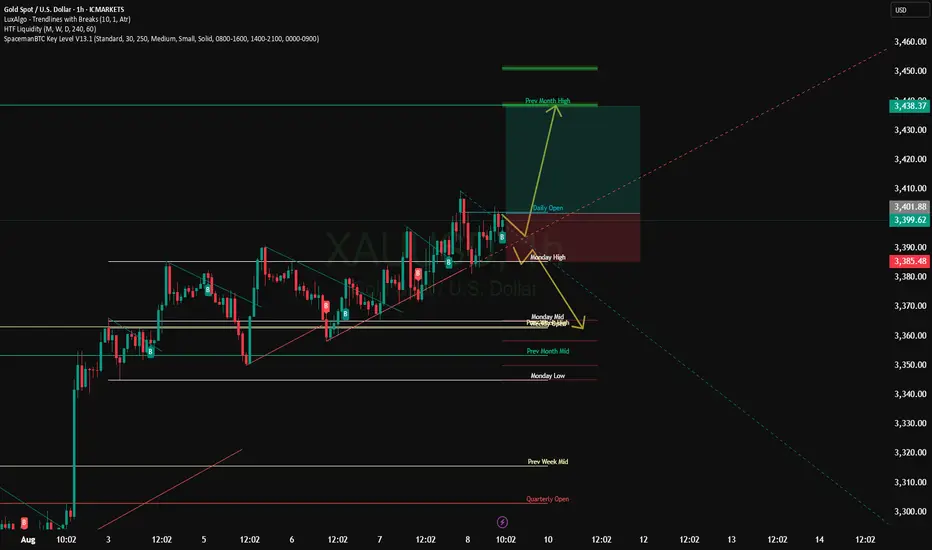
Daily Gold Mapping (XAUUSD) — 7 August 2025
Market Bias: Bullish with Short-Term Rejection Possibility
Key Levels to Watch:
Resistance Zone (H4 Fresh Supply)
3383 - 3386
- Price is approaching a fresh H4 resistance area.
- We are eyeing this zone for a potential short-term rejection or pullback, suitable for scalping short entries.
- However, this zone is not a confirmed reversal unless price gives clear bearish structure.
Support Zone (H4 Demand + Double Bottom)
3362.5 - 3359.5
- A solid H4 support base has formed here.
- Double bottom structure hints at strong bullish sentiment from buyers defending this area.
- If price returns to this zone, we anticipate potential buy entries as continuation of bullish trend.
TODAY GOLD BIG MOVE (READ CAPTION)hello trader's.
current price:3349
Gold broke support yesterday and is now ranging. A break below 3340 could send it to 3310. A break above 3356 may retest 3378, where rejection and an H1 close in sell so possible gold drop down side
resistance 3356_3378
support zone 3340
target 3310
please like comment and follow thank you
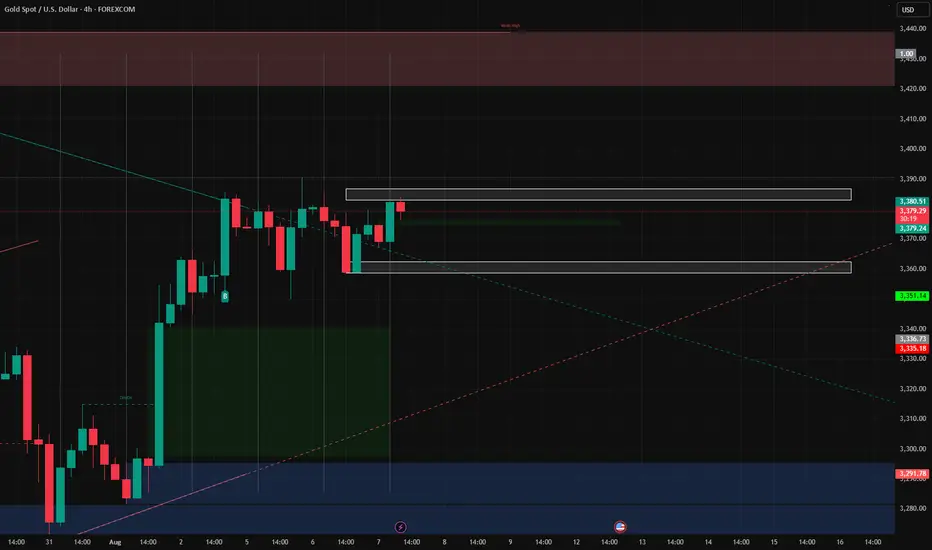
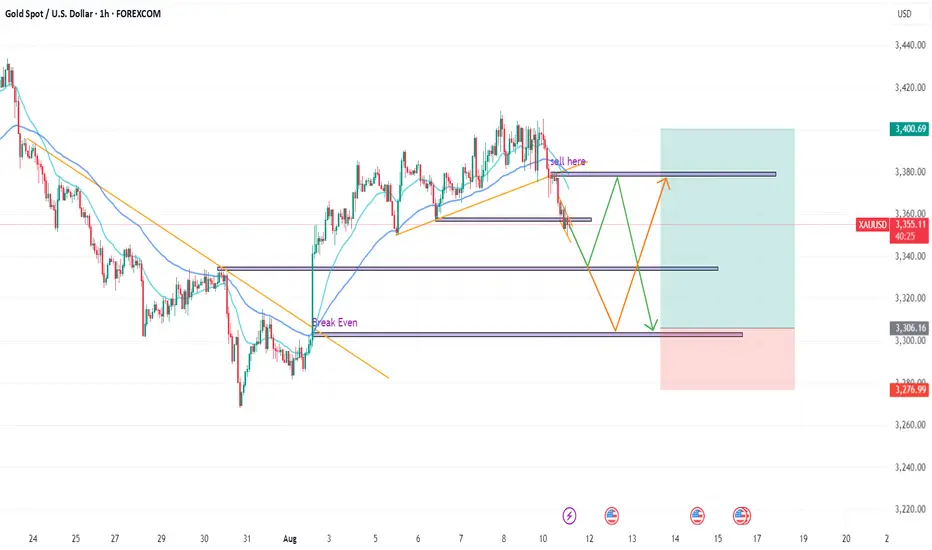
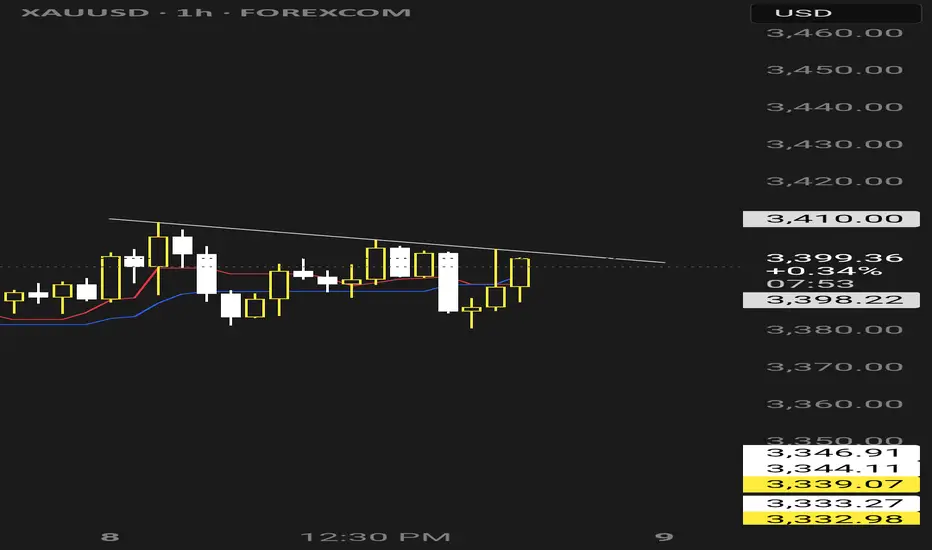
Gold (XAU/USD) - Trading Signals Post-Trend BreakoutIntroduction:
Analysis of Gold (XAU/USD) on lower timeframes, focusing on the breakout from an ascending trendline.
Technical Analysis:
Pattern: Breakout below $3,380.00, potential drop to $3,335.00 or $3,300.00.
Levels: Support at $3,335.00 and $3,300.00; resistance at $3,380.00.
Scenario 1:
If a strong bullish candle forms at $3,335.00, go long to $3,380.00 (stop loss behind bullish candle).
From $3,380.00 with candle confirmation, go short to $3,300.00 (stop loss at $3,412.00).
Scenario 2:
If price drops to $3,300.00 without rebounding, go long with a strong bullish candle to $3,400.00 (stop loss at $3,275.00).
Risk Management:
Risk-to-Reward: Scenario 1 (1:2), Scenario 2 (1:3).
Conclusion:
Breakout below $3,380.00 suggests a drop to $3,335.00 or $3,300.00. Await candle confirmation for long or short entries.
Disclaimer:
This analysis is for informational purposes only and not financial advice. Conduct your own research.
Tags: #Gold, #XAUUSD, #TradingSignal.
Time: Now (02:10 PM CEST, August 11, 2025).
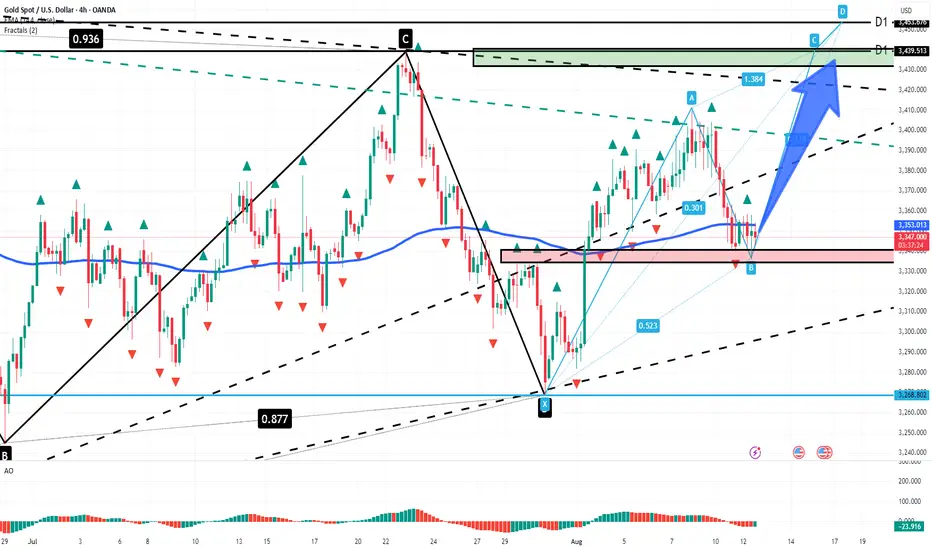
XAU/USD — Gold at Key Support, Potential for GrowthMarket Overview:
Gold is trading around 3,351 after pulling back from a recent high. Price has bounced off the 3,340–3,345 support zone, which aligns with the EMA144 on the H4 chart. The bullish structure remains intact, and the corrective decline may serve as a base for a new upward impulse.
Technical Signals & Patterns:
• Support zone at 3,340–3,345;
• ABCD pattern targeting the 3,439–3,453 zone;
• EMA144 acting as dynamic support;
• Divergence on AO indicator suggests a possible bullish reversal.
Key Levels:
Support: 3,340, 3,310
Resistance: 3,439, 3,453
Scenario:
• Primary: holding above 3,340 could lead to growth toward 3,439 and 3,453.
• Alternative: a break below 3,340 may increase pressure and target 3,310.
August 11 Gold AnalysisAugust 11 Gold Analysis
⚠️ Key Events
1. The Federal Reserve Chair Succession Turmoil
- On August 10, U.S. Treasury Secretary Bensoner publicly announced that he was searching for a successor to Powell. The new chair must meet three key criteria: overall control, market credibility, and forward-looking decision-making (rather than relying on historical data).
- Trump continues to pressure the Fed to cut interest rates, even threatening Powell with a leadership change. Powell responded forcefully, stating that "monetary policy must be completely depoliticized," but acknowledging that the economic impact of tariffs is still being assessed.
- Market Impact: The Fed's independence faces its most severe challenge in a decade. If Powell leaves early, expectations for aggressive easing will rise, but the risk of political interference will undermine the long-term credibility of the U.S. dollar, which is fundamentally positive for gold.
2. The Impact of the Gold Bar Tariff Policy
- On July 31, U.S. Customs and Border Protection (CBP) imposed high tariffs on 1 kg gold bars (the mainstream delivery size on the New York Mercantile Exchange). It is not yet clear whether 400 ounce gold bars in the London market will be exempted. - Supply chain crisis erupts: Global gold flows are hindered, and refiners are considering melting large gold bars into 1-kilogram bars before re-importing them into the US (increasing costs). A former JPMorgan Chase director bluntly stated, "I never thought gold would be affected by tariffs," highlighting market panic.
- Hidden dangers in the futures-spot price gap: Tensions over physical delivery are intensifying. If the policy continues, the gold futures premium (previously reaching $100) may widen again.
📉 Economic Data and Policy Interaction
- Probability of a rate cut soars to 90%:
Trump's pressure coupled with a weakening economy (July's ISM non-manufacturing index of 50.1, below expectations of 51.5) has led Donghai Futures to predict a September rate cut, tipping the balance of Fed independence.
- Tonight's CPI release becomes a key catalyst:
If July's core CPI rises by 0.3% month-over-month as expected, it will reinforce the case for a rate cut. If inflation exceeds expectations due to tariffs, it may temporarily suppress gold prices, but will hardly halt the easing trend.
🧭 Technical Structure and Key Positions
- Daily charts battle for the psychologically important 3400 level: A sharp drop to 3382 in the Asian session preceded a rebound, indicating that the 3380-3400 range is a crucial barrier for both bulls and bears.
- Offensive and Defensive Roadmap:
- Bullish Defense Line: 3355 (20/50-day moving average intersection) → 3279 (100-day moving average)
- Breakout Target: A break above 3400 will challenge 3452 (June peak) → the historically important 3500 level.
- Pattern suggests an imminent market reversal: The weekly "ascending triangle" consolidation is at its final stage. If support at 3370 holds, the medium-term target is $3600.
💡 Trading Strategy: Focus on Policy Fissures and Data Pulses
1. Short-Term Opportunities:
- If the price retraces to 3360-3370 (daily support) before the CPI release, establish a light long position with a stop-loss below 3350, targeting 3408-3417.
- If the price stabilizes above 3400 after the data release, go long, targeting 3450; if it unexpectedly falls below 3350, exit and wait and see.
2. Medium-Term Strategy:
- Gradually establish long positions on pullbacks below 3300, betting on a September rate cut and a political uncertainty premium. "Gold's long-term upward trend remains unchanged"—central bank gold purchases and the weakening US dollar provide solid support.
Trade with caution and manage risk! Wish you a smooth trade!
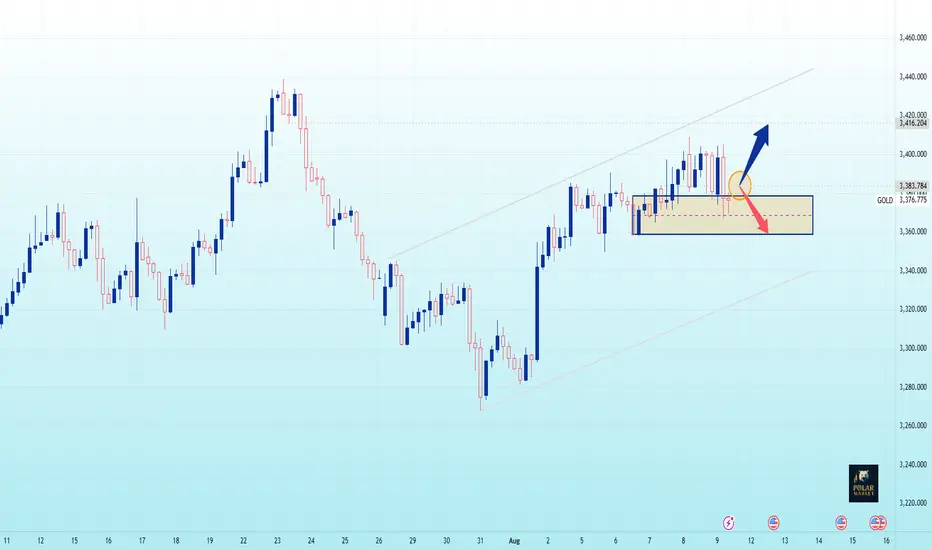
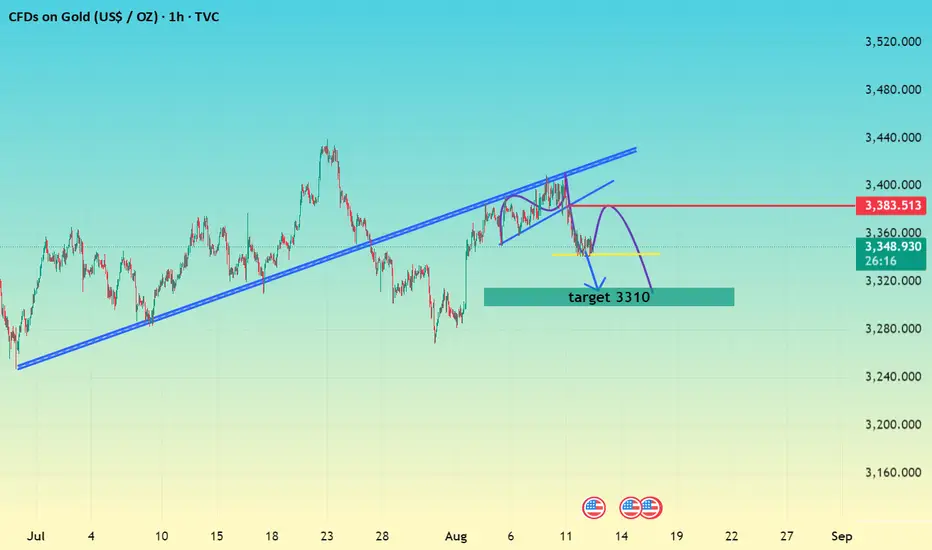
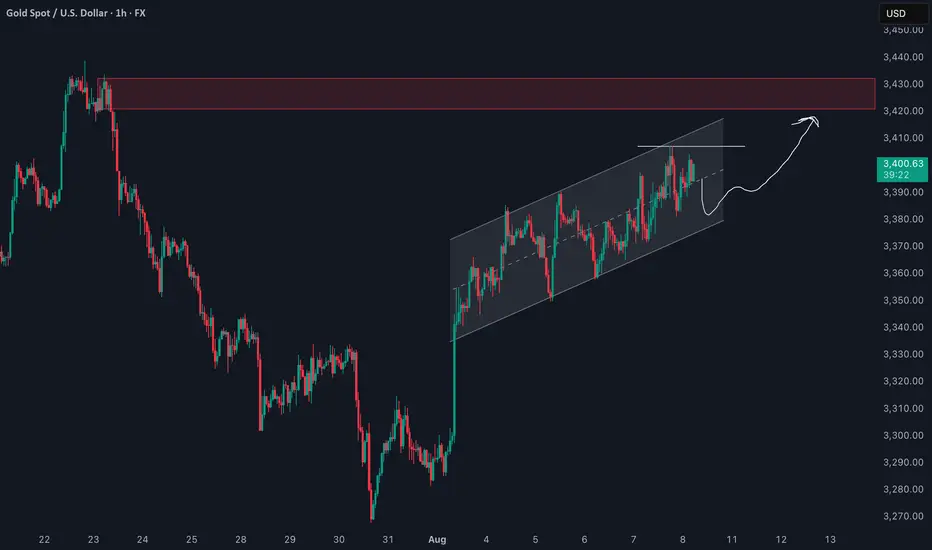
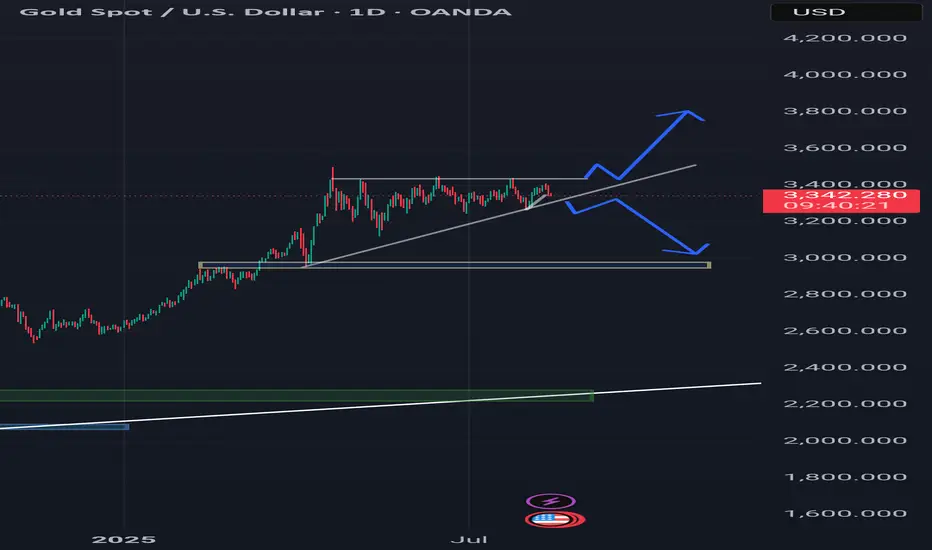
XAUUSD Ascending Channel Run to Supply Trade IdeaGold (XAUUSD) remains in a bullish trend 📈, forming higher highs and higher lows within a well-defined ascending channel ↗️. Price is approaching a recent swing high near resistance 🧱, and I’m watching for a short-term pullback into channel support 🔄 before a potential continuation higher toward the supply zone above 🎯.
This structure aligns with Wyckoff’s markup phase ⚡, where pullbacks serve as tests (LPS) before further upside. As long as price holds above the channel’s lower boundary 🛡️, the bullish bias remains intact — a break below would invalidate the setup ⚠️. Not financial advice.
Gold bulls' dreams of reaching 3400 have been shattered.Gold bulls' dreams of reaching 3400 have been shattered.
—Yesterday's $64 plunge marked another market sell-off!
On Monday (August 12th), spot gold plummeted from 3405 to 3341, a single-day drop of $64. A single bearish candlestick wiped out all of last week's gains! Last week's volatile bull market, with Friday's close near 3400, looked like the bulls were about to take off. However, Monday's losses were a brutal blow to those chasing the bulls.
Daily Chart
The price broke below the 3380 support level, turning bearish in the short term. The MACD golden cross formed with shrinking volume, and the STO fell rapidly, indicating weakness.
Key support: 3330 (non-farm payrolls breakout point), 3315, and 3300. A break below this level could lead to a decline to 3270-3245.
Key resistance levels: 3360-62 (strength-weakness dividing line), 3380 (strong resistance), 3400-10 (ultimate defense).
4-Hour & Hourly Charts
Severely oversold, a short-term rebound is possible, but a rebound is a short-selling opportunity!
Short-term range: 3340-3365; a breakout would target resistance at 3375-80.
Bullish illusions shattered: Last week's breakout above 3400 was a false alarm. Under the monthly chart structure, the upward trend was merely an inducement to sell!
Geopolitical & Fed bullish news: The marginal impact of the Russia-Ukraine conflict has diminished, and a Fed rate cut is already priced in. A real rate cut could spell doom for bulls!
Ultimate target: 3245 → 3150 → 3000-2950 (reversal of the tariff hike starting point).
Short on rebound:
Light short positions at 3360-62, stop-loss at 3365, target 3350-3340.
Add short positions at 3372-75, stop-loss at 3382, target 3360-3350-3330 (hold on breakout).
Short-term long:
Short long positions at 3340-30, stop-loss at 3327, target 3355-3365 (quick in, quick out).
⚠️ Warning: Do not blindly buy the dip! Follow the trend!
Last week's slow rise lured investors into buying, followed by a sharp drop on Monday—this is the cruelty of a volatile market! Just when you think it's breaking out, it plummets; just when you think it's crashing, it suddenly pulls back. Current strategy: Short on rebounds combined with short long positions at key levels, until a unilateral breakout occurs!
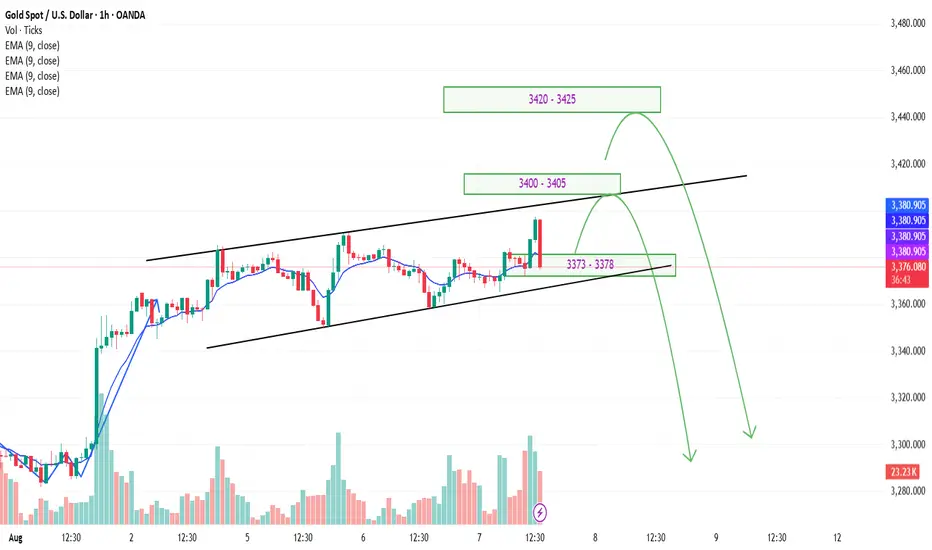
XAUUSD Gold Trading Strategy August 7, 2025XAUUSD Gold Trading Strategy August 7, 2025:
Gold prices are steady as US President Donald Trump has imposed an additional 25% tariff on Indian goods due to India's continued purchases of Russian energy. This new measure raises the current 25% tariff on Indian goods to 50%.
Fundamental news: The current market pulse is still mainly revolving around the tariff story initiated by Trump, in which spot gold is trading in a fairly narrow range. Gold is still waiting for further impact from the Fed's interest rate cut process, a weaker dollar will create support for non-yielding gold.
Technical analysis: The trading range of gold prices is currently narrowing, RSI on H1 and H4 frames is approaching the overbought zone. Gold prices have recovered, but resistance zones such as 3400 - 3405 and 3420 - 3425 can be short-term profit-taking areas for investors. Liquidity zones and Fibonacci frames show that the upward force of gold prices is showing signs of slowing down.
Important price zones today: 3373 - 3378, 3400 - 3405 and 3420 - 3425.
Trading trend today: SELL.
Recommended orders:
Plan 1: SELL XAUUSD zone 3402 - 3404
SL 3407
TP 3399 - 3390 - 3380 - 3360 - OPEN.
Plan 2: SELL XAUUSD zone 3423 - 3425
SL 3428
TP 3420 - 3410 - 3390 - 3370 - OPEN.
Plan 3: BUY XAUUSD zone 3373 - 3375
SL 3370
TP 3378 - 3388 - 3400 (small volume).
Wishing you a safe, successful and profitable trading day.💗💗💗💗💗
GoldBreaking from above and pullback to the previous resistance level and vice versa: From price pressure and the tendency to break resistance and rise
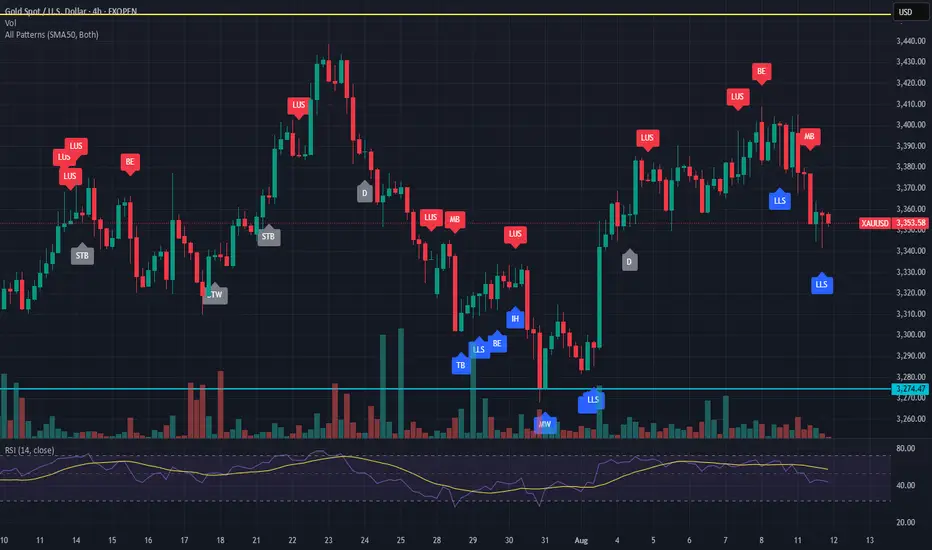
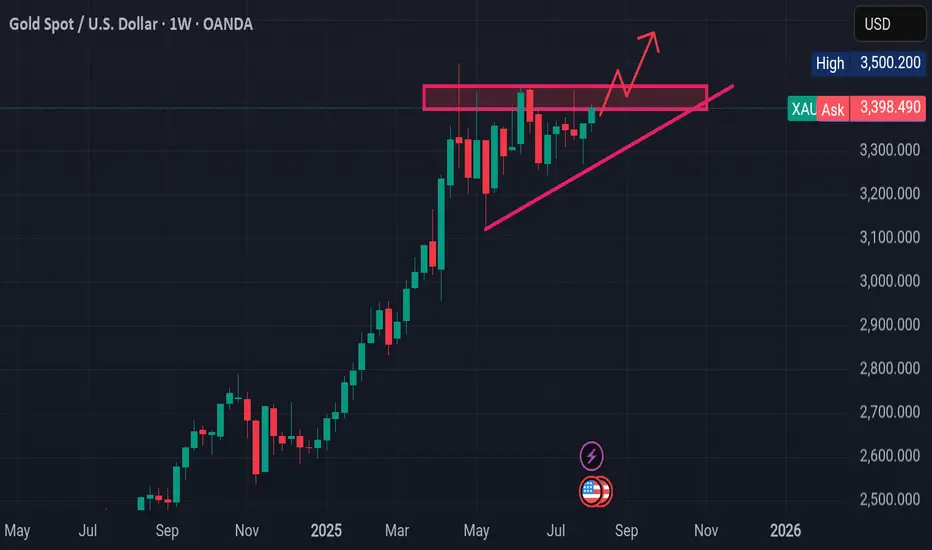
XAUUSD WEEKLY TIMEFRAME ANALYSIS Looking at this XAU/USD weekly chart, here’s the detailed analysis:
---
1. Market Structure
Pattern: The market is forming an ascending triangle — higher lows on the trendline and a relatively flat resistance zone around $3,390 – $3,420.
Trend: The broader structure is bullish; price has been in a strong uptrend since late 2024 with healthy pullbacks.
---
2. Key Levels
Resistance zone: $3,390 – $3,420 (multiple rejections here).
Trendline support: Rising support currently near $3,300 and climbing each week.
Breakout target: If price closes above $3,420, the measured move from the triangle suggests a potential rally toward $3,500 – $3,550.
Breakdown risk: A weekly close below $3,300 trendline could signal a deeper pullback toward $3,200.
---
3. Price Action Signals
Bullish bias if: Price breaks and closes above the horizontal resistance with strong volume.
Bearish risk if: Price fails to break resistance and closes below trendline — could indicate trend exhaustion.
---
4. Context With COT Report
If the latest COT report shows increasing non-commercial (speculator) net longs and falling shorts, this supports the bullish breakout case.
If non-commercial longs are declining or shorts increasing, it suggests that this resistance may hold, possibly leading to a pullback.
---
5. Summary
Primary bias: Bullish continuation toward $3,500+ if resistance breaks.
Alternative bias: Pullback to $3,200 if trendline fails.
Watch the next 1–2 weekly candles for a decisive move — this is a classic pressure build-up before a breakout.
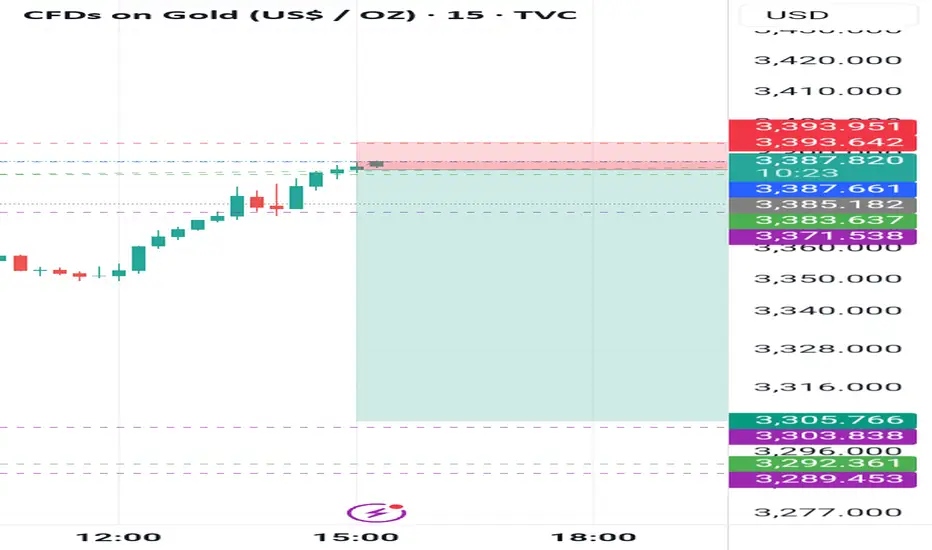
GOLD LAST LIQUDITY GRAB SELL SELL SELLI have take another SELL (as seen on the chart)
GOLD just came to test SUPPLY/DEMAND AREA which work well as a LIQUIDITY GRAB/SL HUNT before DUMP HEAVILY
Stay alart gold at the moment looks good for sell gives very good risk/reward
Thanks
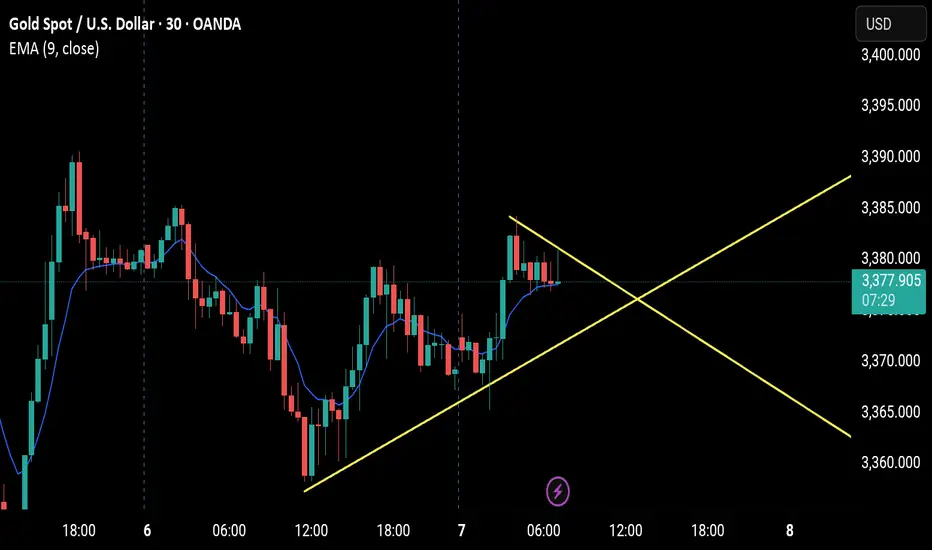
Gold Maintains Bullish Momentum – Eyes $3,400📊 Market Summary:
Gold surged past the $3,385 resistance to reach a new high at $3,390, driven by weaker-than-expected ISM Services PMI data. The U.S. dollar softened and Treasury yields dipped, fueling the rally. However, after hitting the peak, some profit-taking emerged, causing gold to pull back slightly and currently trade around $3,383.
________________________________________
📉 Technical Analysis:
• Key Resistance:
$3,390–$3,395 – short-term local high. If this zone breaks, the next target is $3,400+.
• Nearest Support:
$3,380, followed by the previous breakout level at $3,365, both likely to act as support during any pullback.
• EMA 09 (Daily):
Price remains above the 9-day EMA, confirming the continuation of the short-term uptrend.
• Momentum / Volume / Candlestick:
RSI is holding above 60 – bullish. However, a long upper wick near $3,390 suggests short-term selling pressure or hesitation.
________________________________________
📌 Outlook:
Gold is showing bullish momentum, with the uptrend confirmed after breaking above $3,385. If price holds above $3,380, there's a strong possibility of testing the $3,400 level. However, a failure to sustain above this zone could lead to a retest of $3,365.
________________________________________
💡 Suggested Trade Strategy:
🔺 BUY XAU/USD : $3,380–$3,383
🎯 TP: 40/80/200 pips
❌ SL: $3,377
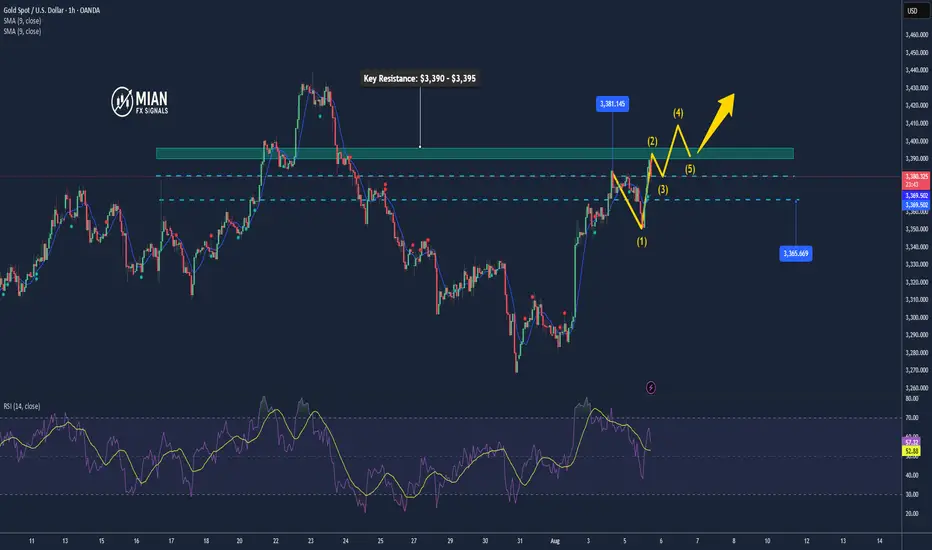
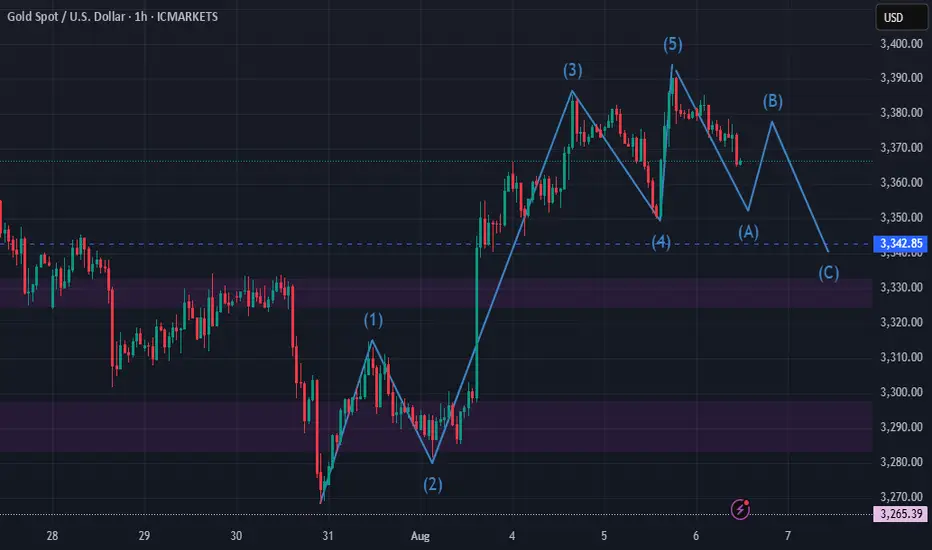
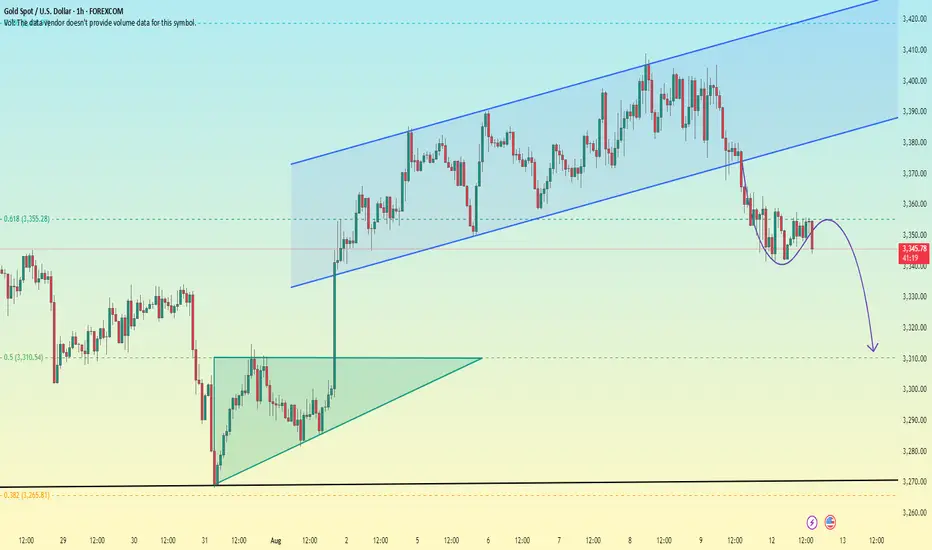
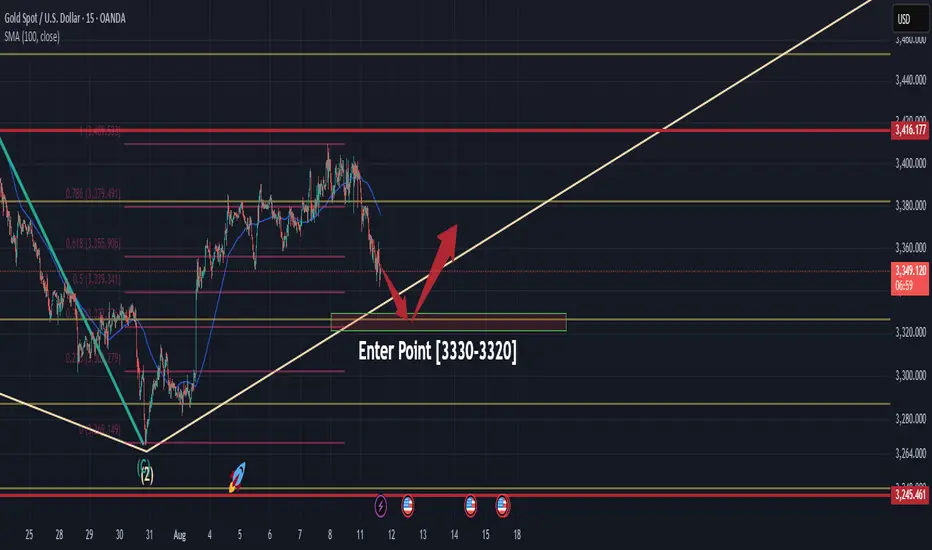
Minor dip to 3330~3320, then skyrocketing to the Moon!Hello Traders,
The first wave of the uptrend is complete.
The second wave will dip to 3330~3320, followed by the third wave uptrend. Check the reference signal for take-profit levels.
Upcoming Macro Events :
- U.S. CPI (August 12): The main catalyst for volatility, likely to impact USD and real yields. A higher-than-expected CPI could strengthen gold, while a soft print might pressure the bull case.
- RBA Rate Decision (August 12): A dovish outcome could weaken the USD, indirectly supporting gold.
- Global Data (GDP, PPI): China’s economic data and UK GDP could influence risk sentiment and USD strength.
Gold is in a critical phase with bullish technical setup and positive sentiment, but volatility is expected due to key macro events. Traders should focus on support levels, monitor the CPI data, and remain cautious of bearish reversals if the consolidation fails.
Gold on short term correction?Gold is likely to be on a short term correction, possibly in preparation for a bullish CPI. gold might actually head to 3400 after CPI release come next week.