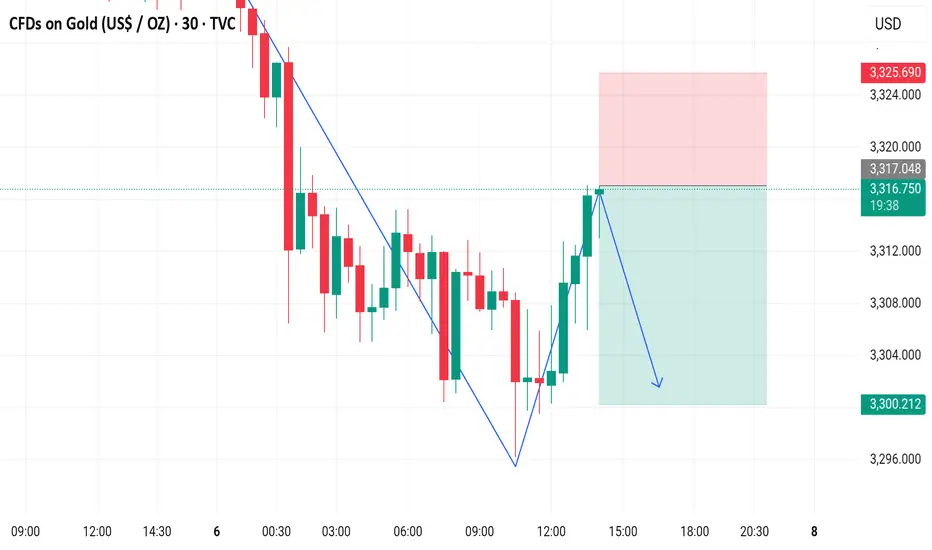
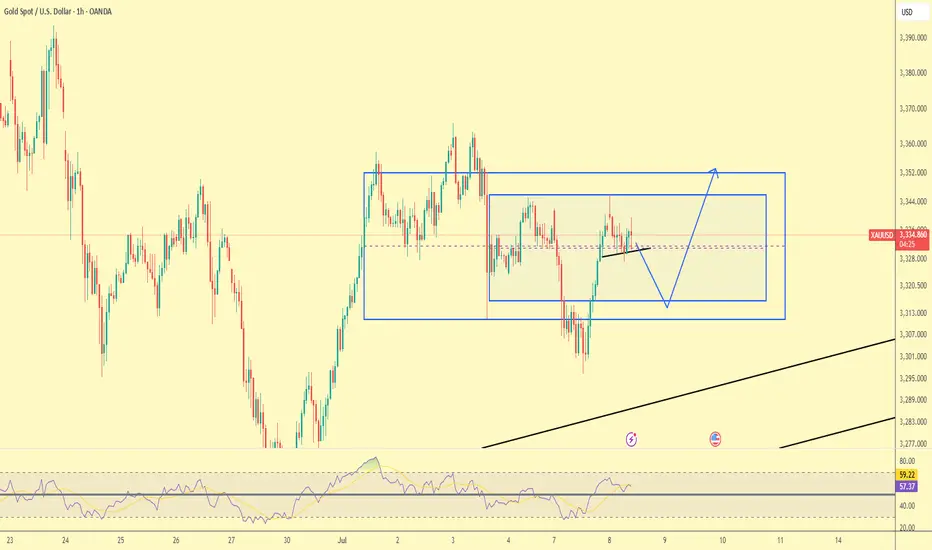
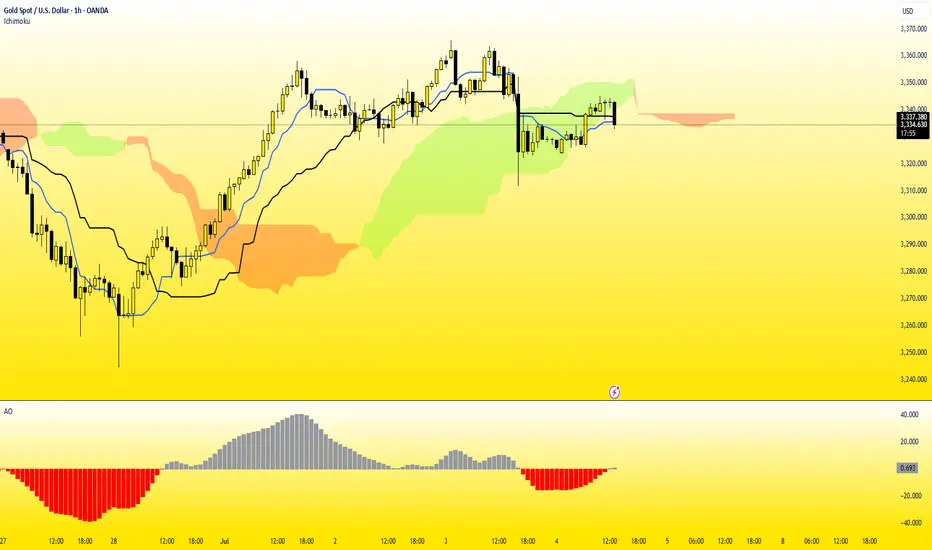
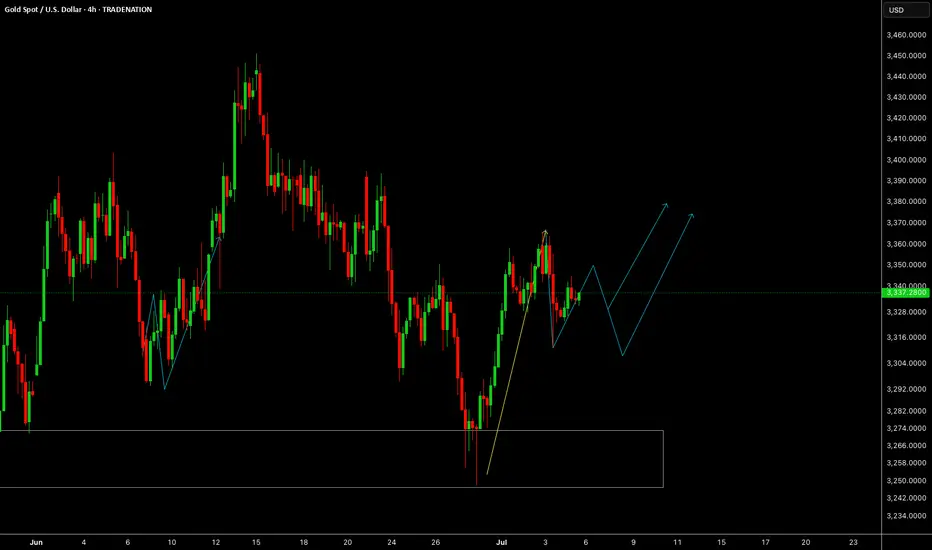
XAUUSD – Correction or Reversal? 1. What happened yesterday
As expected, Gold started to rise after finding support at 3250. The move up played out perfectly, reaching the resistance area highlighted in yesterday’s analysis — around 3320–3340.
________________________________________
2. The key question today
Is this just a correction in a bearish trend, or the start of reversal?
________________________________________
3. Why I remain bearish
• On the weekly chart, structure still leans bearish
• On lower time frames, the bounce looks corrective — not impulsive
• No breakout above 3360 yet, which would be needed to shift the bias
• A move back below 3320 would likely trigger renewed selling
• If that happens, 3250 could be tested again quickly
We need to respect the bounce — but not overreact to it.
________________________________________
4. Trading plan
My bias remains bearish as long as price stays under 3360.
However, if we get a daily close above 3360, I’ll pause and re-evaluate the short bias. The market would then be signaling a potential trend shift.
________________________________________
5. Final thoughts 🚀
This is a key moment for gold. We’re at resistance zone but not broken above yet.
Until proven otherwise, the trend remains down — and rallies into 3340 zone should be considered selling opportunities.
Disclosure: I am part of TradeNation's Influencer program and receive a monthly fee for using their TradingView charts in my analyses and educational articles.
XAUUSDG trade ideas
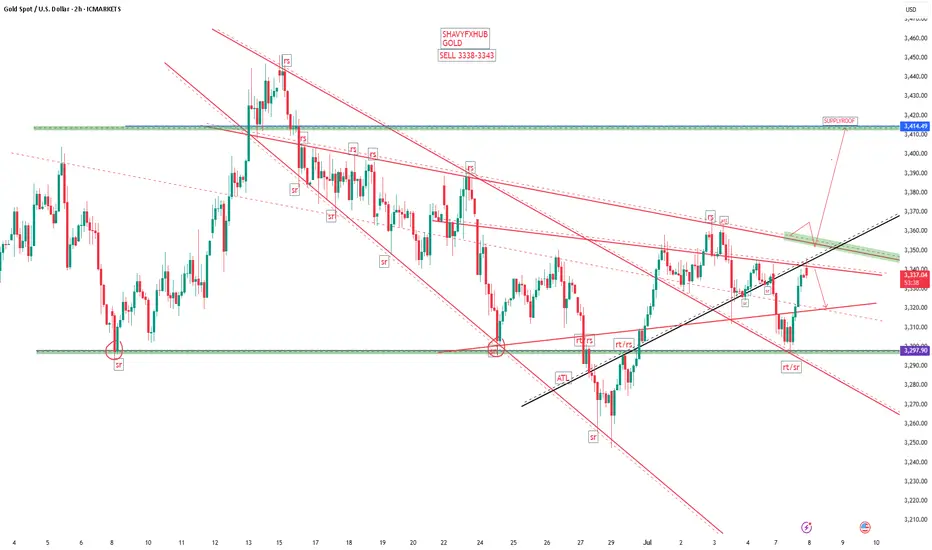
Shorts trapped? No, the head and shoulders top is still downOver the weekend, I gave a trading strategy for going long at 3315-3305. Today, I updated and optimized the long order trading, maintained the high-short-low-long trading strategy, and began to rebound near the 3300 line, and successfully touched the long TP 3333. At present, I am executing short trades again according to the trading strategy and holding short orders.
Although gold has only retreated to around 3330, I am not worried about losses and failures in short trades. As I wrote in today's post, the daily K-line chart has a head and shoulders top pattern. As long as the bulls fail to recover 3360, it is still a short trend. Therefore, in the short term, I still think that the rebound is a good opportunity for us to go short.
At present, the short-term bullish momentum of gold has been consumed and the downward trend continues. Therefore, I still insist on holding short orders in the short term.
In addition to investment, life also includes poetry, distant places, and Allen. Facing the market is actually facing yourself, correcting your shortcomings, facing your mistakes, and being strict with yourself. I share free trading strategies and analysis ideas every day for reference by brothers. I hope my analysis can help you.
FXOPEN:XAUUSD PEPPERSTONE:XAUUSD FOREXCOM:XAUUSD FX:XAUUSD FXOPEN:XAUUSD OANDA:XAUUSD TVC:GOLD
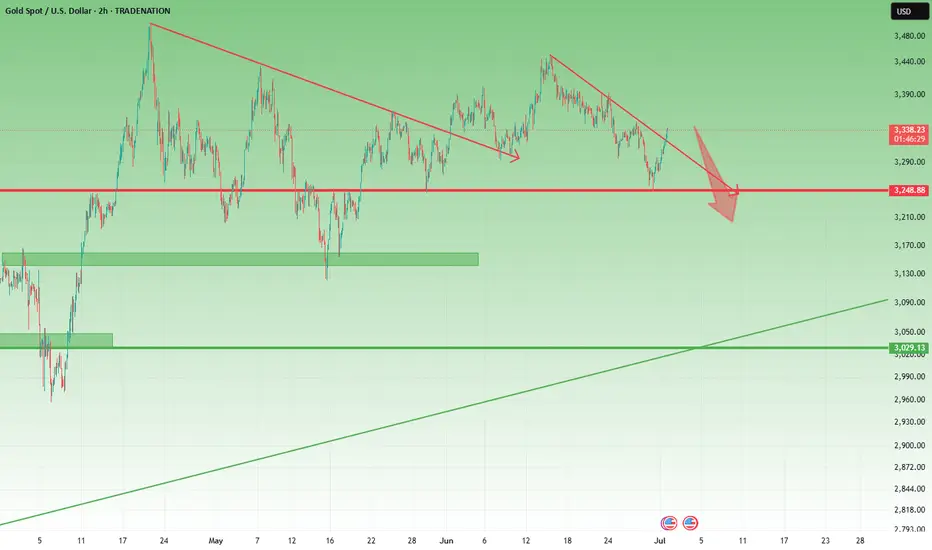
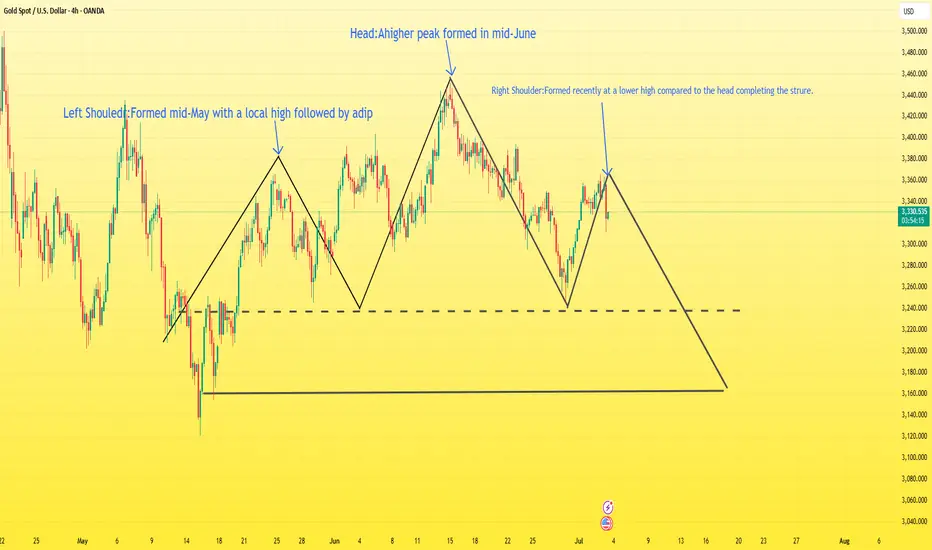
Will gold return to 3500?XAU/USD Head and Shoulders Breakdown Analysis
The chart shows a classic Head and Shoulders pattern forming on the 4H timeframe, indicating a potential bearish reversal setup.
Left Shoulder: Formed mid-May with a local high followed by a dip.
Head: A higher peak formed in mid-June.
Right Shoulder: Formed recently at a lower high compared to the head, completing the structure.
The neckline has been clearly defined, and price is currently hovering just above it. If the price breaks and closes below the neckline with strong bearish momentum, it would confirm the pattern.
Target: The projected target from the breakdown is around 3163, calculated by measuring the height from the head to the neckline and projecting it downward.
Outlook:
A confirmed break below the neckline would open the door for further downside toward the target zone.
Bears will be in control if price sustains below the neckline with increasing volume.
Wait for confirmation on the neckline break before considering short entries.
If you are a newbie or your account is burning, don't trust any advice easily. Contact me. I will give you free advice.
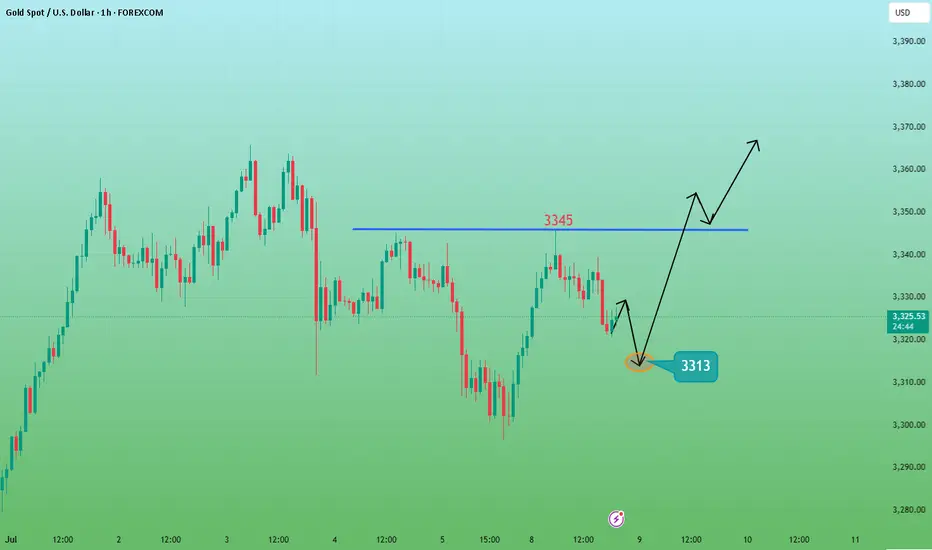
Gold is bullish and needs more momentum at 3320The buying pressure in the US session pushed the price up and formed a bullish hammer candle on D1. Today's bearish recovery is seen as a buying opportunity to head towards the uptrend again.
3344 is the immediate resistance zone in the European session that Gold faces. Breaking this resistance zone will head towards 3365. According to the wave structure, it would be great to have a retest of 3320 to find some buying momentum and then break 3344.
SUPPORT: 3320-3297
RESISTANCE: 3345-3352-3365
SELL Trigger: Break 3320 ( Trendline & break zone)
Do you have any comments on the trading plan? I would love to hear your views.

Short gold, the bears will still counterattack after the reboundGold rebounded to the 3305-3315 area as expected, and our gold long position successfully won 360pips profit. So after standing above 3,300 again, will gold resume its bullish trend?
I think that although gold has stood above 3300 again, it cannot be confirmed that the decline has been completely reversed for the time being. Relatively speaking, gold bears still have the upper hand. In the short term, gold is under pressure in the 3325-3335 area, so before recovering this area, gold bears still have repeated fluctuations, and may even test the 3305-3295 area again. So we can't blindly chase gold in trading.
Before gold recovers the 3325-3335 area, gold can only be regarded as a rebound, not a reversal. So gold bears may counterattack at any time, so in short-term trading, we can consider shorting gold with the 3325-3335 area as resistance after gold rebounds. The first entry area that must be paid attention to is 3320-3330.
Gold Trade Plan 08/07/2025Dear Trader,
Gold (XAUUSD) Analysis – 1H Timeframe | July 8, 2025
Gold has retraced from the 3,352–3,345 resistance zone and is now forming a slight bullish consolidation (small ascending triangle). A pullback toward the 3,316–3,311 support area is possible.
If price holds above this support, a bullish continuation toward 3,345 and 3,352 is likely. The 3,311 zone can act as a good potential scalp-buy area.
✅ Key Levels:
Resistances: 3,345 / 3,352
Supports: 3,316 / 3,311
Short-term trend: Bullish if support holds
RSI is at 56 — still has room for upward movement.
📌 Suggested Strategy: If price pulls back to 3,311–3,316 and shows confirmation (e.g., bullish candle pattern), short-term buy entries with targets at 3,345 and 3,352 can be considered.
Regards,
Alireza!
GOLD Sell IdeaGold Trade Alert (XAU/USD): I’m entering a sell position in the 3324–3330 zone, targeting a drop to 3273 with a stop loss at 3340 to protect against unexpected spikes. Looking for the price to retrace toward the lower support area.
Always manage your risk and watch for momentum confirmation before entry.
Entry: 3324 - 3330
SL: 3340
TP: 3273
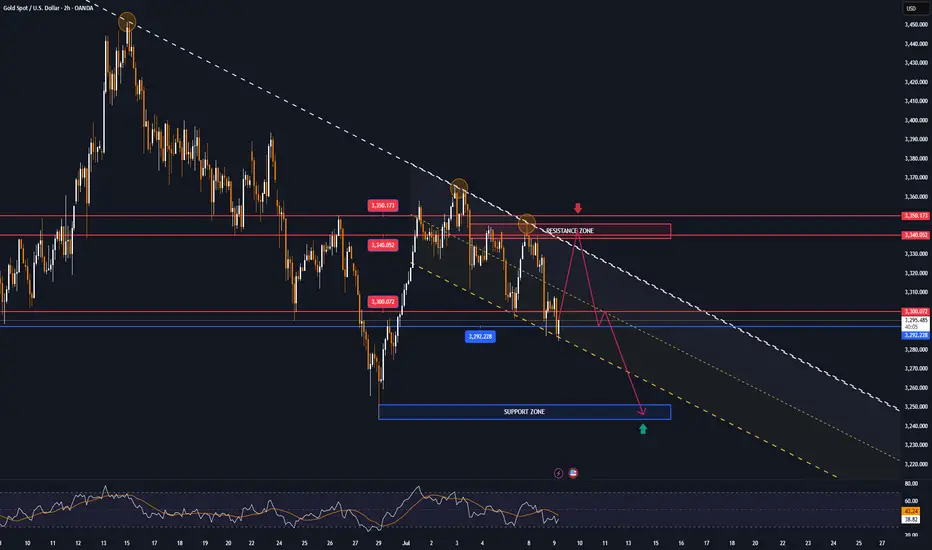
GOLD is in bearish conditions, pressured by aggressive tariffsOn Wednesday (July 9) in the Asian market, the spot OANDA:XAUUSD suddenly fell sharply in the short term, and the gold price just fell below 3,290 USD / ounce.
Although US President Trump announced that the first tariff letters had been sent to some US trading partners, the gold price fell below 3,290 USD / ounce due to the weakening demand for safe-haven gold. Trump postponed the tariff deadline to August 1, easing trade tensions.
The recovery in the dollar TVC:DXY and rising US Treasury yields also weighed on gold, sending prices sharply lower after hitting a high of $3,345 an ounce.
The yield on the 10-year US Treasury note TVC:US10Y rose to its highest in more than two weeks, making gold, which does not pay interest, less attractive as an investment.
The yield on the 10-year US Treasury note rose to 4.415%. The US real yield also rose 4 basis points to 2.073%.
TVC:DXY , which tracks the greenback's performance against a basket of currencies, rose 0.20% to 97.70. The rise in the Dollar Index means that gold priced in dollars has become less attractive because they are inversely correlated.
Japan and South Korea said on Tuesday they would try to speed up trade talks with the United States in a bid to soften President Donald Trump's stance on new tariffs set to take effect on August 1.
But optimism about a trade deal boosted market risk appetite, limiting gold's upside.
Traders are awaiting the release of the minutes of the Federal Reserve's latest meeting on Wednesday, followed by data on initial jobless claims for the week ended July 5.
Investors now expect the Fed to cut interest rates by 50 basis points before the end of the year, starting in October.
Technical Outlook Analysis OANDA:XAUUSD
On the daily chart, gold fell below the 3,300USD whole price point and the 0.382% Fibonacci retracement level, which are the initial conditions for gold prices to have a prospect for a bearish trend.
Currently, with the position below 3,300USD, gold may continue to decline with the next target around 3,246USD in the short term, more than the 0.50% Fibonacci retracement level.
The current resistances of gold prices are the pressure from the EMA21 line, followed by the 0.236% Fibonacci retracement. These are also the resistance positions that readers paid attention to in the previous issue.
In addition, the RSI is pointing down from 50, currently 50 is considered the nearest resistance and the fact that the RSI is pointing down is quite far from the oversold zone, indicating that there is still room for a decline ahead.
During the day, although the trend is not yet completely clear, gold is showing conditions that are more inclined towards a decline, along with that, the notable positions will be listed as follows.
Support: 3,292 - 3,246 USD
Resistance: 3,300 - 3,340 - 3,350 USD
SELL XAUUSD PRICE 3346 - 3344⚡️
↠↠ Stop Loss 3350
→Take Profit 1 3338
↨
→Take Profit 2 3332
BUY XAUUSD PRICE 3245 - 3247⚡️
↠↠ Stop Loss 3241
→Take Profit 1 3253
↨
→Take Profit 2 3259
XAUUSD – High-Precision Sell Setup with 1:2.70 R/RGreetings, traders.
After a brief tactical pause, we’ve identified a **high-conviction short setup** on **XAUUSD**.
Despite the U.S. Independence Day holiday, structural momentum suggests there’s still room for meaningful movement in gold during today’s session. The risk-to-reward profile on this setup is exceptional — clocking in at **1:8.70**, it meets our highest-tier execution standards.
If momentum stalls or price consolidates excessively, the trade will be manually closed by **23:00 (UTC+4)**, regardless of outcome.
🧠 Trade Parameters:
• **Timeframe:** 1-Hour (H1)
• **Direction:** Sell
• **Entry:** 3337.09
• **Take Profit:** 3312.16
• **Stop Loss:** 3345.63
• **Risk/Reward Ratio:** 1:2,70
• **Trade Management Note:** Will be closed manually by 23:00 (UTC+4) if momentum conditions are not met.
🔗 Signal Source
All trade setups are published directly by Velatrix Capital — a high-discipline trading desk focused on FX, crypto, and global indices.
No opinions. No hype. Just statistically-grounded execution.
All signals are posted via our TradingView desk:
👉 (tradingview.sweetlogin.com)
📈 **We don’t chase hype. We build edge.**
🔔 **Subscribe for future setups and institutional-grade trade intelligence.**
**Velatrix Capital**
XAUUSD SELLWe had a market structure shift (MSS) followed by a break of structure (BOS), then a second BOS that triggered a retracement into the Fibonacci Optimal Trade Entry (OTE) level, forming a swing high — an ideal setup to go short.

DeGRAM | GOLD rebound📊 Technical Analysis
● Price is coiling inside a contracting triangle whose base sits on the blue up-sloping support line (~3 312); successive higher reaction-lows signal buyers defending trend structure.
● A 1 h candle through the triangle top 3 330 would confirm breakout and allow a run to the June swing cap at 3 345, with the pattern’s measured move aligning with the channel mid-band at 3 389.
💡 Fundamental Analysis
● Powell’s testimony hinting at “better balance” in the labour market trimmed 2-yr real yields, while latest IMF data show central-bank gold buying expanding for a fourth month, underpinning spot demand.
✨ Summary
Long 3 312-3 330; breakout >3 330 targets 3 345 → 3 389. Bull view void on an H1 close below 3 300.
-------------------
Share your opinion in the comments and support the idea with a like. Thanks for your support!
Gold sell off before continuation higher? Pending order set on this one before bed
Will see what develops overnight
GOLDGOLD needs more upside after this correction, next reaction will be coming above 3345 and if consolidates it's a push up further towards 3380 otherwise drop from 3345 above and push up again from below 3300.
Disclosure: We are part of Trade Nation's Influencer program and receive a monthly fee for using their TradingView charts in our analysis.
Gold Trade Plan 10/07/2025Dear Traders,
Technical Analysis of XAUUSD (Gold vs USD) – July 10, 2025
Price has recently broken out of a falling channel (black lines) and is now testing a key resistance zone (marked in blue):
Resistance Zone: 3329 to 3334 – price is reacting to this area, and it might reverse downward.
Support Zone: 3306 – if price declines, this is a potential target.
📉 Possible Scenario:
If price gets rejected from 3329–3334, it may head back down toward the 3306 support zone.
If price breaks and holds above 3334, the bullish trend could continue.
📊 The RSI is around 54, in neutral territory. No major divergence is seen, but the move out of oversold territory suggests growing buyer strength.
Regards,
Alireza!
Will gold continue to fall?Judging from the current trend of gold, it is weak in the early trading and continues to break lows in the European trading. Then there will be a second bottoming action in the US trading. Pay attention to the 3330 and 3335 areas for short selling before the US trading. Pay attention to the two support levels of 3318-3315 below. The market changes in real time, and it is recommended to operate in real time according to my prompts before the trading!
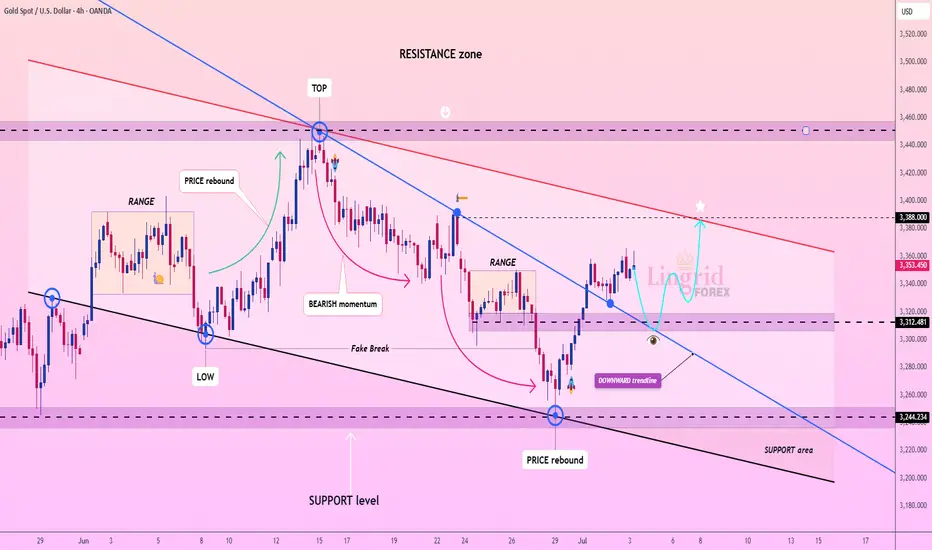
Lingrid | GOLD Pre-NFP Price Action AnalysisThe price perfectly fulfilled my last idea . OANDA:XAUUSD rebounded strongly from the 3244 support area, breaking above the downward trendline and pushing into the mid-resistance band. The price is currently testing 3353 and could pull back slightly before retesting the 3388 key resistance level. A sustained breakout above that red trendline would open the door for a run toward 3450.
📈 Key Levels
Buy zone: 3312–3330 (post-breakout retest area)
Sell trigger: break below 3312 and close under trendline
Target: 3388 with potential extension to 3450
Buy trigger: confirmed bullish bounce from 3312 and momentum above 3353
💡 Risks
Resistance at 3388 may cause rejection if volume fades
Downward trendline remains a structural cap unless fully broken
False breakout could return price back to 3244 zone quickly
If this idea resonates with you or you have your own opinion, traders, hit the comments. I’m excited to read your thoughts!
GOLD GOLD ,my call for buy on 3285 is standing at 3307 and the descending trendline will remain the demand floor until broken.

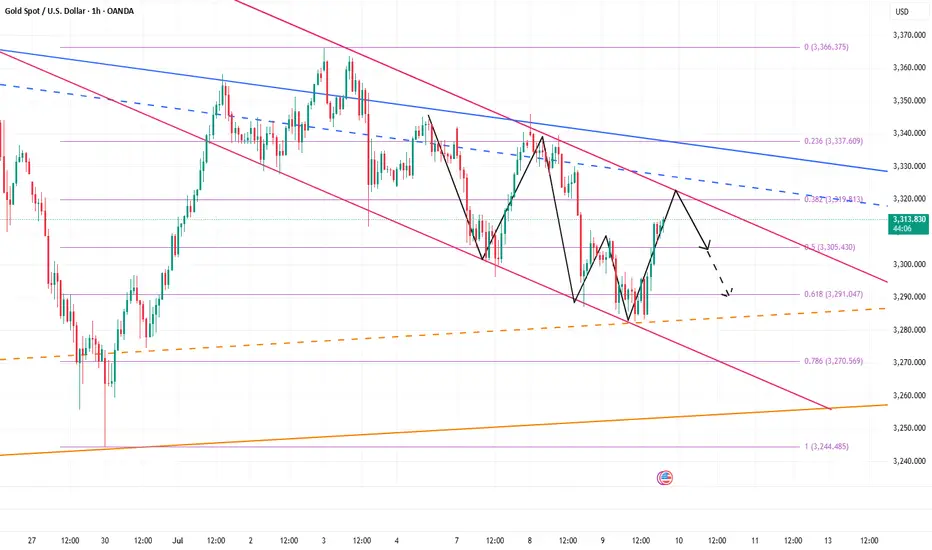
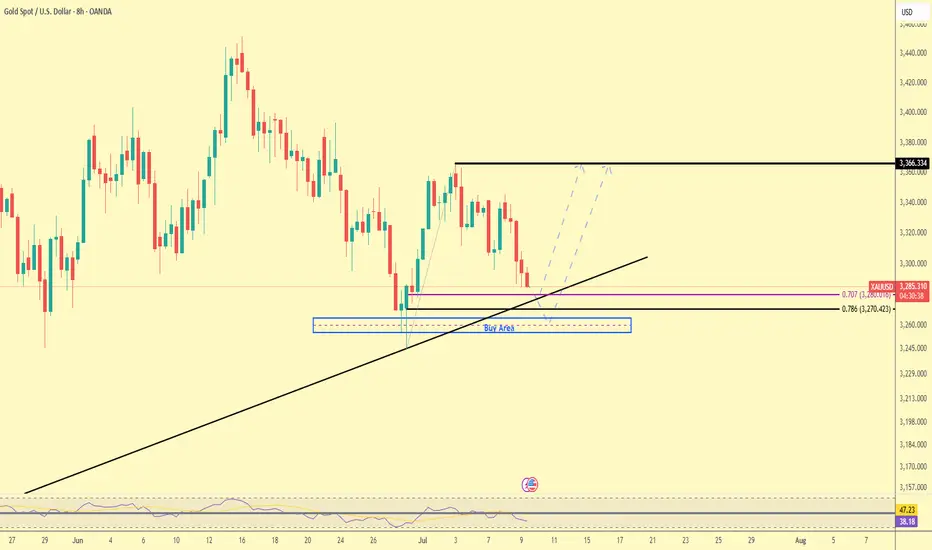
Gold Trade Plan 09/07/2025Dear Traders,
Price Context:
Gold (XAUUSD) is currently trading around $3285, having broken below the mid-channel level.
Key Levels:
Support Zone (Buy Area): Marked between ~$3270–$3280 (includes 0.786 Fibonacci level at 3270).
Resistance: $3366 (previous high, strong resistance).
Trendline:
An ascending trendline intersects with the buy zone, increasing the probability of a bullish reaction.
Potential Scenarios:
Bullish Reversal: A bounce from the current buy zone could trigger a move toward $3366.
Bearish Continuation: If price breaks and closes below $3270 with strong momentum, next support would be around $3242.
RSI Indicator:
Currently near oversold territory (~38), which supports a potential bounce.
📌 Conclusion:
This is a critical zone; watch for price action signals near the trendline and 0.786 level. Reversal is possible, but further downside risk remains if $3270 fails.
Regards,
Alireza!
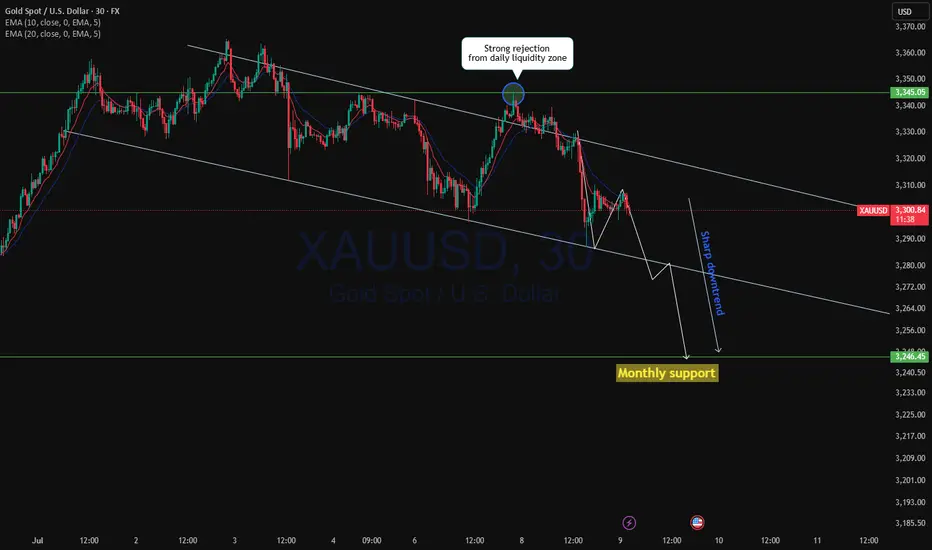
XAUUSD Continue to drop?XAUUSD from daily resistance of 3345.00 after strong liquidity grab price started to fall with strong momentum to the daily support level. Yesterday we have seen a long daily doji formed with a long wick at the bottom followed by wick fill as expected with long bearish engulfer with both cross over of 10ema and 20ema.
Currently price in sharp downtrend and possibility to drop to monthly support below 3250.00
A bearish trade is high probable.
Sell target now confirmHello guys this is confirm target so don't miss any one client first you can try then contact me I hope understand