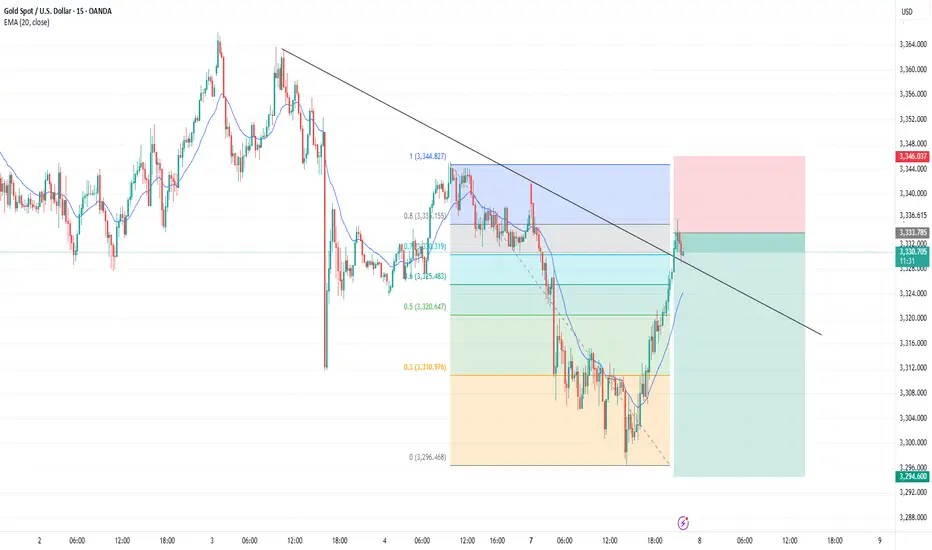
Gold delivering excellent Scalp opportunitiesGold has tested #3,330.80 Resistance and got rejected many times as I firstly Bought Gold from #3,322.80 towards #3,330.80 Resistance zone in extension. Later on, I have added Selling order on #3,327.80 to the downside and closed it on #3,320.80. I have engaged Buying order on #3,318.80 Support once again and added more Buying orders on #3,321.80 / closed all before #3,327.80 and ultimately Sold again on #3,327.80 towards #3,318.80. Excellent Scalping opportunities throughout yesterday's session.
Technical analysis: Since the #3,318.80 breakout point was not compromised, the Price-action Naturally spiked to the #3,327.80 - #3,330.80 Resistance zone mentioned on the previous commentary. Based on the #5-session Higher High’s sequence, this zone is the new local High’s (very possible that Price-action is pricing a Top here, temporary or not) and as both the Hourly 4 chart and Daily chart are Neutral to a very great extent and does not look so good for Buyers (Gold is already critically Overbought within #3,340's, I should Naturally expect a correction within #1 - #3 session horizon. The Technical answer is the Hourly 1 chart’s Support near #3,327.80, which has been always touched after every Higher High’s rejection and holding as flood gate towards #3,322.80 and #3,318.80 wall of Support zones. Gold is kept Higher on pure Fundamental gradient and weak DX (on a parabolic downtrend) but this state has to end sooner or later and Gold should continue it’s Bearish trend and connect with the fair Technical Price around #3,300.80 mark or less. The turmoil with the Inflation in U.S. causing Investors turn to capital from riskier assets for protection (safe-havens in High demand such as Gold), thus causing Gold to gain value. Regardless, DX is the strongest correlation driving Gold at the moment. Fundamentally though Gold is Bullish and cannot overcome such patterns as it is overreacting to every DX and Bond Yields movements.
My position: I am currently Buying #3,332.80 Bottom (third Scalp this morning all closed on #3,335.80) and holding last one until #3,340.80 ideally and with that regardless what happens on U.S. opening, I will call it for the session and comfortably take early weekend break since I am Highly satisfied with my returns. Enjoy the Profits and have a great weekend!
XAUUSDG trade ideas
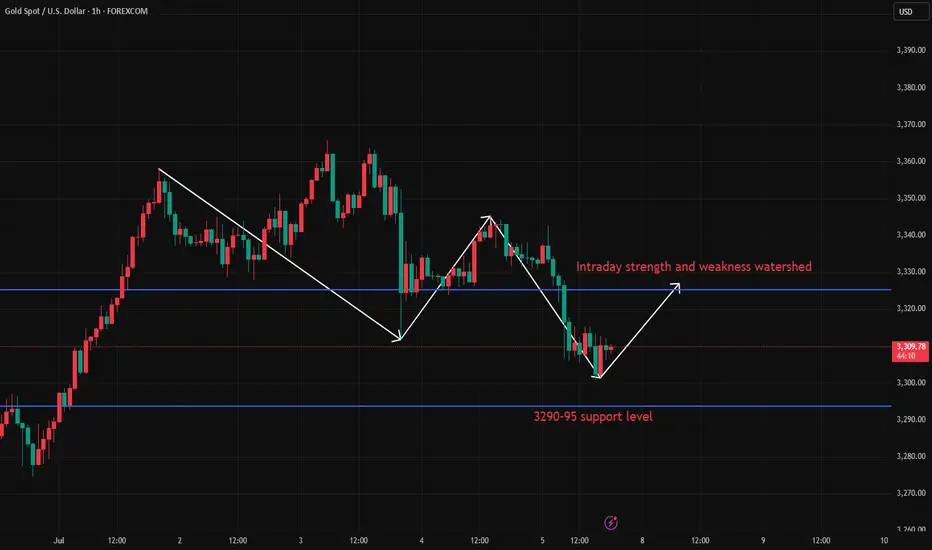
Gold price plunges by $30 at openingGold fell sharply at the opening of the morning session, with the intraday high and low price difference exceeding 30 US dollars. The positive factors over the weekend failed to reverse the bullish trend, and the bearish forces prevailed. Gold fell sharply in the last week of June, and bottomed out and rebounded in the first week of July. The market is in fierce competition between bulls and bears, and the volatile pattern has not changed. At present, gold has fallen below the non-agricultural low of 3311, and the market is weak. There is a high probability of a high and fall in the future. The short-term resistance is in the 3325-27 area, which is the intraday strength and weakness watershed; the 3343-45 area is the key boundary between bulls and bears. If it is not broken, it will fall back. If it breaks through, it is expected to hit 3365, 3380 or even 3400. The current support below is 3295-3290, and the resistance above is 3317-3323. It is recommended to do more in the callback.
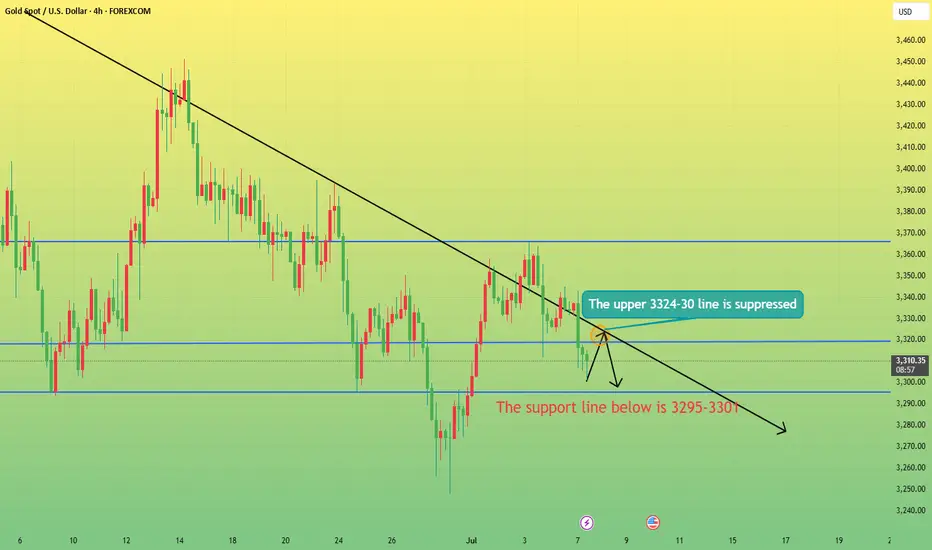
Where will the price of gold go under such strong pressure?From the 4-hour analysis, the support line of 3295-3301 is concerned below, the short-term resistance above is concerned about 3316, and the suppression line of 3345-50 is focused on. The overall main tone of high-altitude low-multiple cycle participation remains unchanged. In the middle position, watch more and do less, and follow orders cautiously, and maintain the main tone of participation in the trend. Wait patiently for key points to participate.
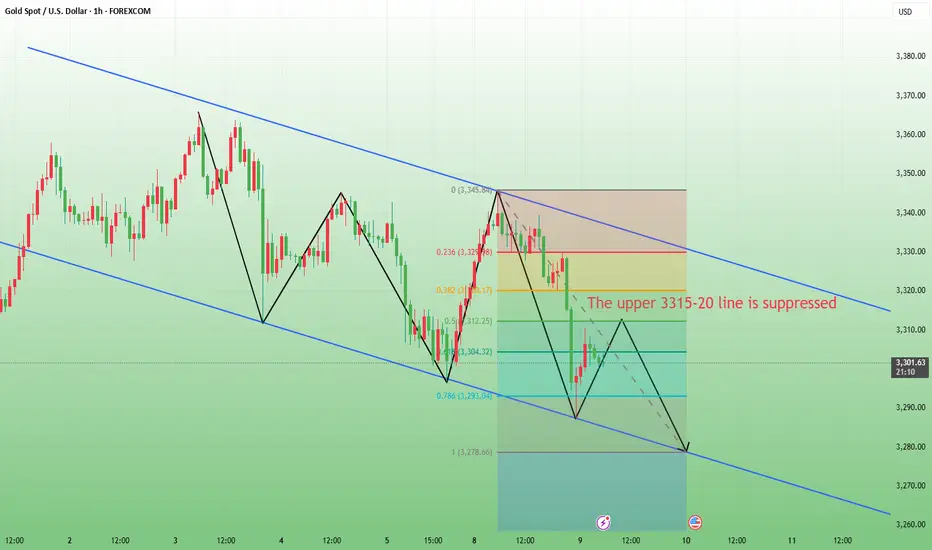
The risks of shorting at low levels have been informed!Today, I have reminded you many times not to chase short positions at low levels. Now you can see that gold has bottomed out and rebounded. We also bought gold in batches at 3285-3295, and the long positions also made perfect profits. I believe that friends who follow my articles can see that I have always emphasized not to short at low levels. It is also obvious to everyone that we bought long positions near 3295-3285. In the future, we will continue to pay attention to the suppression of the upper 3318-3325 line. If the rebound does not break, we will look for opportunities to short. I hope everyone can grasp the entry position and hold the profit. The rebound will first look at the previous break point of the 3325 line, and then short when the rebound is suppressed! If your current gold operation is not ideal, I hope I can help you avoid detours in your investment. Welcome to communicate with me!
From the current analysis of gold trend, today's upper short-term resistance focuses on the hourly top and bottom conversion position of 3318-3325. The intraday rebound relies on this position to go short once and look down. The lower short-term support focuses on 3280. The overall support relies on the 3280-3325 area to maintain the main tone of high-altitude low-multiple cycles. In the mid-line position, keep watching and do less, be cautious in chasing orders, and wait for the opportunity to enter the market after the key points are in place.
Gold operation strategy: short gold rebounds near 3318-3325, target 3305-3295.
maintain bullish, break H1 trend⭐️GOLDEN INFORMATION:
Gold prices (XAU/USD) trade in the red near $3,330 during Tuesday’s Asian session, weighed down by a stronger US Dollar (USD). The precious metal loses ground amid easing trade tensions, following US President Donald Trump’s announcement of a tariff deadline extension and his openness to further negotiations.
Market anxiety subsided after Trump signaled flexibility around the August 1 tariff deadline, describing it as “not 100% firm” and suggesting room for continued adjustments. This renewed optimism over trade policy has strengthened the Greenback, thereby pressuring USD-denominated assets like Gold, which becomes more expensive for holders of other currencies.
⭐️Personal comments NOVA:
Gold price accumulates waiting for news of new tariff information, breaking H1 trend. Good buying power
⭐️SET UP GOLD PRICE:
🔥SELL GOLD zone: 3364- 3366 SL 3371
TP1: $3350
TP2: $3340
TP3: $3330
🔥BUY GOLD zone: $3300-$3298 SL $3293
TP1: $3310
TP2: $3325
TP3: $3340
⭐️Technical analysis:
Based on technical indicators EMA 34, EMA89 and support resistance areas to set up a reasonable BUY order.
⭐️NOTE:
Note: Nova wishes traders to manage their capital well
- take the number of lots that match your capital
- Takeprofit equal to 4-6% of capital account
- Stoplose equal to 2-3% of capital account
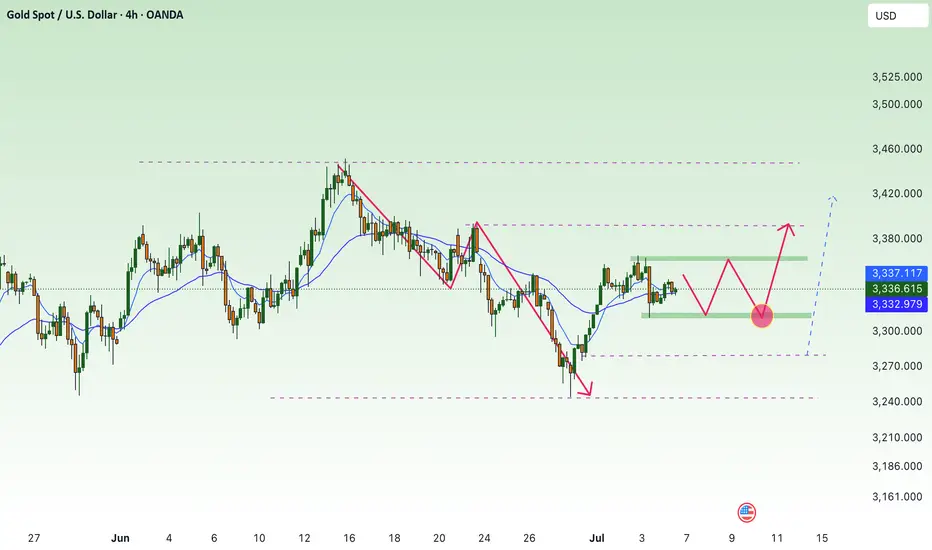
Gold lacks downside momentum: Next week's analysis & adviceGold trading is relatively light today due to the U.S. Independence Day holiday. On the downside, we continue to focus on the short-term support at the 3325 level, while the key resistance above remains in the 3345-3350 range, which was yesterday's breakdown point. The market has closed early today, and price action has been stuck in a range-bound consolidation.
After plunging $40 on the back of bearish non-farm payroll data, gold stabilized and rebounded, recouping nearly half of the losses. This performance confirms that the downside space is limited. Currently, the market has returned to a oscillating upward pattern, and the weekly chart is likely to continue range-bound fluctuations. From a technical perspective, the 3325 level has formed a key support. The secondary retest overnight confirmed the bottom structure, and the gradual lifting of early session lows has also released a bullish signal. Looking ahead to next week, gold is expected to continue its bullish trend. If the 3325 support level below remains unbroken, one can look for opportunities to establish long positions.
XAUUSD
buy@3325-3330
tp:3340-3360-3380
Investment itself is not the source of risk; it is only when investment behavior escapes rational control that risks lie in wait. In the trading process, always bear in mind that restraining impulsiveness is the primary criterion for success. I share trading signals daily, and all signals have been accurate without error for a full month. Regardless of your past profits or losses, with my assistance, you have the hope to achieve a breakthrough in your investment.
Gold To The Basement? Week Ahead with Bearish Bias by PhoenixFX🌟 Welcome to Phoenix FX’s Intraday Pulse! 🌟
Hello, Phoenix FX family! 👋 I’m thrilled you’ve joined us for today’s TradingView chart breakdown. Our focus? Intraday opportunities—spotting those high-probability setups you can enter, manage, and leave to run whilst you concentrate on the things you love doing.
Here’s what you’ll find in this analysis:
Key Levels & Zones: Support, resistance, and Fair Value Gaps that matter on the smaller timeframes.
Price-Action Clues: Exact candlestick patterns and momentum signals to watch for your next entry.
Trade Triggers & Targets: Clear criteria for when to get in, where to take profits, and how to manage your risk.
Whether you’re hunting quick scalps or tactical swing moves, our goal is simple: help you trade with confidence, clarity, and community support. Got a different view or a fresh idea? Drop it in the comments—after all, “each one, teach one.” 😉
Let’s dive into the charts and make today’s market moves count! 🚀📈
Donald Trump’s presidency continues to exert outsized influence on gold through three main channels: trade policy uncertainty, fiscal stimulus (and resulting deficits), and shifts in safe-haven demand. Here’s how each factor has played out—and what it could mean for gold going forward:
1. Trade-War Uncertainty
What’s Happening: The Trump administration’s aggressive use of tariffs—including recent 25% duties on goods from Japan and South Korea—has periodically roiled markets and driven investors into gold as a safe haven. On July 7, gold pared losses after tariff news, as traders sought refuge despite a firm dollar.
Looking Ahead: If further tariff escalations or retaliations emerge, expect renewed spikes in gold. Conversely, any de-escalation or trade-deal breakthroughs could sap that safe-haven bid.
2. Fiscal Stimulus & Deficits
What’s Happening: Senate Republicans recently passed a Trump-backed tax‐and‐spending package projected to add $3.3 trillion to the U.S. deficit. Larger deficits—especially when financed by the Fed—tend to stoke inflation expectations, which bolsters gold’s appeal as an inflation hedge.
Looking Ahead: Continued large-scale stimulus or fresh tax cuts without offsetting revenue measures could keep real yields low (or negative), a classic tailwind for gold.
3. Safe-Haven Flows & Investor Positioning
What’s Happening: Despite peaking at record highs earlier this year, gold remains up roughly 30% since November, driven largely by investor fears around Trump’s policy unpredictability and geopolitical tensions.
Looking Ahead: Should Trump-era uncertainty persist—whether around trade, foreign policy, or domestic turmoil—gold is likely to retain its status as a portfolio diversifier and crisis hedge. A sustained drop in U.S. real rates or fresh bouts of market volatility would reinforce that trend.
🎯 Outlook Summary
Bullish Drivers: Ongoing trade-war rhetoric, larger deficits, and any new geopolitical flashpoints.
Bearish Risks: Clear resolution of major trade disputes, a pivot by the Fed toward earlier rate cuts (reducing real‐rate support for gold), or diminished investor fear.
------------------------------------------------------------------------------------------
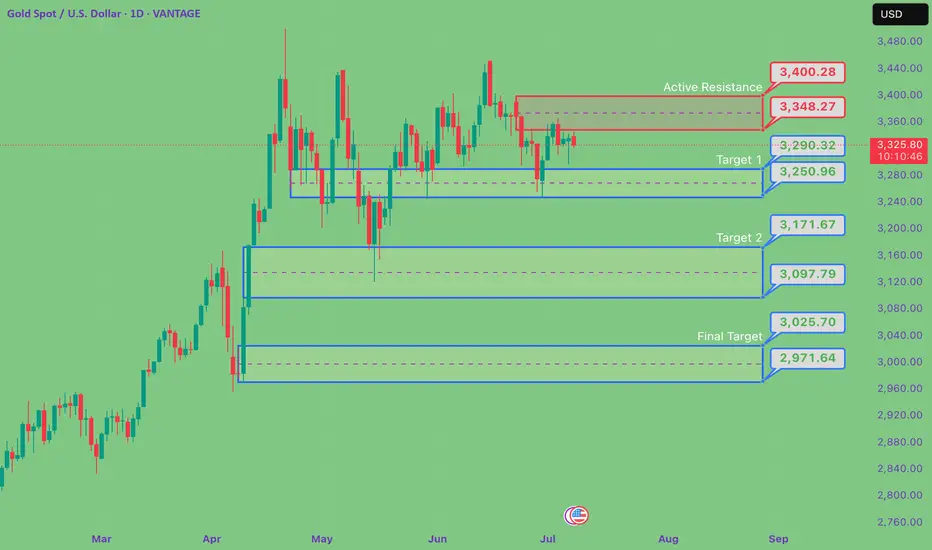
PhoenixFX price action analysis based on the Daily time frame
🔴 Primary Resistance (Daily)
Zone: $3,348 – $3,400
Why It Matters:
Multiple daily closes have stalled here, leaving a clear Fair-Value Gap (dashed purple). Sellers are likely to defend this range until we see a decisive daily close above $3,400.
📉 Bearish Bias – Short Setups
Short at Resistance
Entry: Bearish daily reversal candle (engulfing, pin-bar) in $3,348–$3,400
Targets:
TP1: $3,290 (50% of Primary Buy Zone)
TP2: $3,250 (Primary Buy Zone low)
TP3: $3,172 (Secondary Buy Zone high)
Stop-Loss: Above $3,420
Breakdown Short
Trigger: Daily close below $3,250 (Primary Buy Zone low)
Entry: On the open of the next daily candle after close below $3,250
Targets:
TP1: $3,172 (Secondary Buy Zone)
TP2: $3,026 (Final Buy Zone 50% level)
Stop-Loss: Above $3,290
🔵 Potential Long Opportunities
Defensive Long (Aggressive)
Entry: Bullish daily rejection candle in $3,250–$3,290
Targets:
TP1: $3,348 (short-term resistance)
TP2: $3,400 (key resistance)
Stop-Loss: Below $3,230
Trend-Reversal Long (Ultra-Conservative)
Trigger: Daily close above $3,400
Entry: Open of the next daily candle after the close above $3,400
Targets:
TP1: $3,450
TP2: $3,500+
Stop-Loss: Below $3,360
📊 Week-Ahead Scenarios
Bearish Scenario (High Probability):
Price remains capped under $3,400.
Look for a bearish signal in $3,348–$3,400 to initiate shorts.
A break below $3,250 extends the move into deeper demand zones ($3,172 → $3,026).
Bullish Counter-Trend (Lower Probability):
Strong daily rejection candle in $3,250–$3,290 could spark a relief rally.
Short-term longs can target $3,348 and $3,400—ideal for quick swing trades.
Only a sustained daily close above $3,400 shifts the bias back to the upside.
Just a Heads-Up:
This is my take on the charts—not gospel, not financial advice, and definitely not a crystal ball 🔮.
Trading is part skill, part patience, and part “what just happened?” 😅
We all see things a little differently, and that’s the beauty of it. So if you’ve got a hot take, wild theory, or just want to drop some chart wisdom—hit the comments!
Let’s grow, learn, and laugh through the madness together. 🚀📈
Each one, teach one.
— Phoenix FX Team 🔥🦅
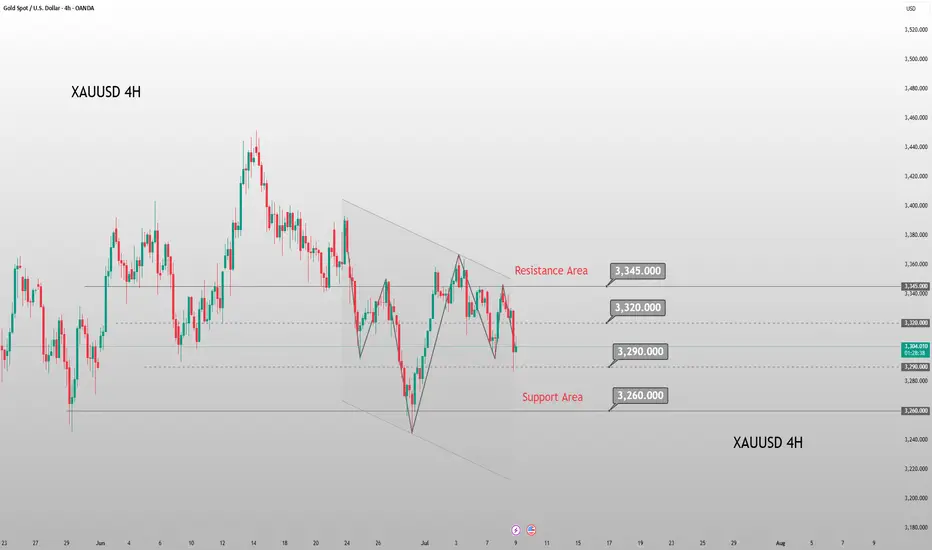
Wednesday's Gold Trend Analysis and Trading RecommendationsGold surged on Tuesday but then kept pulling back during the U.S. session, hitting a recent new low, with intense seesawing between bulls and bears currently. The fluctuating U.S. tariff policies have triggered volatility in risk-averse sentiment, while the over 95% probability that the Federal Reserve will keep interest rates unchanged in July has provided support to the U.S. dollar.
Technically, focus should be on the key support level around 3260 and the strong resistance range of 3320 above. The hourly chart shows short-term moving averages diverging downward, with candlesticks under pressure and showing short-term weakness, suggesting there is still a need for a pullback tomorrow. The current bull-bear watershed lies at the 3390 mark; if gold fails to break through and stabilize above 3315 effectively, any short-term rebound can be seen as a good opportunity to enter short positions.
The 4-hour chart indicates that gold found support near 3287 and slowly recovered losses, but it remains trapped in a consolidation pattern recently. Although the 3287 support is effective, the consolidation range has not been broken. The future direction depends on the actual defensive strength of the 3260 support level and the direction of the range breakout.
For Wednesday's trading, the main strategy is to go short on rebounds. Focus on the resistance zone of 3315-3320, where short positions can be established. The downside targets are 3270 and the key support level of 3260 in sequence. If 3260 is broken through effectively, it may open up more downward space.
XAUUSD
sell@3315-3320
tp:3300-3280-3260
Investment itself is not the source of risk; it is only when investment behavior escapes rational control that risks lie in wait. In the trading process, always bear in mind that restraining impulsiveness is the primary criterion for success. I share trading signals daily, and all signals have been accurate without error for a full month. Regardless of your past profits or losses, with my assistance, you have the hope to achieve a breakthrough in your investment.
Gold price is moving sideways on H4 frame, above 3242✍️ NOVA hello everyone, Let's comment on gold price next week from 07/07/2025 - 07/11/2025
⭐️GOLDEN INFORMATION:
Gold prices resumed their upward momentum on Friday and are on track to close the week with gains exceeding 1.50%, supported by a weaker US Dollar amid subdued liquidity following the Independence Day holiday in the United States. A mild uptick in trade tensions also contributed to bullion's strength. At the time of writing, XAU/USD is trading at $3,333, up 0.26%.
President Donald Trump announced that the US would begin sending official letters to trading partners on Friday ahead of the July 9 deadline, outlining new tariff measures ranging between 10% and 70%, set to take effect on August 1. Treasury Secretary Scott Bessent added that a wave of trade agreements is expected before the deadline, estimating that around 100 countries will face a minimum 10% reciprocal tariff. He also hinted at upcoming deal announcements.
⭐️Personal comments NOVA:
Gold price continues to move sideways, accumulating in a large range: 3242 - 3450
🔥 Technically:
Based on the resistance and support areas of the gold price according to the H4 frame, NOVA identifies the important key areas as follows:
Resistance: $3362, $3393, $3446
Support: $3312, $3279, $3241
🔥 NOTE:
Note: Nova wishes traders to manage their capital well
- take the number of lots that match your capital
- Takeprofit equal to 4-6% of capital account
- Stoplose equal to 2-3% of capital account
- The winner is the one who sticks with the market the longest
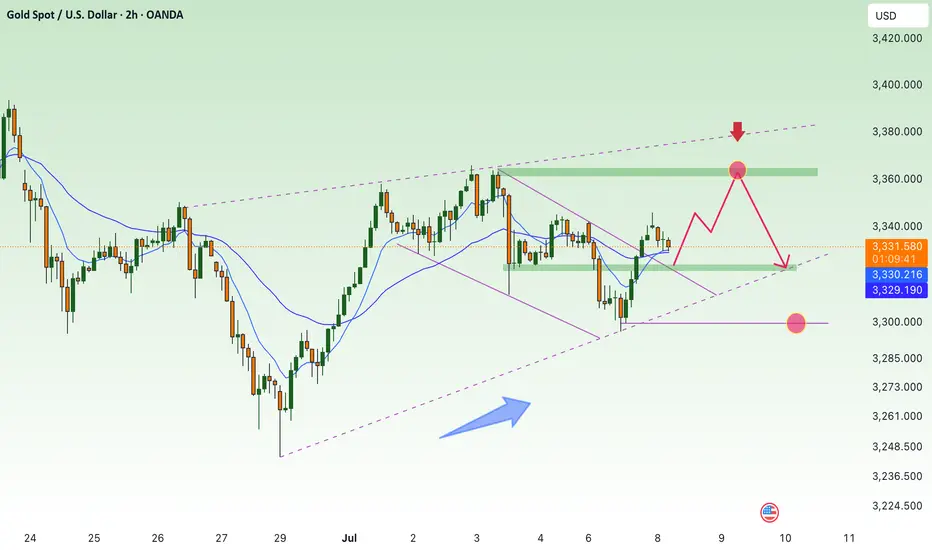
Don’t be too optimistic, gold may change its face at any time!Gold continued to rebound to around 3320, and it seems to have completely stood above 3300. The bulls are recovering. Should we chase gold in a big way? In fact, due to the disruption of news such as the Federal Reserve's interest rate decision and tariffs, the gold market has clearly shown the characteristics of frequent switching between long and short positions and discontinuity between long and short positions. Therefore, even if gold rebounds to a certain extent, it is difficult for the market to stand unilaterally on the bull side.
In the short term, gold began to retreat from around 3366, reaching a minimum of around 3283, with a retracement of $83; and currently it has only rebounded from the low of 3283 to around 3320, and the rebound is even less than 50%. Gold bulls are not as strong as imagined; although gold continues to rebound, before regaining the 3325-3335 area, it can only be regarded as a technical repair of the sharp drop, and cannot be completely regarded as a reversal of the trend. So after the rebound of gold, gold bears may counterattack strongly at any time.
Therefore, in short-term trading, after gold rebounds, you can consider shorting gold with the 3325-3335 area as resistance, and the first entry area worth paying attention to is 3320-3330.
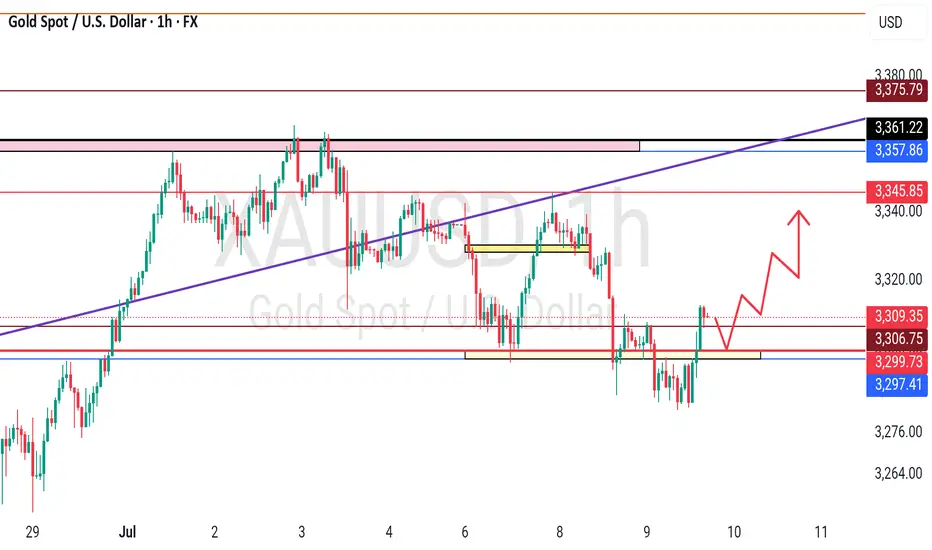
GOLD .. Alternative scenarios, long now??#GOLD.. market perfectly brokenhis today resistance that was at 3296-97
So now if market rholds above and sustains then bounce expected towards 3340 again..
Good luck
Trade wisely
Will gold continue to rise if it accelerates its decline?Technically, we need to focus on the key support of 3260 and the strong resistance range of 3320 above. The hourly chart shows that the short-term moving average diverges downward, and the K-line is under pressure, showing short-term fatigue, suggesting that there is still a need for a correction. The current long-short watershed is at the 3390 mark. If the gold price cannot effectively break through and stand above 3315, the short-term rebound can be regarded as a good opportunity to enter a short position. The 4-hour chart shows that the gold price has received support after touching 3287 and slowly repaired the decline, but it is still in a volatile pattern in the near future. Although the 3287 support is effective, the oscillation range has not been broken. The future direction needs to pay attention to the actual defense strength of the 3260 support level and the direction of the range break. The operation suggestion on Wednesday is to rebound high as the dominant strategy. The upper resistance area focuses on the 3315-3320 range, where short positions can be arranged. The downward targets are 3270 and the key support level 3260. If 3260 is effectively broken, it may open up a larger downward space.
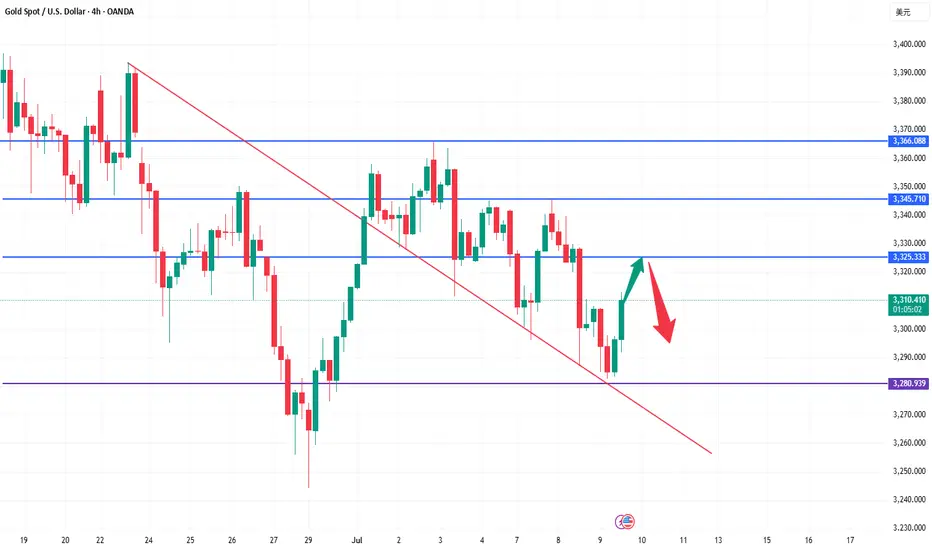
Gold shorts may continue to 3280 or even 3255Gold started to fall from around 3342 in the Asian session, and currently hit a low of around 3305. This is completely consistent with my prediction: "Before gold stabilizes at 3340, it is still in a short trend. Gold shorts may counterattack at any time and look at the target area in turn: 3315-3305." Currently, gold has reached the target area as expected.
There is no doubt that gold is still in an obvious short arrangement at present, and gold shorts may have just begun. For the next short-term trading, we still focus on shorting gold, so what we are most concerned about now is where gold can rebound and where is the most suitable short entry? ! From the current structure of gold, gold is under pressure from the short-term head and shoulders technical structure. This resistance structure compresses the rebound limit in the short term to the 3335-3340 area; and the short-term resistance area is located in the 3320-3330 area; once gold is under pressure and falls again, I think it is very likely that gold will fall to the 3295-3285 area again, and may even extend to the 3365-3355 area.
Therefore, I think shorting gold is still the first choice for short-term trading; you can consider shorting gold in the 3320-3340 area, looking at the target area of 3290-3280-3270
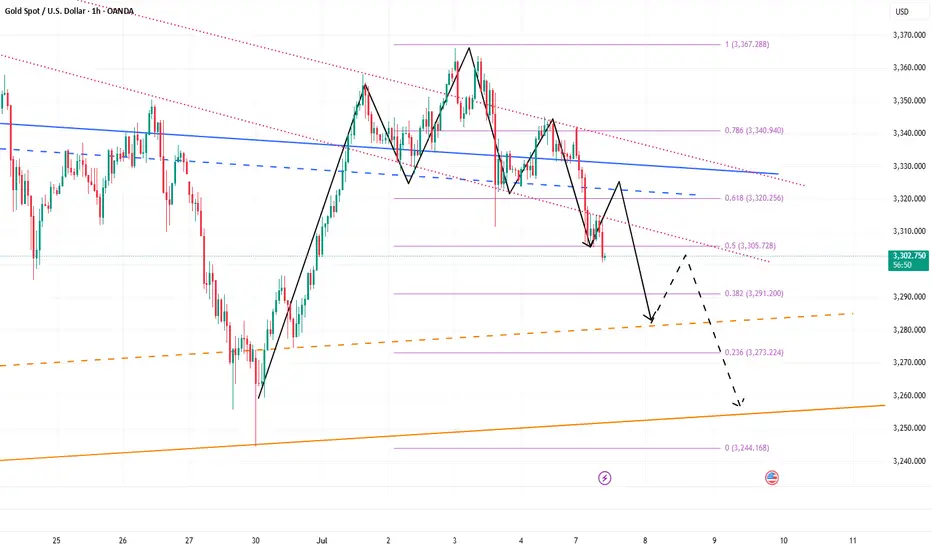
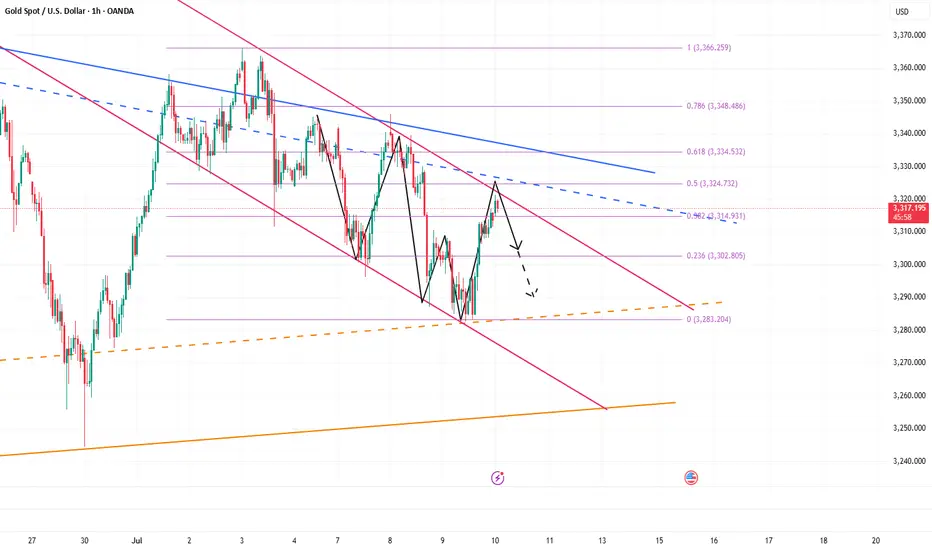
HelenP. I Gold may retest resistance before dropping to $3230Hi folks today I'm prepared for you Gold analytics. If we look at the chart, we can see that after a period of sideways consolidation, gold started to form lower highs under a descending trend line. Each time the price approached this trend line, it was rejected, confirming strong bearish pressure. Most recently, XAUUSD broke below the support-turned-resistance level around 3295, entering the lower resistance zone. Now, the price is trading just under this area, which has acted as a strong supply zone in the past. Given the current technical setup, I expect that gold may show a minor upward move to retest the resistance zone between 3285 - 3295. However, this retest is likely to act as a trigger for sellers to step back in. The prevailing downtrend and repeated failures to break the trend line suggest further weakness ahead. That’s why I’ve placed my target at 3230 points - a level that aligns with the next major support on the chart. This area could provide the next bounce opportunity, but for now, the bearish structure remains dominant. If you like my analytics you may support me with your like/comment ❤️
Disclaimer: As part of ThinkMarkets’ Influencer Program, I am sponsored to share and publish their charts in my analysis.

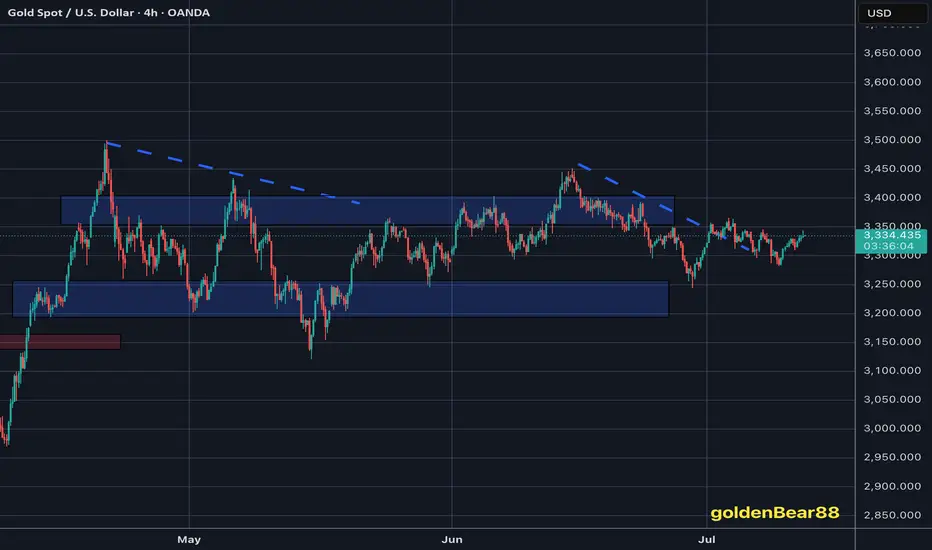
GOLD Long Inside The Range! Buy!
Hello,Traders!
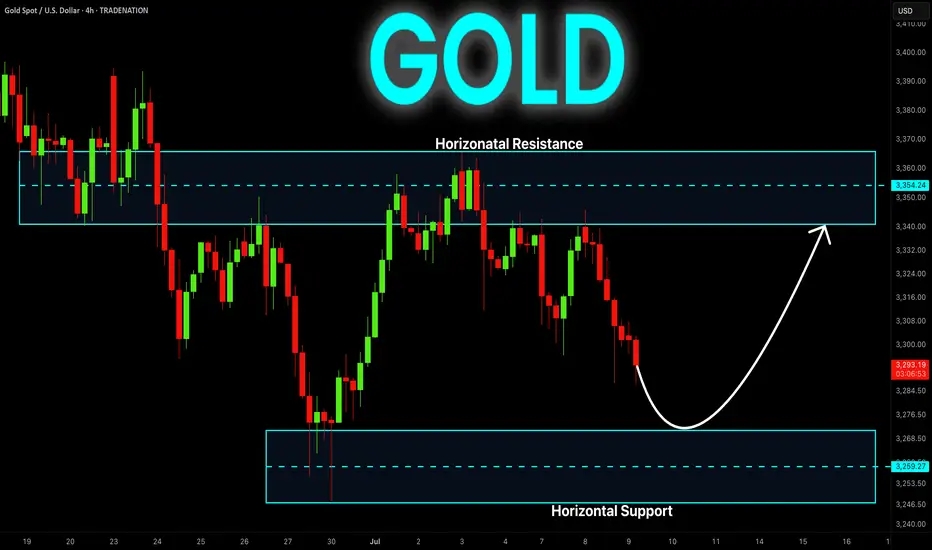
GOLD is stuck in a local
Range while still trading
In a strong long-term uptrend
So we think that this is an
Accumulation before the
Next leg up and as we are
Bullish biased we will be
Expecting a retest and a
Rebound from the horizontal
Support below around 3259$
With the target of retesting
The horizontal resistance
Above around 3354$
Buy!
Comment and subscribe to help us grow!
Check out other forecasts below too!
Disclosure: I am part of Trade Nation's Influencer program and receive a monthly fee for using their TradingView charts in my analysis.
4-Hour Chart Strategy: Sell High, Buy Low Within 3280-3325 RangeBased on the 4-hour analysis 😎, today's short-term resistance above focuses on the hourly top-bottom conversion level around 3318-3324 🚫. If there's an intraday rebound leaning on this zone, first go short to target a pullback ⬇️. The short-term support below is around 3280 🔍. Overall, rely on the 3280-3325 range to maintain the main strategy of "shorting at highs and buying at lows" in cycles ✅. For prices in the middle of the range, always watch more and act less 👀, be cautious of chasing orders 🚫, and wait patiently for key levels to enter positions 🕙
Strategy:
🚀 Buy @3280 - 3285
🚀 TP 3290 - 3295 - 3305
🚀 Sell @3320 - 3315
🚀 TP 3310 - 3305 - 3295
Accurate signals are updated every day 📈 If you encounter any problems during trading, these signals can serve as your reliable guide 🧭 Feel free to refer to them! I sincerely hope they'll be of great help to you 🌟 👇
XAUUSD Analysis todayHello traders, this is a complete multiple timeframe analysis of this pair. We see could find significant trading opportunities as per analysis upon price action confirmation we may take this trade. Smash the like button if you find value in this analysis and drop a comment if you have any questions or let me know which pair to cover in my next analysis.

XAUUSD Analysis todayHello traders, this is a complete multiple timeframe analysis of this pair. We see could find significant trading opportunities as per analysis upon price action confirmation we may take this trade. Smash the like button if you find value in this analysis and drop a comment if you have any questions or let me know which pair to cover in my next analysis.

Sell XAUUSD"Since the price has retraced up to 80% of the previous bearish leg and there's a possibility it will reverse from the trendline, I'm entering a sell position."
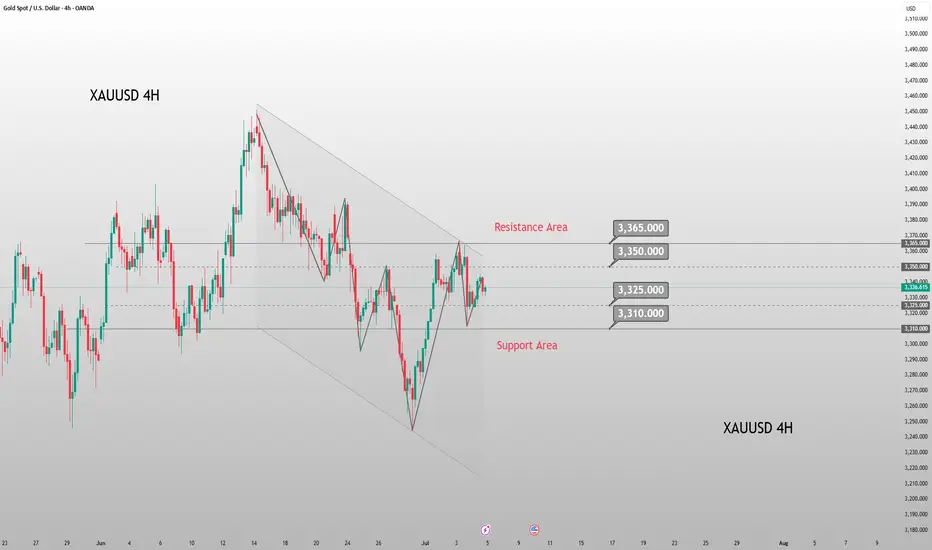
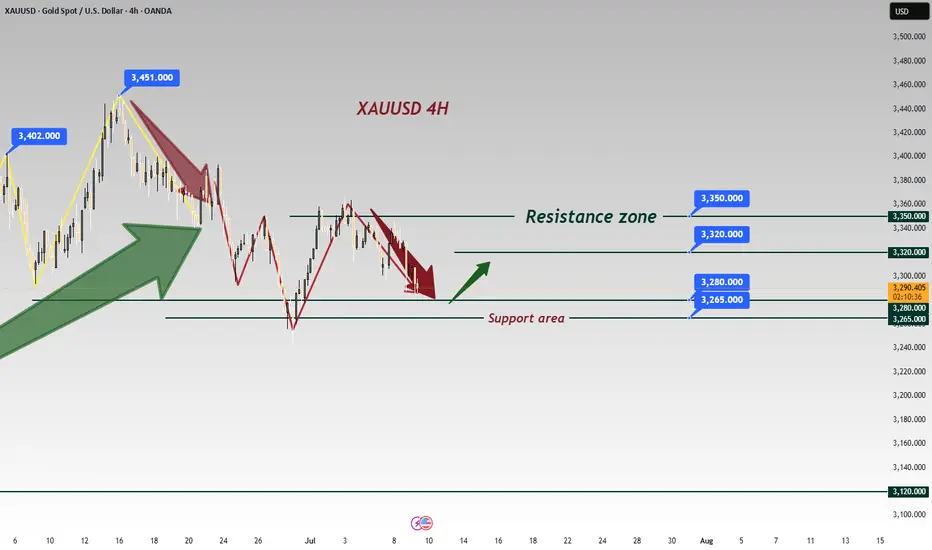
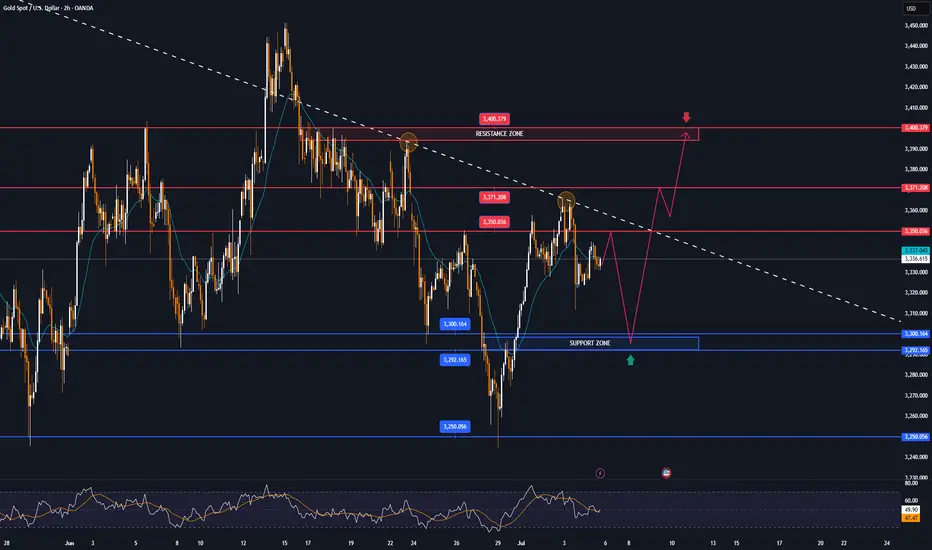
GOLD MARKET ANALYSIS AND COMMENTARY - [Jul 07 - Jul 11]OANDA:XAUUSD opened the week at $3,246/oz due to low summer liquidity, easing recession fears and easing geopolitical tensions. However, they later recovered to $3,365/oz due to concerns about a possible re-escalation of the trade war, as some countries faced obstacles in negotiations with the US ahead of the July 9 tariff delay deadline. By the end of the week, prices had adjusted to $3,311/oz and closed at $3,335/oz.
In addition, the US Senate has passed the OBBBA tax cut and spending bill proposed by President Donald Trump. While it helps prevent the risk of a short-term default, the bill could increase the US public debt by more than $3,000 billion over the next 10 years, putting pressure on the bond market and raising concerns about the increasing supply of government bonds while demand is weakening.
However, US economic data over the weekend put downward pressure on gold. Specifically, the June employment report showed that the number of non-farm jobs (NFP) reached 147,000, exceeding the forecast of 111,000. The unemployment rate fell to 4.1%, lower than the expected 4.3%. At the same time, NFP data for April and May were also adjusted up to 158,000 and 144,000 jobs, respectively.
These positive numbers almost erased the expectation that the FED would cut interest rates in July. The FED also reaffirmed its stance on maintaining the current policy due to rising inflationary pressures.
Overall, gold prices are still stuck in a range, and a clearer prospect of interest rate cuts from the FED is needed to make a strong breakthrough in the near future.
📌Technically, the $3,310/oz level is now acting as an important support zone for gold prices next week. If this level is broken, prices may continue to fall further to the $3,245/oz area or even lower.
On the other hand, the $3,365/oz level is a strong resistance. If gold prices break through this area, there is a high possibility that they will approach the $3,400/oz mark. However, the upward momentum may be restrained afterwards due to profit-taking pressure from investors, especially when the US-China trade negotiations are still ongoing and have not reached a final agreement. Investors tend to be cautious, waiting for clearer signals before opening new positions.
Notable technical levels are listed below.
Support: 3,300 – 3,292 – 3,250USD
Resistance: 3,350 – 3,371 – 3,400USD
SELL XAUUSD PRICE 3401 - 3399⚡️
↠↠ Stop Loss 3405
BUY XAUUSD PRICE 3294 - 3296⚡️
↠↠ Stop Loss 3290
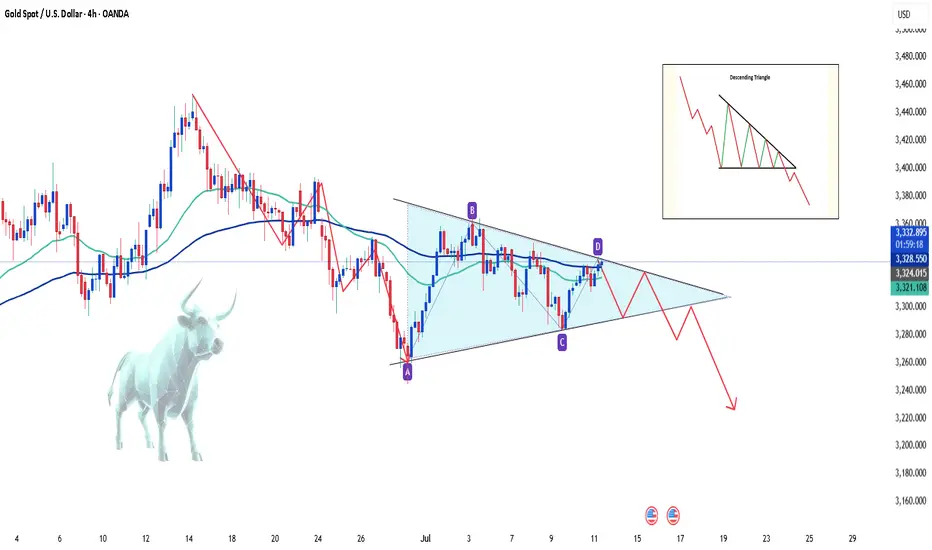
XAUUSD - Sell or Buy ? Hello everyone, great to see you again!
Today, OANDA:XAUUSD remains under notable pressure as the U.S. continues to signal a tougher trade stance. The latest move: the U.S. President announced a 50% import tariff on copper and a potential 200% tariff on pharmaceuticals, following a previous tariff notice ranging from 25% to 40% sent to 14 countries — including Japan, South Korea, Thailand, and Malaysia.
This isn’t just about protectionism. These measures fuel fears of global inflation, supply chain disruptions, and a broader economic slowdown. With surging prices in raw materials and essential goods, consumers may be forced to cut back spending, a classic warning sign for future growth.
In this environment, investors had hoped gold would shine again as a safe haven asset. However, the recent bullish momentum has been underwhelming, signaling ongoing market hesitation.
📉 On the H4 chart, XAUUSD is being squeezed into a descending pattern, which typically carries a high probability of a downside breakout. If the current support fails, the next target could fall below the 32xx area.
On the flip side, if supportive news emerges — such as a hint of rate cuts from the Fed — gold must break above the $3,335 level to revive bullish sentiment.
🔎 What do you think? Will gold break lower — or bounce back? Drop your thoughts below!
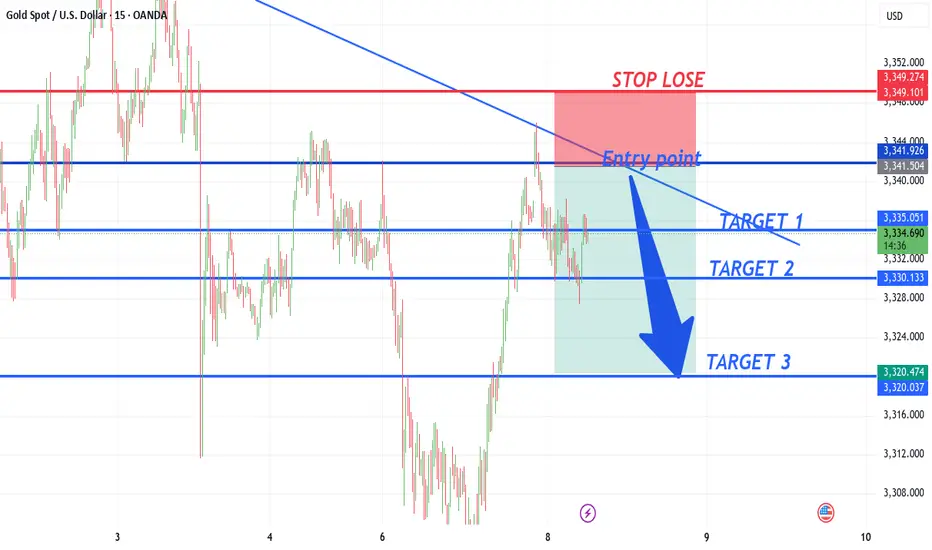
XAUUSD NEW OUTLOOKXAUUSD Sell entry
xauusd sell from 3341
Target1 3335
Target2 3330
Target3 3320
Stop lose 3350
TRADE AT YOUR OWN RISK
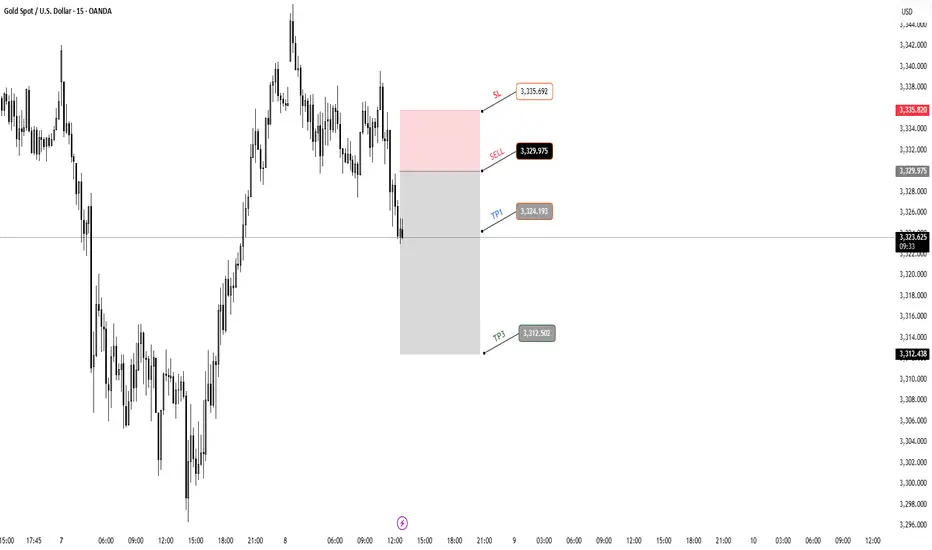
XAULD.1 setupDear all my friends.
this would be my setup for today.
calculate your position size with 583 Point stoploss.
final tp is TP3.
..
..
..
XAULD STRATEGY setup no.1
feel free to ask any question.