Gold shocks and alternating long and short ideas
💡Message Strategy
As we mentioned before, the upper 3345-50 is the suppression position after the non-agricultural data last week. We can short at the 45-50 line when it rebounds. Yesterday, we also gave the idea of going long at the 3295-3301 line. At midnight, gold rebounded perfectly above the 3330 line and closed at the 3336 line.
Today we continue to pay attention to the short-term suppression of the 3345-50 line. If the rebound does not break, we will intervene in the short order. After all, the technical side needs to be adjusted and repaired during the day. We try to grasp the good entry position for operation. If your current gold operation is not ideal, welcome to communicate!
📊Technical aspects
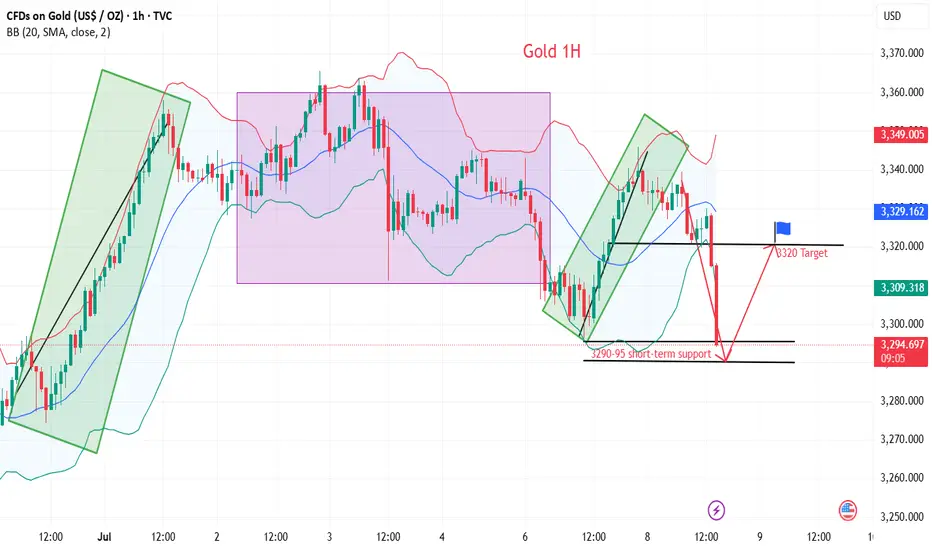
From the 1-hour analysis, the short-term support of 3290-3295 is concerned below, the short-term resistance above is concerned about the 3345-50 line, and the suppression of 3365-70 is focused on. The overall main tone of high-altitude low-multiple cycle participation remains unchanged. In the middle position, watch more and do less, and follow orders cautiously, and maintain the main tone of participation in the trend. Wait patiently for key points to participate. Pay attention to the specific operation strategy in time.
💰Strategy Package
Long Position:3290-3300,SL:3275,Target: 3320-3340
XAUUSDG trade ideas
Repeated cycle, timing is keyMarket fluctuations are oscillating about 70% of the time, and only about 30% of the time are unilateral upward or downward, so accumulating small victories into big victories is the magic weapon for long-term success. What we need to do is to plan our positions well, and make this investment with a plan, direction, and guidance. A good trader will make your investment journey smoother. How to operate in a volatile market? The ancients said: Do not do good things because they are small, and do not do evil things because they are small. If we move it to financial management, it can be understood as: Don't be too greedy, enter the market in batches. When entering the market and covering positions, the position should be small. Although the profit is less, accumulating small victories into big victories is the key to success. The investment philosophy is composed of the investor's psychology, philosophy, motivation, and technical level. It mainly includes: stability, patience, independent thinking, discipline, trend, etc.
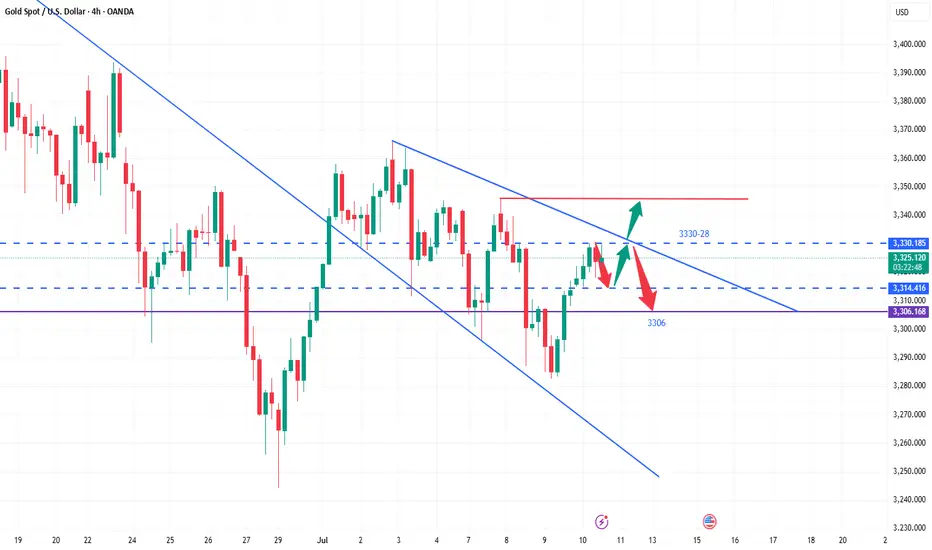
Judging from the current trend of gold, in the 4H cycle, it has touched 3330 many times under pressure, and the K-line has continuously closed with upper shadows, which is quite similar to yesterday's rhythm. So we must first look at the strength of the decline. The support below is at 3314 and 3306. In terms of operation, it should be treated as mainly long and auxiliary short. The upper pressure still focuses on the gains and losses of 3330.
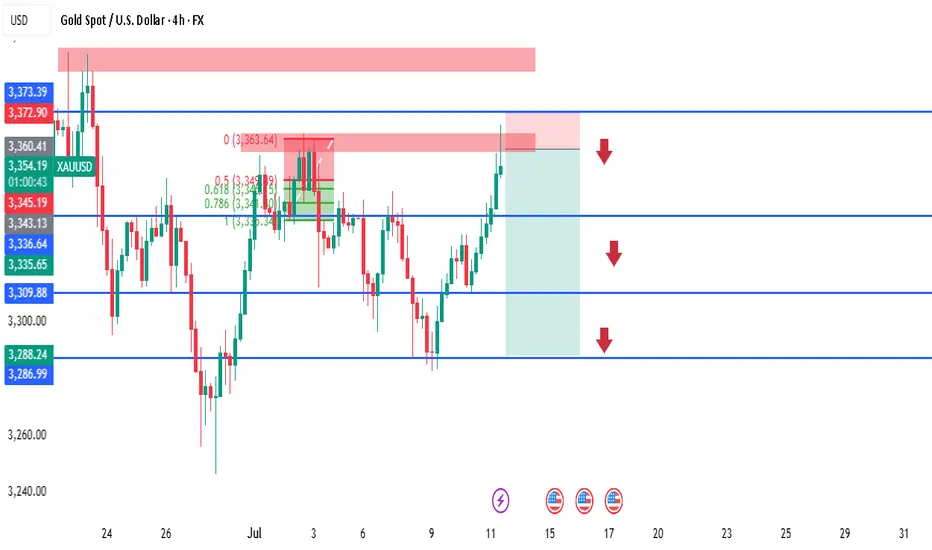
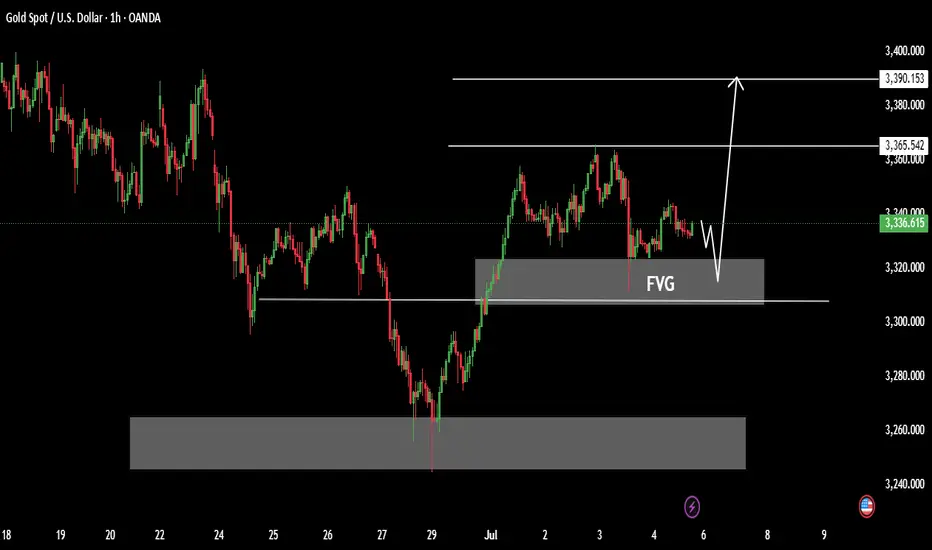
XAUUSD 4H SMC Analysis – Sell Opportunity Near Supply Zone Price is currently tapping into a 4H supply zone around 3353–3360, a strong area of previous sell-off and imbalance. We're expecting a potential reaction and rejection from this area, aligning with the following SMC confluences:
🔻 SMC Confluences:
Price swept short-term liquidity above previous highs (liquidity grab).
Price now tapping into a mitigation zone within premium pricing.
Bearish order block aligned around 3360.
FVG (Fair Value Gap) filled between 3345–3360.
Fibonacci 0.5–0.618 zone respected.
🎯 Sell Setup:
Entry: 3355–3360 (Confirmed reaction)
SL: Above 3373 zone (liquidity sweep buffer)
TP1: 3343 (short-term structure)
TP2: 3309 (previous support)
TP3: 3288 (strong 4H demand)
📌 Watch for M15–H1 bearish CHoCH (Change of Character) or BOS (Break of Structure) as confirmation before entry.
(probably) sell!Hi all. as you see my last idea on Gold was failed but I think market needs a new Lower Low. I wanna try this critical Top as a second option. Let see what happened.(wink)
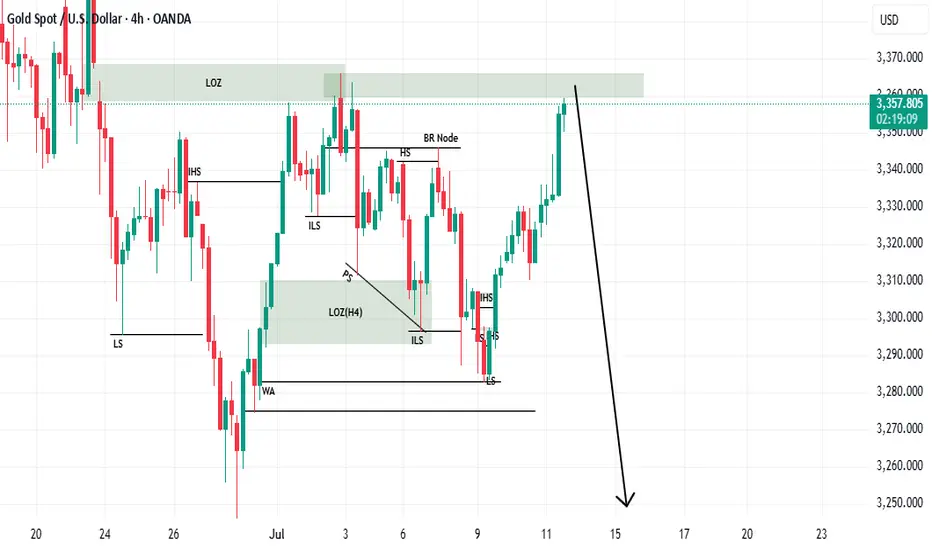
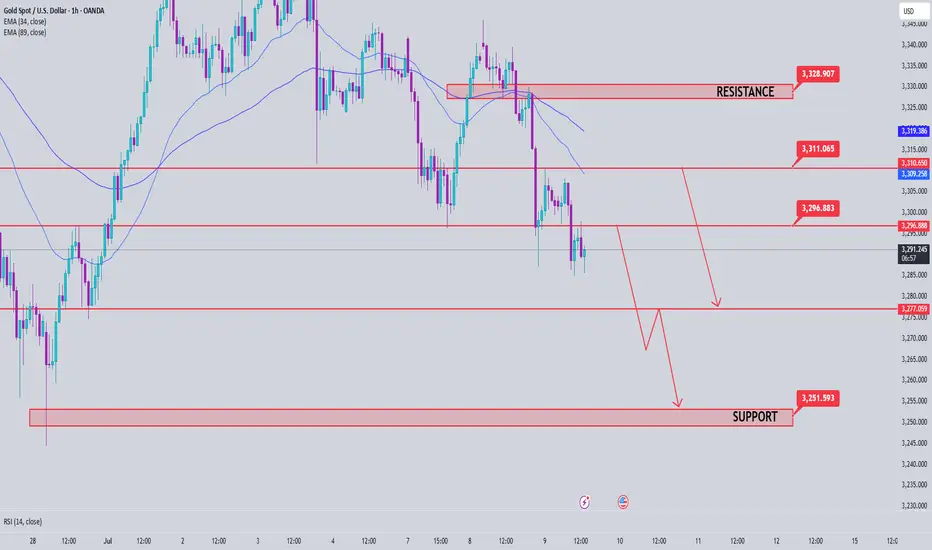
Gold Price Analysis July 9GOLD XAU/USD ANALYSIS – CONFIRMING THE CONTINUATION OF THE BEARISH WAVE
Yesterday's D1 candle confirmed the downward momentum of gold when the selling pressure returned strongly below the liquidity candle wick. This shows that the selling pressure is still dominant and the downward momentum is likely to continue in today's session.
🔹 IMPORTANT RESISTANCE ZONE: 3297
The 3297 zone – which was a strong support in yesterday's session – has now turned into a resistance zone. This is a potential SELL zone for the day, especially if there is a confirmation signal from the sellers at this price zone.
🔹 CONFUSION RESISTANCE ZONE: 3310
The 3310 area is the confluence between the downtrend line and the resistance zone of the US session – which needs special attention in the SELL strategy. If the price approaches this zone, expect a reaction from the selling side to return.
🎯 SUGGESTED STRATEGY:
SELL when price does not break through 3297 (confirm selling pressure at resistance)
SELL DCA if price breaks down to 3276
Target: 3250
BUY only considered if price holds 3276 and has a bullish reaction
📌 Key Levels:
Support: 3277 – 3250
Resistance: 3297 – 3310 – 3328
Important reaction zone: 3377 (if price rebounds)
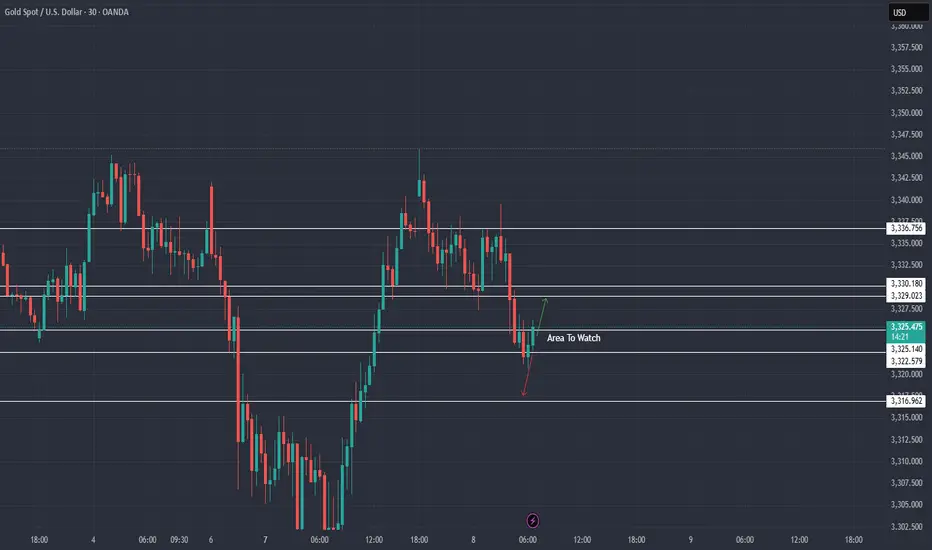
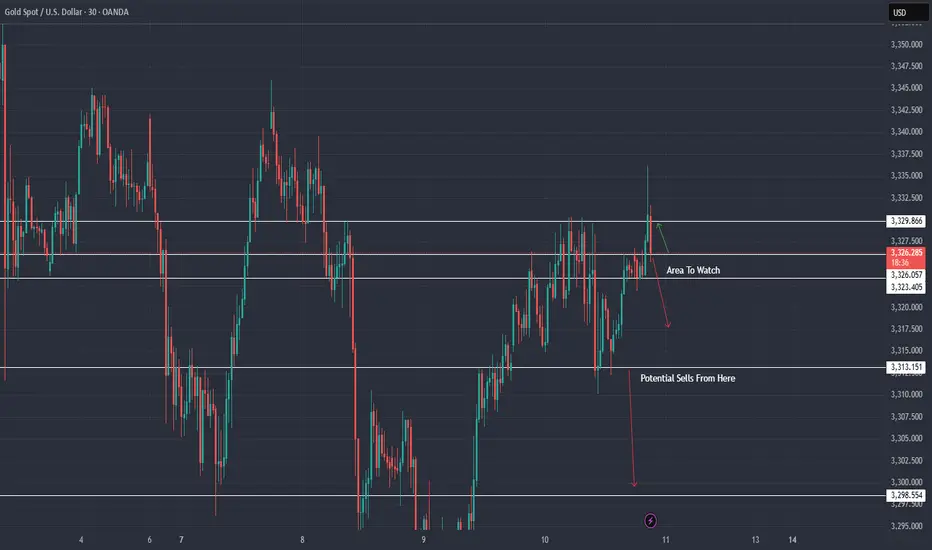
XAU / USD 30 Minute ChartHello traders. On the lower time frame 30 min, chart I have marked my current area of interest for scalp buy / sell trades. This is not me saying you should take a trade. We have Pre NY volume starting to come in 40 minutes from now ( 7:20am est), here in the US. So let's see how the current 30 min. 1 hour and 4 hour start lining up between now and the NY session. Big G gets a shout out. Be well and trade the trend.
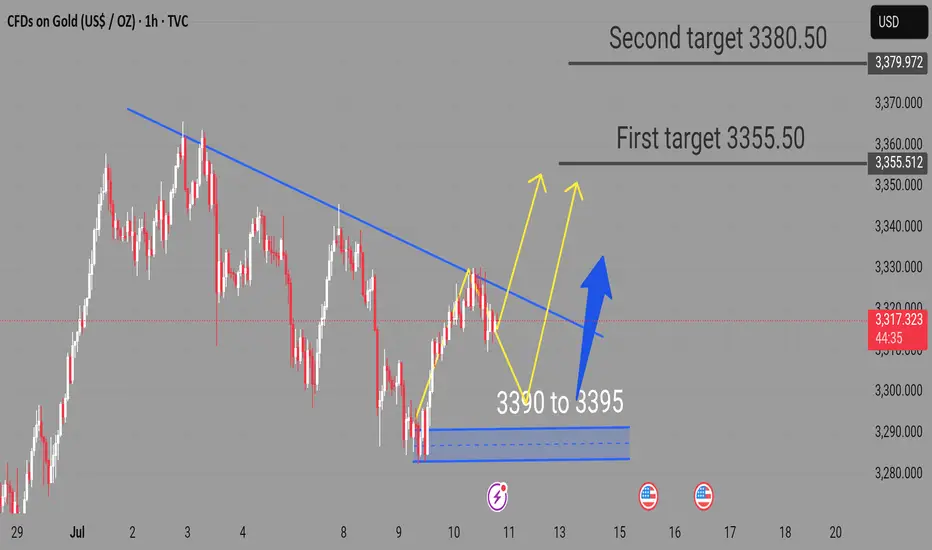
XAUUSD Expecting bullish Movement Gold is showing potential for a bullish reversal from the key support zone between 3390 to 3395. Price has formed a base in this range, and if it holds, we may see an upside breakout above the descending trendline
Buy Zone: 3390 – 3395
First Target: 3355.50
Second Target: 3380.50
A successful breakout and hold above the trendline resistance could trigger a move toward our short-term targets. Watch for bullish confirmation before entering. Manage risk accordingly
7.9 Gold long and short switches frequently!From the daily chart, the overall gold price is still in a weak position, the moving average is hooked, and the upper pressure is near the moving average 3319. Only if it breaks through and stands firm at this position during the day, can the bulls start to exert their strength. It happens that the MA10 position of H4 is also near 3319. At present, H4 is in a bearish trend, so the bullish pressure is still very large, but it rose in the early morning, and it bottomed out and rebounded. Combined with the recent non-continuation of the long and short trends, there is a high probability of rebounding during the day, so we can go long in the Asian session first, and go long directly at the current price of 3300, add positions to 3295, defend 3286, and look at 3312-19. The focus is still on the strength of the European session. If the European session is strong, continue to go long before the US session retreats; if the European session is weak, the US session will bottom out and rebound!
Tide turned in Sellers favorAs discussed throughout my yesterday's session commentary: "My position: I will keep Buying and Selling Gold only with my aggressive Scalp orders from my key entry and reversal points."
Firstly I have engaged multiple re-Buy orders on #3,320.890 towards #3,327.80 (Scalp of course) delivering decent Profit however when #3,322.80 got invalidated, personally I wasn't trusting the decline and re-Bought aggressively #3,312.80, #3,305.80 and #3,294.80. I did that successfully / in & out delivering excellent Profit however I would made much more if I Shorted Gold personally.
Technical analysis: The strong pullback shy of making a #3,282.80 local Low’s is a Natural Short-term correction. Yesterday's candle sequence can be identified as Three Black Crows formation but even then Daily chart remained Bullish currently as long as #3,277.80 - #3,288.80 Support zone is intact. Level mentioned represents key Support zone and it is no coincidence that the Price-action rebounded there. Hourly 4 chart is now Bearish again so I expect Bearish continuation on Gold (Sell every High's) unless Gold closes the session above #3,300.80 mark. Few Bearish important marks were hit earlier than I expected (had this for the end of the week personally) so now if / when #3,288.80 gets invalidated, I am expecting the final extension wave of this parabolic run towards #3,252.80 benchmark. I believe this will be a major Support, but shouldn't necessarily cause intense pull-back but a new Monthly accumulation period.
My position: I will Sell every High's on Gold, and pursue #3,252.80 benchmark with my both Scalp and Swing orders. I am well known Seller of Gold.
GOLD GOLD ,the price of gold rose from a strong demand floor yesterday at 3296 to 3343 and corrected into 3326.6 today
if the correction into 3326.6 is upheld ,buyers could push into 3360-3357 if they can break 3343 supply roof .
my aim is 3423-3430 zone on long confirmation.
trading is 100% probability.
#gold

GOLD GOLD ,my perspective came back 100% complete on buy and sell. After watching 3342-3338 trigger, the dollar index (dxy) renewed impulse on tariff offensive from U.S and warning to other gang of BRICS nation who will try to undermine the global dominance of dollar .
the US10Y AND DXY GOING TO THE MOON.
if we get a correction into 3318-3316 , i will will look for buy structure on 15min POE.
#GOLD #DXY #US10Y
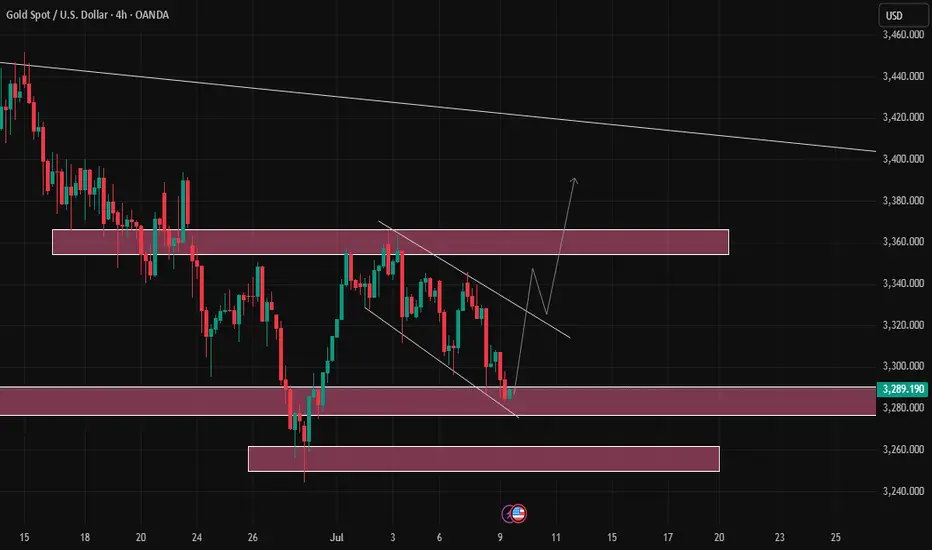
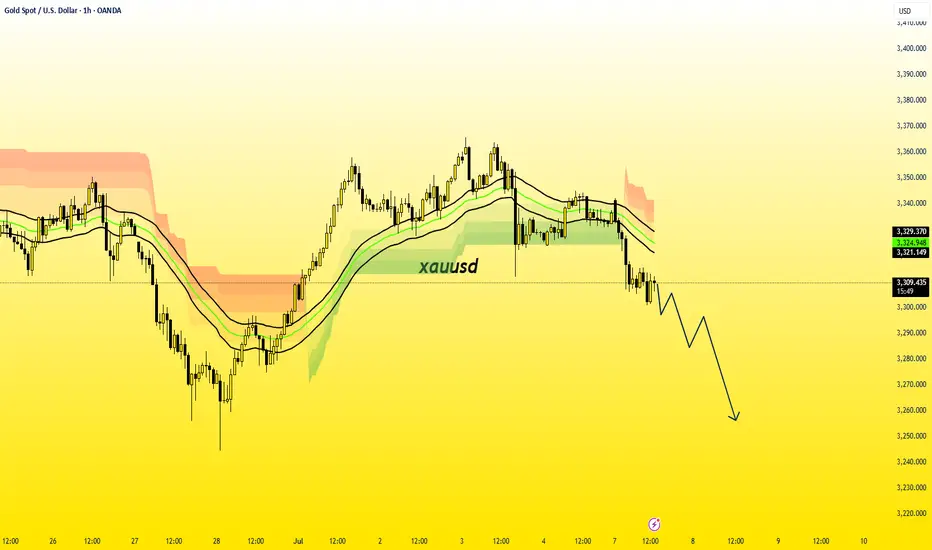
Gold on a decline as expectedTechnical analysis: As expected last week has started off inside my Neutral Rectangle and despite the pullback from the Daily High’s, the (#1W) Weekly chart’s candle was finishing the week at (# +1.79%). As mentioned throughout the week, the last time we had two straight green (#1W), third will follow so expect Bull week (this one) if cycle is replicated. The current pullback on Hourly 4 chart (Engulfing Bearish candlestick formation) has formed an healthy post NFP Descending Channel which is currently on it’s Higher Low’s so the rebound can happen any time. Technically #3,345.80 - #3,348.80 represents the next Lower High’s Lower zone pressure point and that’s why you witnessed many upside rejections there (Gold stalled on mentioned configuration) so Short-term Buyers can Target this level. Remember, #MA50 on Daily chart is line of utmost importance (currently seen Trading at #3,322.80). Price-action still didn’t invalidated the #3,322.80 (with a market closing) Hourly 4 chart’s Support as Gold is picking up the pace towards my expected #3,348.80 - #3,357.80 Resistance zone for the fractal / local High’s.
My position: In my opinion I need to stay on Hourly 4 time-frame for us and the potential break-out to the downside since Hourly 4 chart remains Bearish (never Swing Buy while #H4 is Bearish) on logarithmic scale, hence on limited upside. My expectation is that we still have one (minor) rebound left which will be the final Selling attempt / entry towards #3,300.80 benchmark, if Buyers manage to reverse this, #3,352.80 and #3,400.80 marks are Targets to monitor / which I will pursue with set of Scalp and Swing orders. Trade accordingly as I Bought #3,302.80 with set of aggressive Scalp orders.
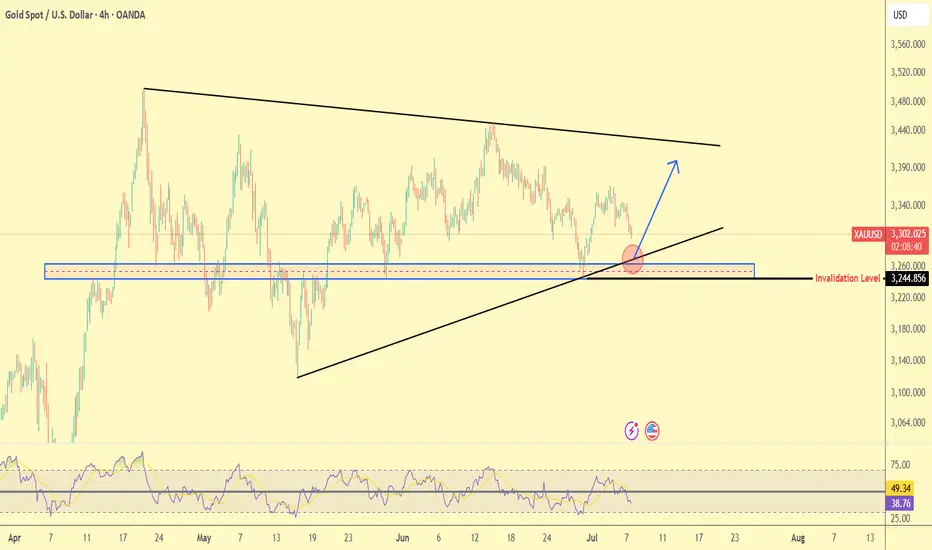
Gold Trade plan 07/07/2025Dear Trader,
✅ Symbol: Gold vs. US Dollar (XAUUSD)
✅ Timeframe: 4H
✅ Date: July 7, 2025
✅ Technical Overview:
🔹 Price is forming a Symmetrical Triangle pattern.
🔹 A key support zone lies between $3245–3260, marked by the blue area.
🔹 Price has bounced from this zone and the ascending trendline (black), as shown by the red circle.
🔹 Main scenario: A potential bullish bounce toward the upper triangle resistance or even breakout (blue arrow).
🔻 Invalidation Level: $3,244.85
If this level breaks to the downside, the bullish setup will be invalidated, with possible targets at $3200 and $3100.
📉 RSI is currently between 38 and 49, not oversold yet, but near dynamic support.
✍️ Conclusion:
Holding above the current support area could trigger an upward move.
A break below $3245 would likely lead to further downside.
The current price area offers a favorable risk-reward for bullish positions.
Regards,
Alireza!
Gold Setup for longs and shorts This video covers gold on the local range whereby I expect price to eventually complete the move to the downside and clear the equal lows from MAy and June as well as take care of the poor lows and fill Quart Pivots .
I talk also about the Tradingview session volume profile chart and how this feature can really be a simple yet powerful guide for taking scalp trades off of specific levels and I show a couple of examples of the respect PA has for hitting those daily POC .
I Welcome any questions you may have

XAUUSD Gold Weekly solid Bullish zone Gold weekly Forecast lets see how the price will plays out open and see and send your feedback about Gold.
After the breaking Price could catch there support after pull back top but last week on Friday due to the low volume price could not move Highly Gold stabilized after correction after the falling weekly from 3366 Gold price found demand again in Asia on Friday but US Budgets risk due to the holiday could increase,
Technically Price range in last week 3357 to 311 there is important level and Bullish zone,
Resistance zone 3365 / 3390
Support Levels 3325 /. 3311
it is important situation for you traders to use trade long-term hope you can find more details in the chart POs Support with like and comments for more analysis.
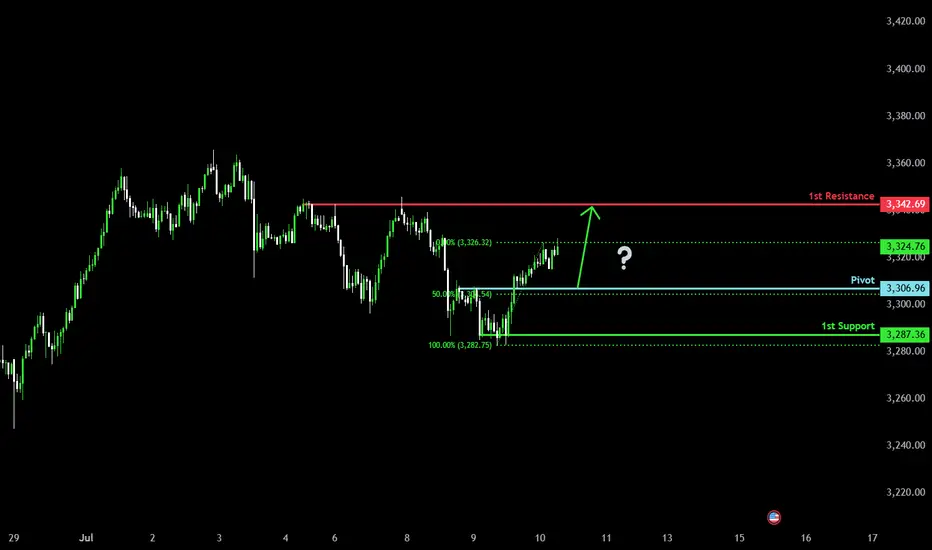
Falling towards 50% Fibonacci supprt?The Gold (XAU/USD) is falling towards the pivot and could bounce to the 1st resistance which is a pullback resistance.
Pivot: 3,306.96
1st Support: 3,287.36
1st Resistance: 3,342.69
Risk Warning:
Trading Forex and CFDs carries a high level of risk to your capital and you should only trade with money you can afford to lose. Trading Forex and CFDs may not be suitable for all investors, so please ensure that you fully understand the risks involved and seek independent advice if necessary.
Disclaimer:
The above opinions given constitute general market commentary, and do not constitute the opinion or advice of IC Markets or any form of personal or investment advice.
Any opinions, news, research, analyses, prices, other information, or links to third-party sites contained on this website are provided on an "as-is" basis, are intended only to be informative, is not an advice nor a recommendation, nor research, or a record of our trading prices, or an offer of, or solicitation for a transaction in any financial instrument and thus should not be treated as such. The information provided does not involve any specific investment objectives, financial situation and needs of any specific person who may receive it. Please be aware, that past performance is not a reliable indicator of future performance and/or results. Past Performance or Forward-looking scenarios based upon the reasonable beliefs of the third-party provider are not a guarantee of future performance. Actual results may differ materially from those anticipated in forward-looking or past performance statements. IC Markets makes no representation or warranty and assumes no liability as to the accuracy or completeness of the information provided, nor any loss arising from any investment based on a recommendation, forecast or any information supplied by any third-party.
Sell XAUUSD XAUUSD is slowly establishing a downtrend while everyone buys. I advice sells here from 3340 towards 3280. This trade should have a very tight stop loss at 3346 because should it break above, it could rally
XAU / USD 30 Minute ChartHello traders. My last chart for the day / night. I have marked my potential area of interest for scalp buy / sell trade set ups. I am just waiting until tomorrow to see how the overnight sessions play out. Big G gets a shout out. Be well and trade the trend. Dont' get caught range trading, wait for a break and retest. Thank you so much if you enjoy the posts / analysis'.
Short-term gold bulls and bears are anxious,3330 becomes the keyAt present, the market has been fluctuating narrowly in the range of 3330-3320, and both bulls and bears are in a stalemate. However, gold has formed a double-layer head and shoulders bottom pattern, so the short-term bullish trend is definitely unchanged. In the previous post, I also mentioned that if the rebound in the European session is weak and gold continues to be below 3345, then the short-term NY session may usher in a retracement and a second bottom. Therefore, I still hold a long order of 3325-3315, and temporarily modify the TP to the 3335 line. I expect that there may be a retracement here, but there may also be a direct retracement. No matter what the situation is, we need to stabilize before entering the market.
In addition to investment, life also includes poetry, distant places, and Allen. Facing the market is actually facing yourself, correcting your shortcomings, facing your mistakes, and exercising strict self-discipline. I share free trading strategies and analysis ideas every day for reference by brothers. I hope my analysis can help you.
PEPPERSTONE:XAUUSD FOREXCOM:XAUUSD FX:XAUUSD FXOPEN:XAUUSD OANDA:XAUUSD TVC:GOLD
Gold Long: the video explanationHere I discussed how I came out with the completion of the correction for Gold and explain why it may be a good idea to set the stop loss slightly lower.

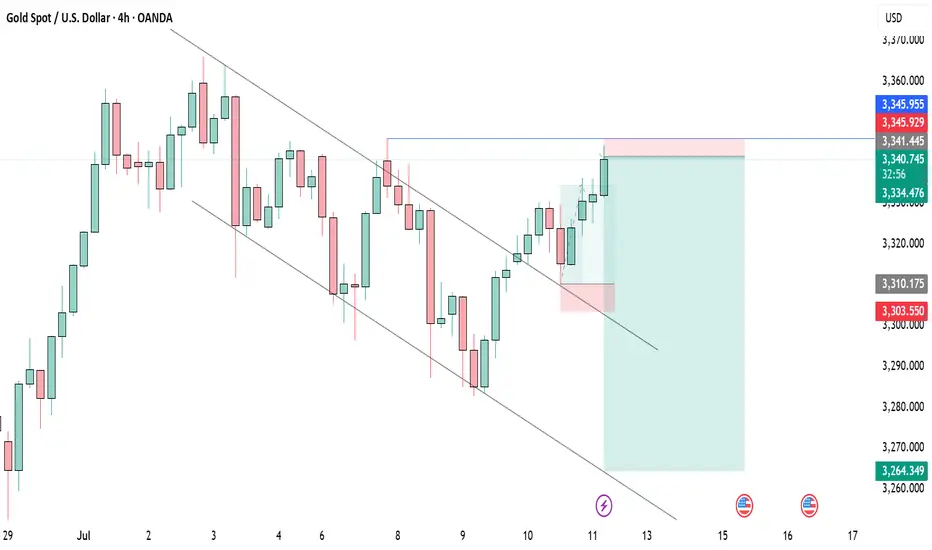
XAUUSD – Fresh Bearish Setup After TP HitWelcome to Velatrix Capital.
Last week’s short position on Gold has just hit Take Profit.
Based on current structure and momentum, we remain bearish-biased and have already entered a fresh short trade from a key resistance level.
This setup aligns with our internal system’s confluence logic and is now active.
🔍 Trade Parameters
• Timeframe: 1H
• Direction: Sell
• Entry: 3310.11
• Take Profit: 3266.76
• Stop Loss: 3324.51
• Risk/Reward: 1:3
Note: This is not financial advice. This is a real trade taken by our team based on a structured, repeatable trading model.
Use it as insight. Not as instruction.
🔔 Follow Us
We don’t chase hype.
We build edge.
Follow for raw setups, structured strategies, and institutional-grade breakdowns.
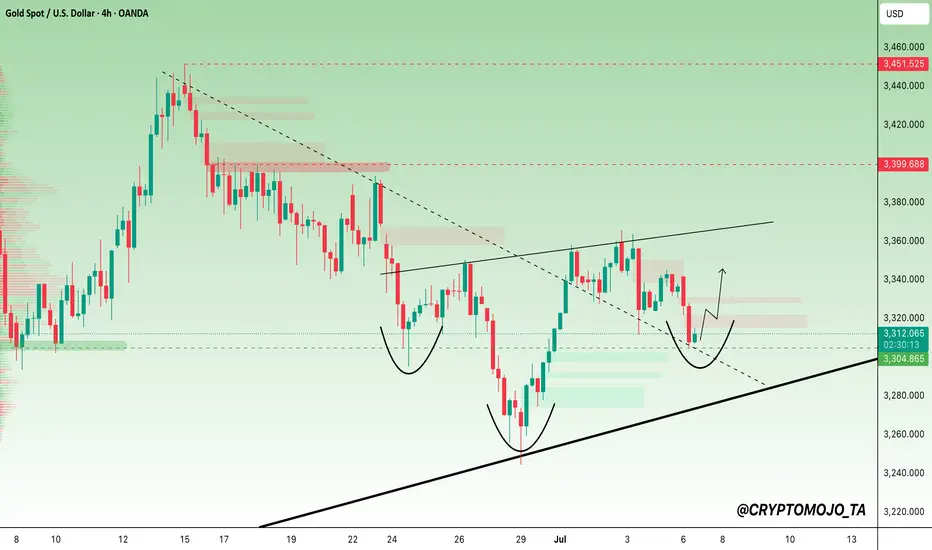
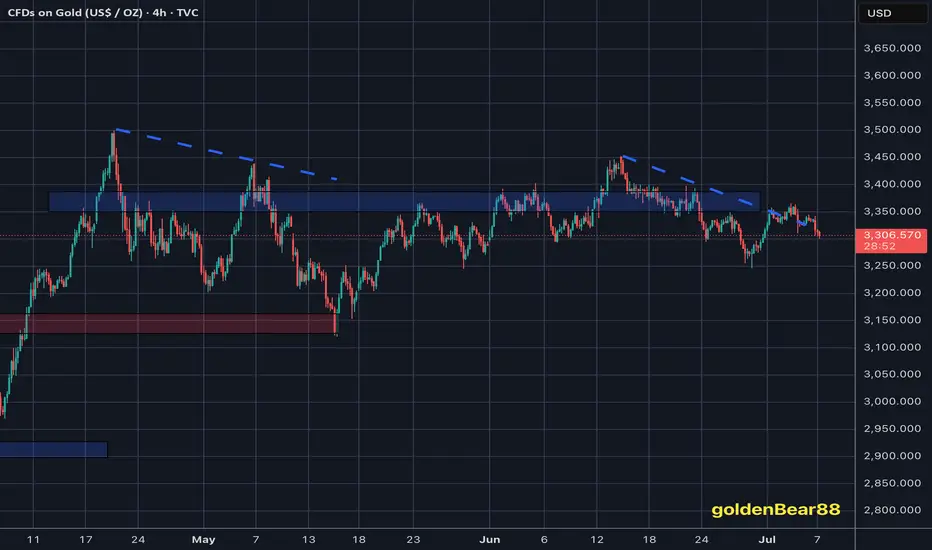
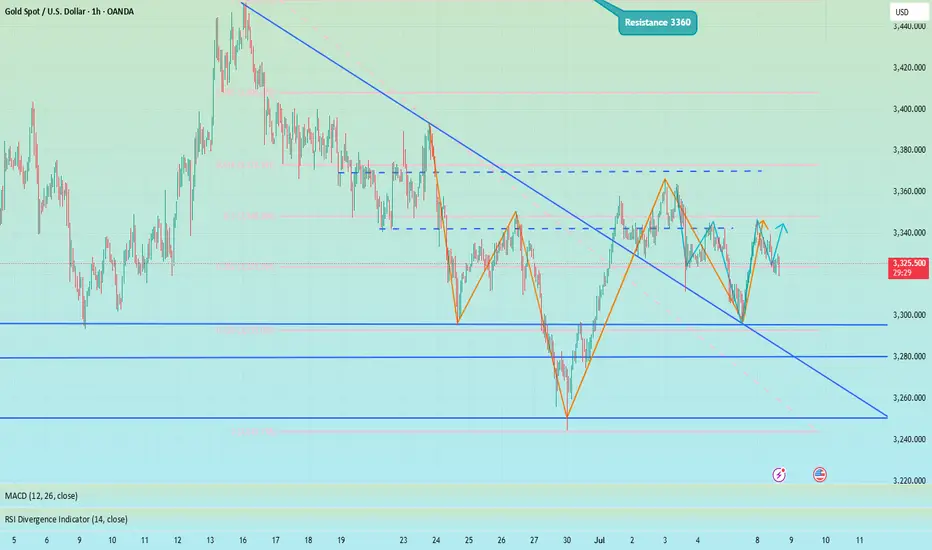
GOLD Eyes Breakout: Inverse Head & Shoulders in PlayGOLD is showing signs of a major bullish reversal!
The chart is clearly forming an inverse head and shoulders pattern, which often marks the end of a downtrend and the start of a new move up.
Buyers stepped in strong around the $3,305 zone multiple times, defending key lows and building a solid base. Now, the right shoulder is taking shape, and a break above $3,350–$3,357 could trigger the breakout.
📌 Key Resistance: $3,350 / $3,357 / $3,399
📌 Support: $3,304 (critical trendline)
If price flips $3,357 into support, bulls could target $3,399 and eventually $3,448 in the next leg.
The structure looks clean, with all eyes on the neckline breakout.
DYOR, NFA