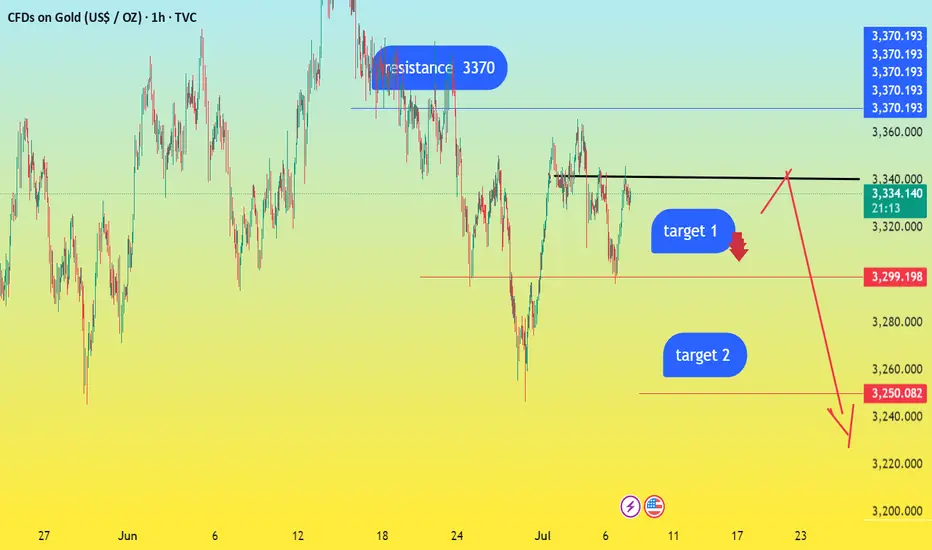
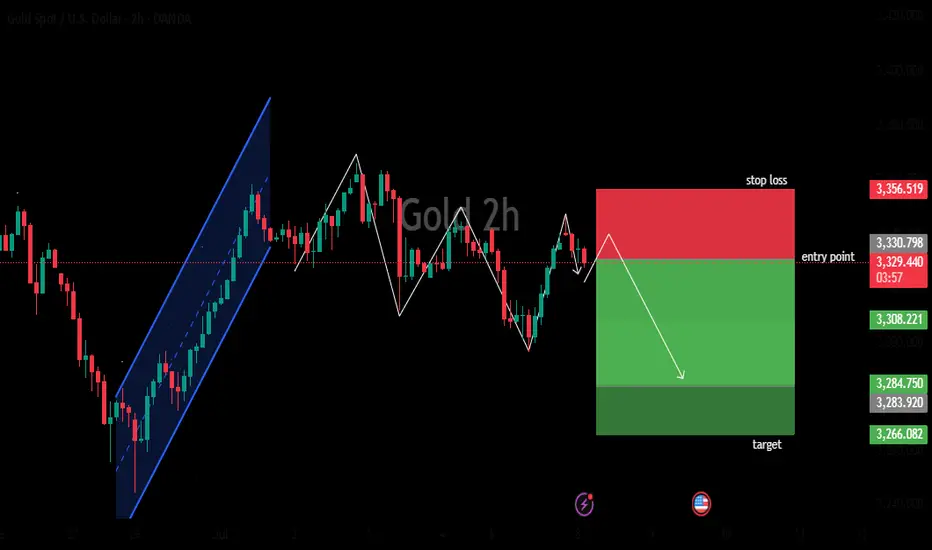
IS XAUUSD SET FOR MASSIVE SELL THIS WEEK ?the recent decision of Trump administration to cut taxes coupled with the officially implementation of spending bill will encourage short term treasury bonds sell to make up for the trillions of the dollars in the fiscal deficit in the future, causing massive dollar boost which will eventuate in gold sell.
TARGET 1 ( 3200)
TARGET 2 ( 3250)
resistance (3370)
pivot point ( 3
XAUUSDG trade ideas
XAUUSD:Sharing of the Latest Trading StrategyAll the trading signals this week have resulted in profits!!! Check it!!!👉👉👉
Gold Market Analysis:
Overnight Dynamics: Following Trump’s reinstatement of tariffs, gold’s safe-haven demand drove another rally, but it still pulled back after facing pressure at the 3345 level. The decline extended today, requiring attention to the sustainability of safe-haven flows—recently, safe-haven-driven rallies have often been followed by pullbacks, so caution remains warranted for further gold corrections.
Technical Trends:
On the daily chart, gold continues to trade in a narrow range, with short-term moving averages essentially converging and flattening, suggesting a high probability of continued sideways movement in the near term.
The current range is temporarily compressed between 3285–3345, with the market bias leaning toward a "range-bound bearish" trend.
Trading Bias: Maintain a bearish stance on rebounds!
Trading Strategy:
Sell@3330-3320
TP:3300-3280
Gold Market Eyes 3326 Mitigation Ahead of London OpenGold market looks set to pull back toward the 3326 zone during the Asian session close, aiming to mitigate prior imbalances. A clearer sentiment is anticipated as the market transitions into the London open, which may define the next directional push. follow for more insights , comment for more opinions , and do well to boost idea if you find this helpful
BuyTrade
Manage
Smile
Internet down time. I'd make video later
Remember you're in charge of your decision
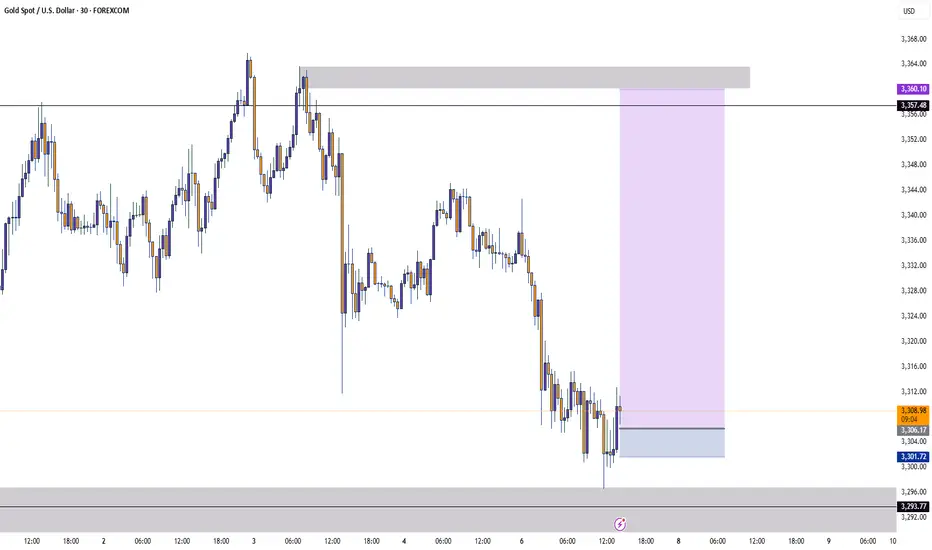
GOLD GOLD ,London session is giving a 30min buy signal from London gold market in 3309-3304 zone .
if they hold that zone it will be 3321 -3325 target.
and i see sell from that zone which will sweep into the descending trendline and activate a lower level buy at 3288-3295 zone .
trading is logical probability's ,pls stay cautious at all time. Any key level can fail because you dont have the money to move market.
#gold

SellsAfter yesterdays buys today we on the upper bound and on the major trend sells. We look to target 3277 -3285
NB: This is if the upper bound resistance ain't broken. Trade cautiously
GOLD GOLD ,AM WATCHING 3314-3312 for buy ,the 1hr rejection will be watched , the US10Y will be watched, DXY will be watched .
the three will give a trade reason ,RBA played us by keeping OFFICIAL CASH RATE THE SAME 3.86% instead of the forecast of 3.6%.
AUD AND GOLD have something in common .
trading is 100% probability, apply risk management, no amount of grammar will stop liquidity sweep against a careless trader.
protect your capital.

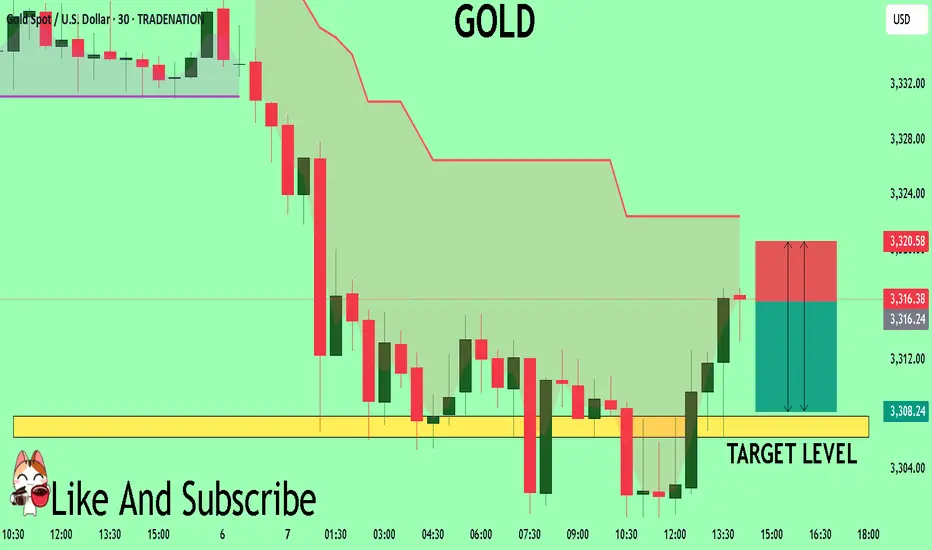
GOLD The Target Is DOWN! SELL!
My dear friends,
Please, find my technical outlook for GOLD below:
The price is coiling around a solid key level - 3316.4
Bias - Bearish
Technical Indicators: Pivot Points Low anticipates a potential price reversal.
Super trend shows a clear sell, giving a perfect indicators' convergence.
Goal - 3307.9
Safe Stop Loss - 3320.5
About Used Indicators:
The pivot point itself is simply the average of the high, low and closing prices from the previous trading day.
Disclosure: I am part of Trade Nation's Influencer program and receive a monthly fee for using their TradingView charts in my analysis.
———————————
WISH YOU ALL LUCK
/////////////////////////
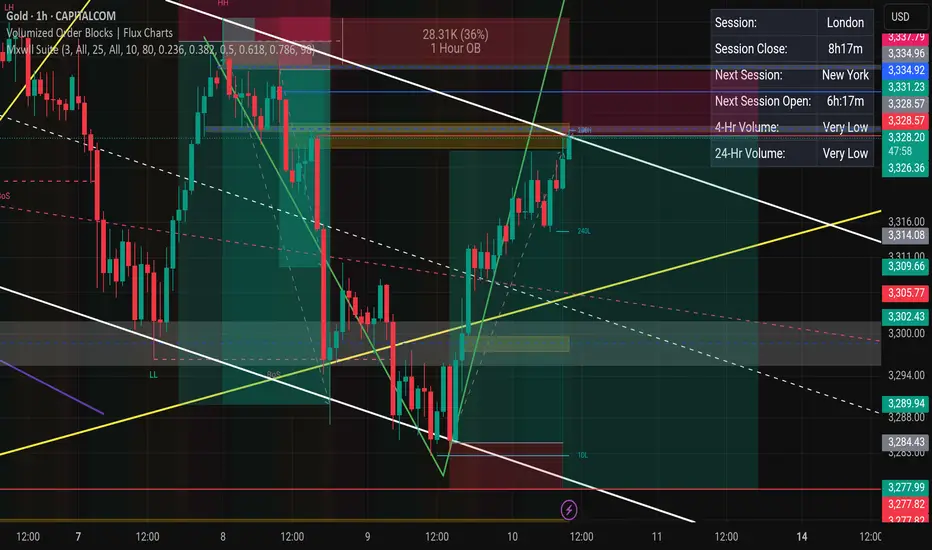
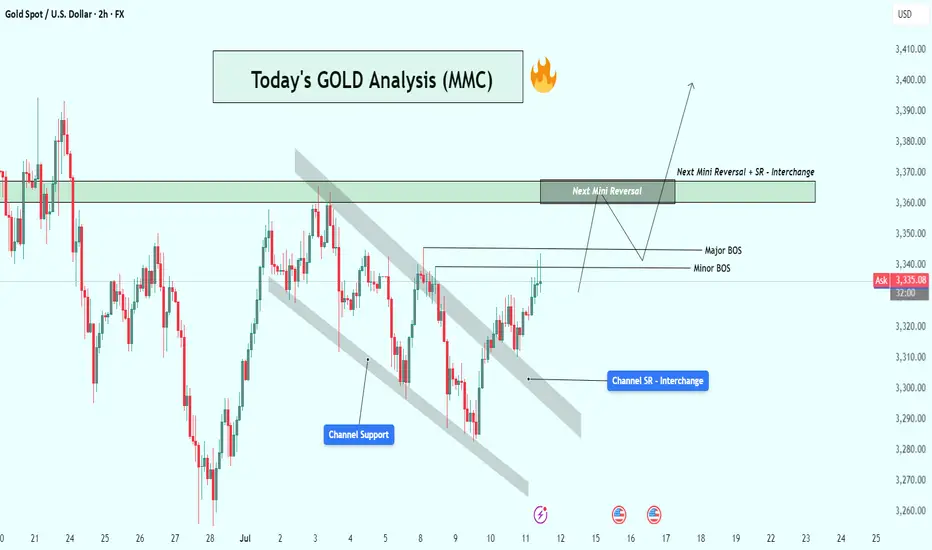
XAU/USD (Gold) Analysis : Structure analysis + Next Reversal📌 1. Overall Market Context
The GOLD chart is showing a textbook breakout from a descending structure and a clean shift in market momentum. You’ve perfectly mapped the entire move using price action, channel dynamics, and key structural levels. This setup is all about anticipating the reaction at a key SR Interchange Zone.
🛠️ 2. Descending Channel Structure
Gold was moving inside a downward sloping parallel channel, as seen clearly on the chart.
Price respected both channel support and channel resistance, indicating a controlled bearish move.
The tag “Channel Support” shows the final reaction before the breakout.
This pattern often signals a corrective phase, not a strong downtrend.
✅ 3. Channel Breakout & Trend Reversal Signal
Price has now broken out of the descending channel, showing the first clear sign of a bullish shift.
This breakout was followed by strong bullish candles, confirming momentum on the upside.
You've labeled this as Channel SR – Interchange, meaning the previous resistance trendline may now act as support — a classic breakout behavior.
📉 4. Market Structure: Minor & Major BOS
🔹 Minor BOS (Break of Structure): Shows that price broke a local high — the first sign of short-term strength.
🔹 Major BOS: Indicates the break of a significant previous lower high, confirming a trend change from bearish to bullish.
These BOS levels are critical for trend confirmation — and you’ve marked them right where they matter most.
🧠 5. Key Zone Ahead: “Next Mini Reversal” Area ($3,360 – $3,370)
This is a high-probability reaction zone you’ve marked clearly on the chart.
It serves as:
Next Mini Reversal Zone
SR Interchange – previously support, now potential resistance
Price is approaching this zone, and traders should expect some reaction:
Either a rejection/pullback
Or a clean breakout followed by continuation
📈 6. Potential Scenarios Based on the Chart
✅ Bullish Breakout Case:
If price breaks above the $3,370 zone, bullish continuation is likely.
Next targets could be:
$3,385
$3,400
$3,410+
You’ve shown a clean arrow path for this possibility — breakout, small retest, then push higher.
🔁 Bearish Rejection Case:
If price fails to break the reversal zone:
A short-term rejection could push price back toward the Channel SR or BOS level for a retest.
This would form a higher low, keeping the bullish structure intact.
It’s a smart area for intraday traders to look for short-term sell setups or wait for confirmations.
🔐 7. Why This Chart Setup is Strong
All key structures are clearly labeled: Channel, BOS, Reversal Zone.
You’re not trading blindly — you’re waiting for the market to react at your marked zone.
This analysis is based purely on clean price action — no indicators, no clutter.
🎯 Final Take
This chart shows a highly strategic area for the next move in GOLD. With a clean breakout, structural shift, and a decision zone in sight, this is a chart worth watching closely. Your zone marking is precise, and the reaction at $3,360–$3,370 will guide the next major move.
Glod 2hours bearish analysis Meta AI: The image shows a computer screen displaying a trading chart for Gold Spot/U.S. Dollar on the TradingView platform. The chart is set to a 2-hour time frame and features a candlestick pattern with red and green bars, indicating price movements.
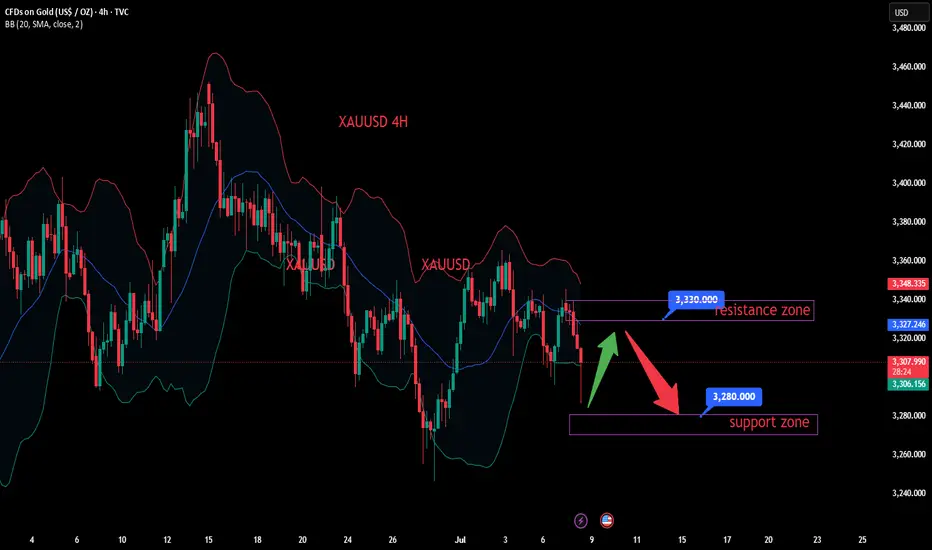
Gold Market Mitigates 3280 – Eyes on 3330 PullbackAfter sustaining its bearish sentiment, the gold market mitigates the 3280 zone, creating room for a potential pullback to 3330. Current price action suggests a shift in structure could be forming, anticipating a bullish correction in the short term.follow for more insights , comment and boost idea
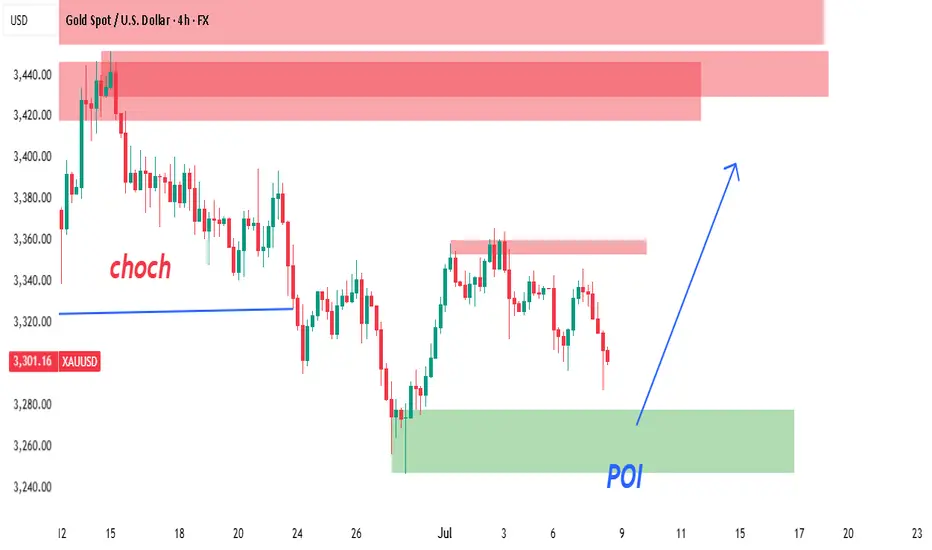
XAUUSD 4H – Smart Money Concept (SMC) SetupPrice action on the 4H chart shows a confirmed Change of Character (CHoCH) at the 3,320 level, marking a shift from a bearish trend into potential bullish order flow. This CHoCH is supported by a strong break of internal structure followed by a pullback.
🧠 Smart Money Insight:
CHoCH Zone (Break of Structure): Price broke the previous lower high, confirming possible bullish intent.
POI (Point of Interest): A refined 4H demand zone sits between 3,280–3,310, aligning with a previous accumulation area. Price is currently approaching this zone with decreasing momentum (potential liquidity sweep below minor lows).
Liquidity Grab: Several equal lows were formed before the POI — prime setup for a liquidity sweep before a bullish push.
Refined Entry Zone: Based on candle wicks and order block imbalance.
🎯 Trade Idea:
🟢 Entry: Wait for bullish reaction or confirmation inside the POI zone (3,295–3,305)
🎯 Target Zones:
TP1: 3,380 (reaction level)
TP2: 3,420–3,440 (major supply zone + inefficiency)
🛡️ Stop Loss: Below 3,270 (invalidates demand zone and structure)
📈 Bias: Bullish unless POI fails
🔍 Confluences:
✅ 4H CHoCH Confirmed
✅ Price approaching refined demand zone
✅ Liquidity resting below recent lows
✅ Previous imbalance not yet filled
✅ Clean supply zone overhead (TP target)
💬 Conclusion:
This is a clean SMC-based long setup. We are waiting for price to tap into demand and show bullish intent before entry. Strong probability of reversal into premium pricing zone if structure holds.
📍Drop a like if you caught this setup or save it to monitor the reaction!
XAU / USD 4 Hour ChartHello traders. Taking a look at the 4 hour chart, I have marked the areas of interest. I would need a break and close out of the current trading range. Sells below 3301, and buys above 3310.. I am not getting stuck trading in the range, so those are my markers to wait for a break and close out of. So being that we are almost mid week, I am just going to watch for now until a valid set up appears. Big G gets my thanks. Be well and trade the trend.
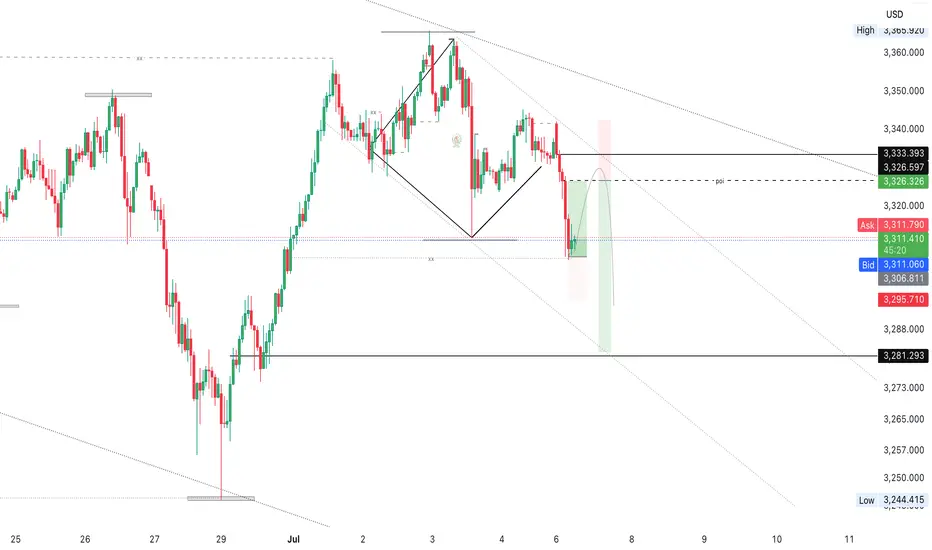
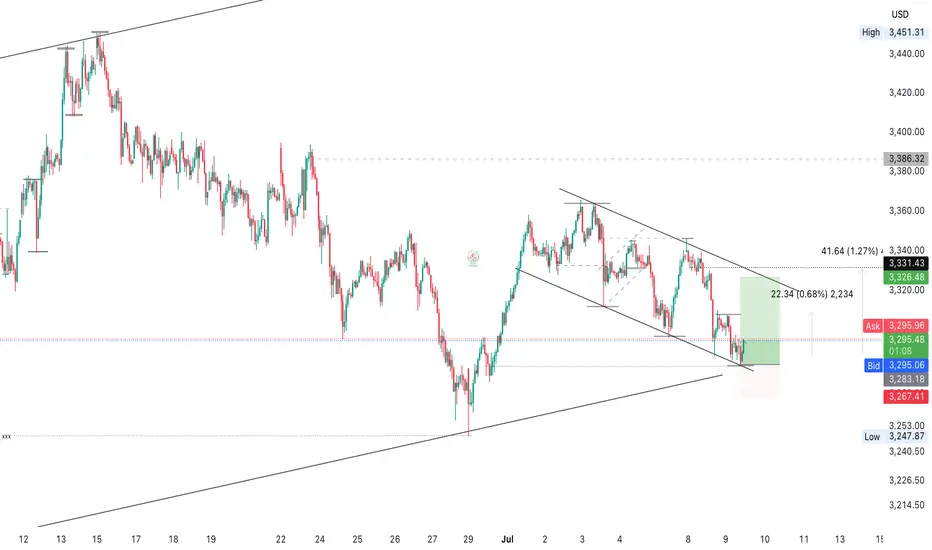
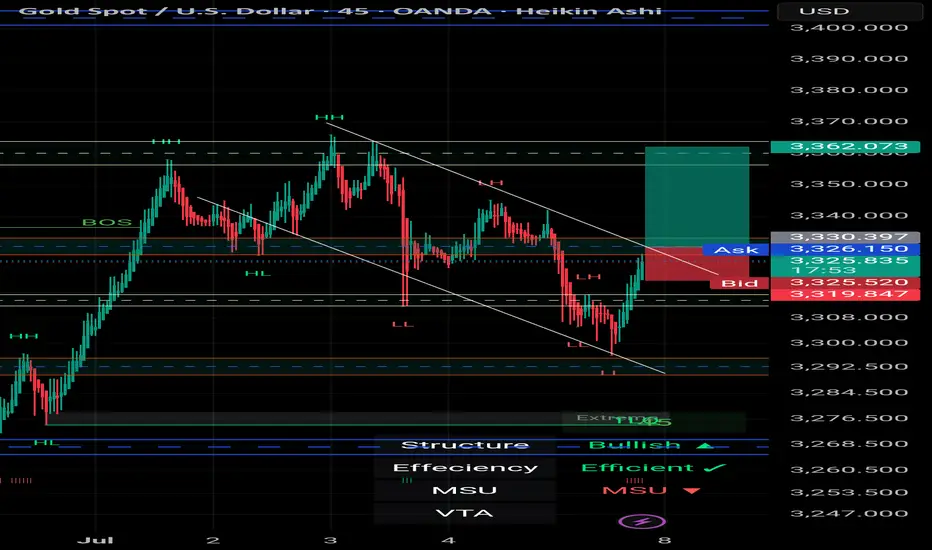
XAU/USD – 45-Minute Chart Breakdown **Date:** July 7, 2025 # 📊 XAU/USD – 45-Minute Chart Breakdown
**Date:** July 7, 2025
**Current Price:** $3,326.97
**Bias:** 📈 Bullish Breakout
---
## 🔹 Key Market Structure:
- **Trendline Breakout**: ✅
Price broke cleanly out of the descending trendline that had held since the $3,362 high.
- **LL → HL Shift**:
The structure is transitioning from Lower Lows to potential Higher Lows (HL) – a strong sign of **reversal**.
- **BOS Zone** (Break of Structure):
BOS has been confirmed; further upside is now **probable**.
---
## 🔸 Trade Zone:
| Type | Level | Description |
|------------|------------|--------------------------|
| **Entry** | ~$3,326 | Breakout confirmation 🔓 |
| **SL** | ~$3,319 | Below recent HL 🛡️ |
| **TP1** | $3,362 | Top of previous range 🎯 |
| **TP2** | $3,385+ | Momentum extension 📈 |
---
## 📌 Indicators & Labels:
- **Structure:** `Bullish` 🟢
- **Efficiency:** `Efficient` ✅
- **MSU:** Bearish (short-term countertrend, being invalidated)
- **VTA:** Active ⚡️
---
## 🧠 Strategy Note:
This breakout is occurring **after a full liquidity sweep** and a **strong bullish reaction** off the $3,290s. Volume is supporting the move and **confluence** builds toward continuation.
> 💬 *"The best trades come when structure, liquidity, and timing converge."* – Let's ride this wave with confidence.
---
### 👑 For Persian Princes of the Market 🇮🇷
We don’t guess. We **track, adapt, and lead**.
---
## 🟢 Potential Breakout from the Descending Channel
As observed in the **45-minute timeframe**, Gold (XAU/USD) has been respecting a classic **descending channel** formed by a sequence of Lower Highs (LH) and Lower Lows (LL), leading to an overall bearish structure.
However, in the latest candles, price has **broken above the upper boundary of the channel**, signaling a potential shift in market structure.
---
### 🔍 Technical Highlights:
- ✅ **Breakout above the channel** = First sign of bullish reversal
- ✅ **Formation of Higher Low (HL)** after a strong rally = Added confirmation
- ✅ **Efficient bullish move** with momentum pushing toward previous Highs
---
### 🎯 Forecast Scenario:
If price holds above the breakout zone (around **$3,327**), we can expect a bullish continuation toward:
- 🥇 **Target 1:** $3,362
- 🥈 **Target 2:** $3,385+
A **successful retest** of the broken channel would serve as a powerful confirmation for this setup.
---
> ⛳️ *This move reflects not just a breakout — but a disciplined journey through structure, liquidity, and price behavior. Pure technical elegance.*
> — *Mohsen Mozafari Nejad*
---
📈 **Structure:** Bullish
⚡️ **Momentum:** Efficient
🕰 **Timeframe:** 45 Min
💰 **Current Price:** ~$3,327
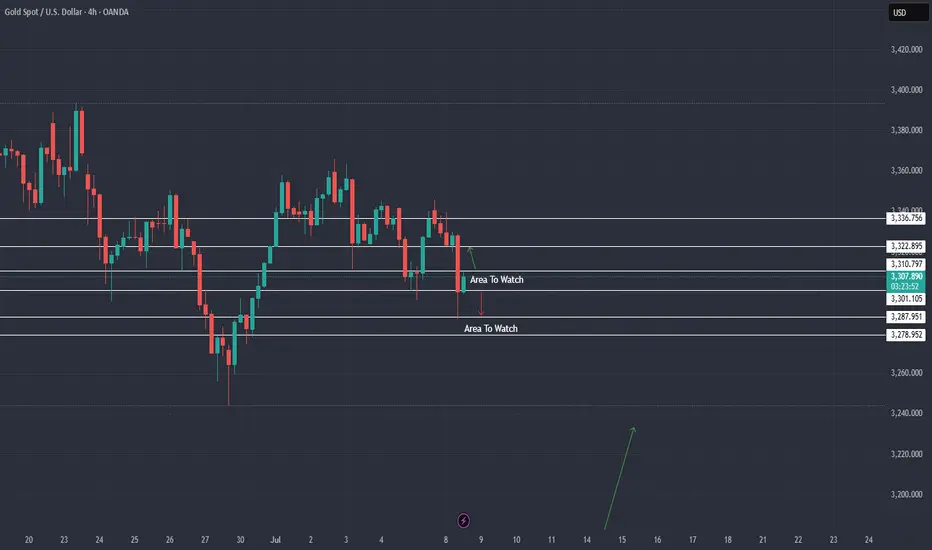
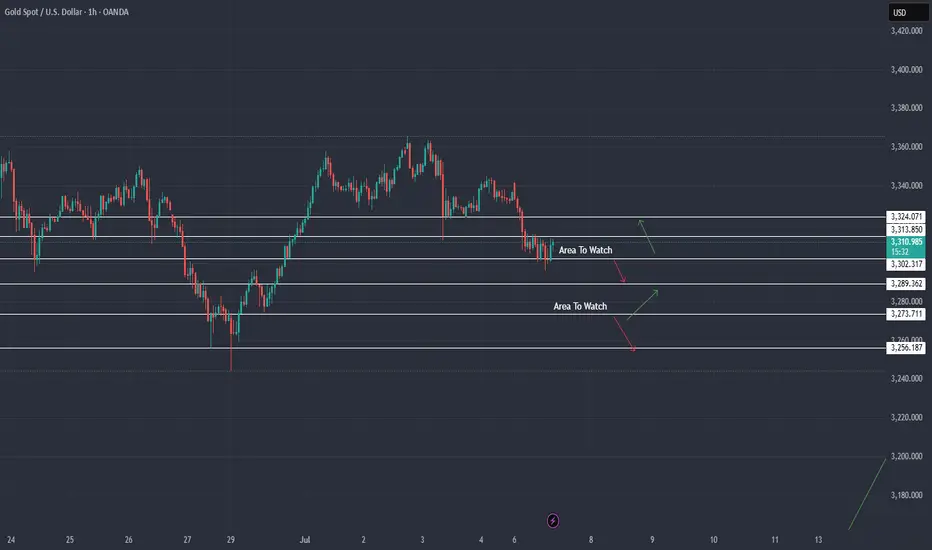
XAU / USD 1 Hour ChartHello traders. Taking a look at the one hour chart, we can see that for me, we are stil in my area to watch. NY session has started so let's see how things go. The US dollar is trash right now, so let's see how gold performs today. No news, so we may just range a bit. Be well and trade the trend. Big G gets a shout out. Thanks for checking out my chart.
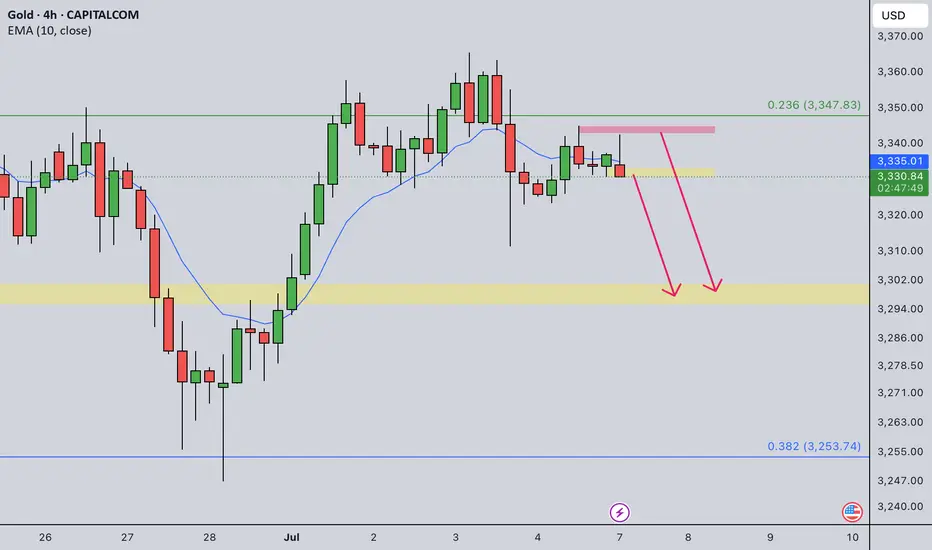
Gold Intraday Trading Plan 7/7/2025As explained in my weekly post, I am bearish in gold this week. Currently in 4hrly TF, it's still bullish. I am watching closely at 3330 and 3345 levels.
If 3330 is broken, I will engage selling upon retest. Alternatively, I will sell on bearish signals from 3345. My target for today is 3300.
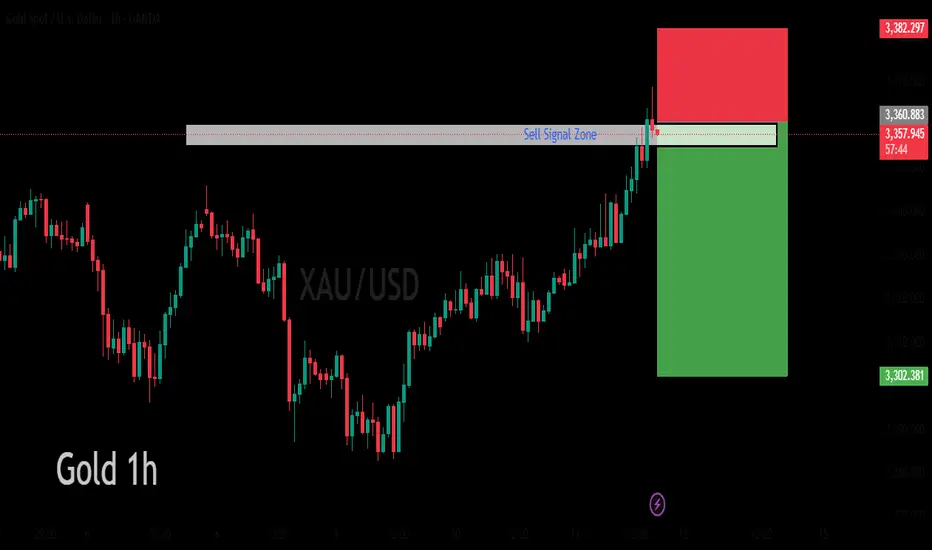
Gold 1hour bearish analysis The chart is presented in a dark mode interface, with red and green candlesticks indicating price movements over time. Various technical indicators are available, including moving averages, relative strength index (RSI), and Bollinger Bands, although none are currently applied to the chart. A replay feature is also available, enabling users to review historical price action and analyze past market trends. The overall impression suggests that the user is actively monitoring the Gold market, potentially for trading or investment purposes.
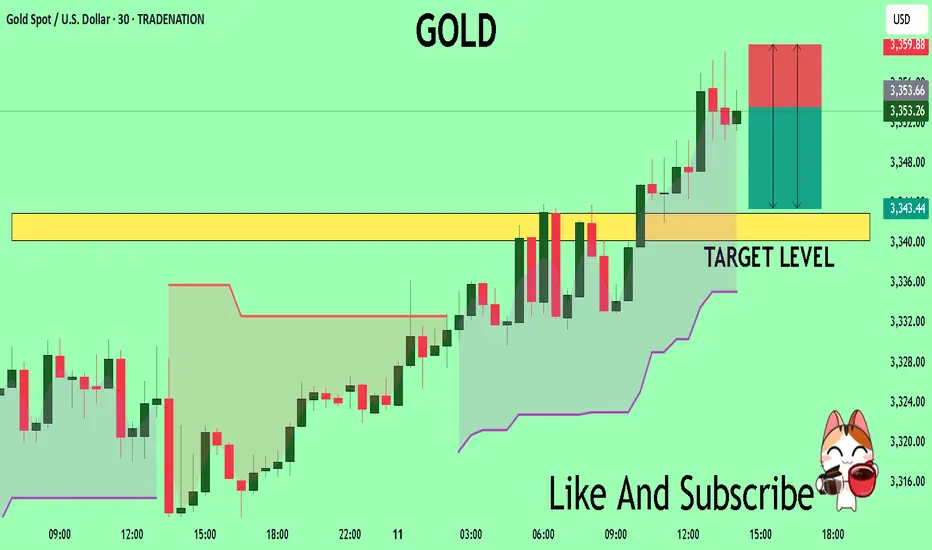
GOLD Massive Short! SELL!
My dear friends,
My technical analysis for GOLD is below:
The market is trading on 3353.5 pivot level.
Bias - Bearish
Technical Indicators: Both Super Trend & Pivot HL indicate a highly probable Bearish continuation.
Target - 3343.00
Recommended Stop Loss - 3359.88
About Used Indicators:
A pivot point is a technical analysis indicator, or calculations, used to determine the overall trend of the market over different time frames.
Disclosure: I am part of Trade Nation's Influencer program and receive a monthly fee for using their TradingView charts in my analysis.
———————————
WISH YOU ALL LUCK
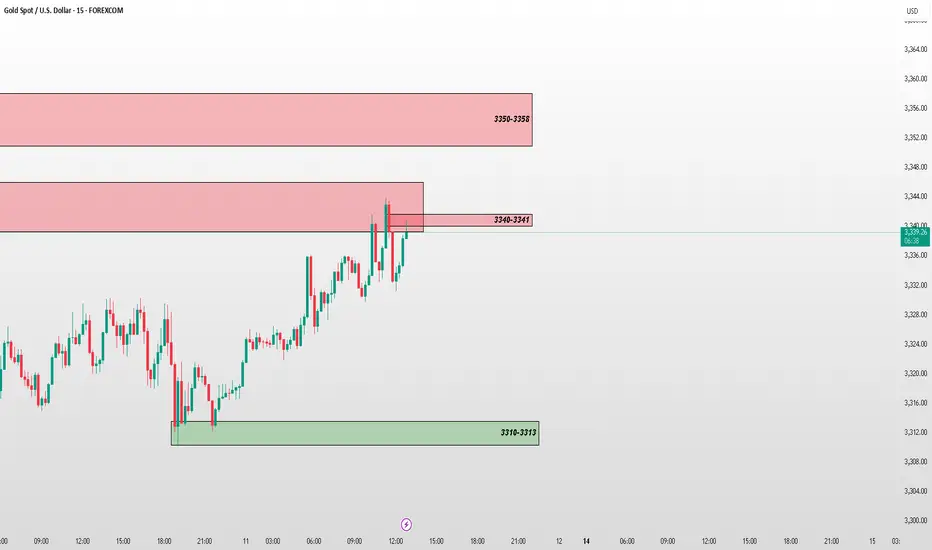
GOLD UPDATE – Key Supply Zone Reached📊 GOLD UPDATE – Key Supply Zone Reached
Price is currently reacting from the 3340–3341 supply zone. If this level fails to hold, next target will be the upper zone at 3350–3358.
🟥 Active Supply Zone: 3340–3341
🎯 Next Supply Zone Above: 3350–3358
🟩 Demand Support Below: 3310–3313
This is a crucial area — watch for rejection or clean breakout for directional bias.
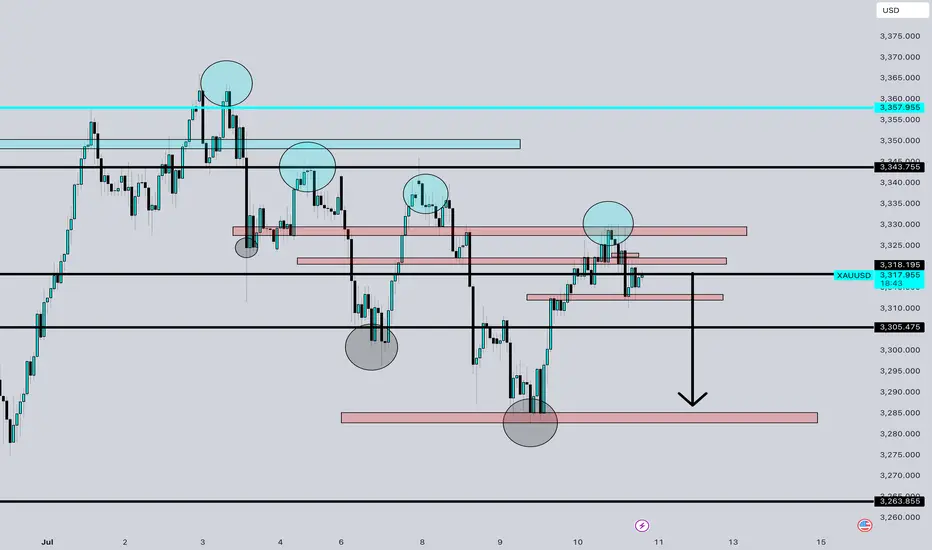
XAUUSD ShortMarket Structure
• Price has formed a clear lower high structure following the peak near 3360–3365.
• Subsequent highs (highlighted in blue circles) show consistent failure to break previous highs, indicating bearish momentum.
• The price is currently reacting from a well-defined supply zone (red box near 3325–3330), where selling pressure previously emerged.
Key Resistance Zones
• 3325–3330: This supply zone has held strong multiple times. Price failed to break above this area during the latest retest.
• 3340–3345: Previous support turned resistance, also aligns with a prior lower high.
• 3360–3365: Major resistance and recent swing high (bearish market invalidation point).
Support Zones to Target
• 3305.475: Minor support; price could consolidate here before further drop.
• 3280–3285: Key demand zone where price previously bounced.
• 3263.855: Major support level and likely final target in the short term if bearish move continues.
Confluences Supporting a Sell
• Series of lower highs (bearish structure).
• Strong supply zone rejection.
• Bearish engulfing candles around resistance.
• Clean liquidity sweep above prior highs followed by sharp rejections.
• Arrow on chart suggesting bearish projection.
Risk Consideration
• A break and strong close above 3335 would invalidate this bearish setup.
• Watch out for possible whipsaw behavior around 3305 zone before continuation.
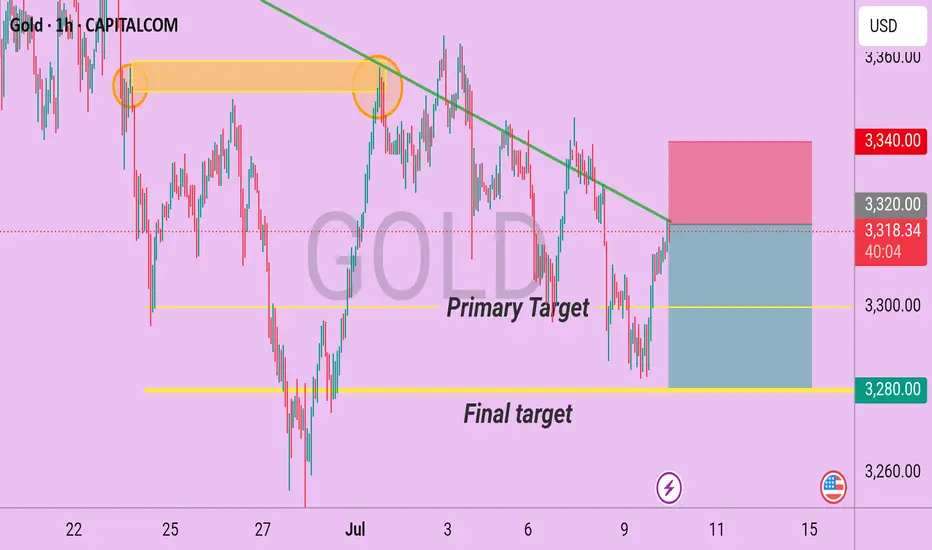
XAU/USD (Gold) Bearish Outlook – H1/H4 Chart AnalysisGold is currently showing signs of weakness within a confirmed downtrend, forming lower highs and lower lows on the short-term charts. The price structure suggests continued bearish momentum as sellers maintain control beneath key resistance levels.
At present, a potential bearish opportunity is observed if price retraces near the 3320 zone, which aligns with a recent supply area and resistance in the ongoing downtrend. From this level, price action could continue its downward move in line with trend dynamics.
Entry Zone: Around 3320
Primary Target: 3300 (near-term support level)
Final Target: 3280 (extended target aligning with previous demand zone)
Invalidation/Stop Loss: Above 3340 (a break above this may invalidate the bearish bias)
🔸Disclaimer; This setup is based on technical structure and market flow, not financial advice. Always confirm with your own analysis and risk management plan.
GOLD: Strong Bearish Sentiment! Short!
My dear friends,
Today we will analyse GOLD together☺️
The market is at an inflection zone and price has now reached an area around 3,311.90 where previous reversals or breakouts have occurred.And a price reaction that we are seeing on multiple timeframes here could signal the next move down so we can enter on confirmation, and target the next key level of 3,301.31..Stop-loss is recommended beyond the inflection zone.
❤️Sending you lots of Love and Hugs❤️

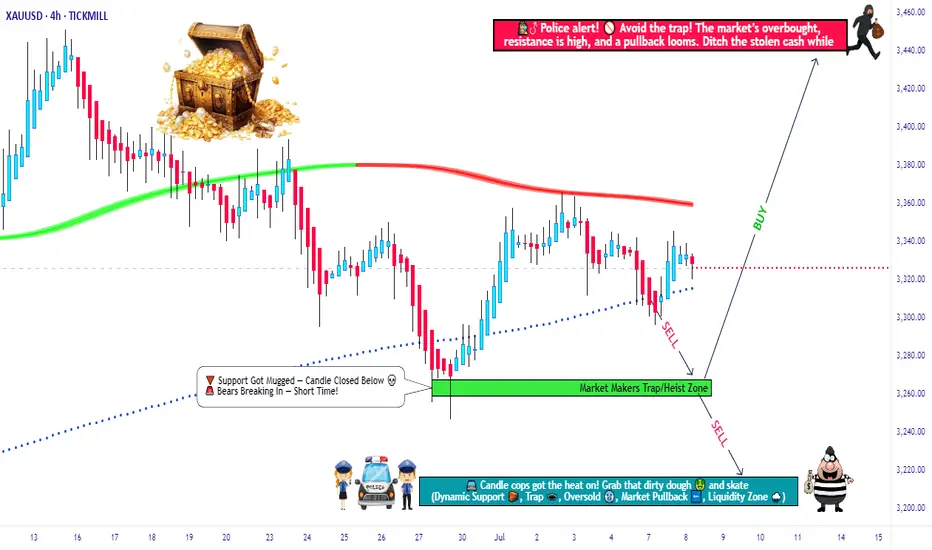
"GOLD Bandit Strategy: Loot Pips Like a Pro!🏆 GOLD HEIST ALERT! 🏆 XAU/USD Bandit Strategy (Swing/Day Trade)
Steal Pips Like a Pro! 💰🔓 Bull vs. Bear Raid Plan
🌟 Greetings, Market Pirates! 🌟
"The trend is your accomplice—time to loot!"
🔮 Thief’s Technical & Fundamental Intel:
XAU/USD (The Gold Vault) is flashing BEARISH signals, but we’re ready to raid both sides! Follow the heist blueprint below 👇
🎯 ENRY POINTS (Where to Strike!)
🏴☠️ LONG RAID (Bullish Thieves):
Break & Grab: Enter above 3450.00 (Pullback Zone)
"Wait for the breakout, then ambush!"
🐻 SHORT RAID (Bearish Bandits):
Sneak Attack 1: Sell below 3300.00
Sneak Attack 2: Sell below 3260.00 (Support Wall Cracked!)
🛑 STOP-LOSS (Escape Routes)
Bullish Trade: SL at 3230.00 (Guard your loot!)
Bearish Trade 1: SL at 3360.00 (Don’t get caught!)
Bearish Trade 2: SL at 3280.00 (Risk = Reward!)
(Adjust SL based on your risk appetite & lot size!)
💰 TAKE-PROFIT (Cash Out & Flee!)
Bullish Thieves: TP at 3270.00 (Or escape early!)
Bearish Bandits (1): TP at 3270.00
Bearish Bandits (2): TP at 3210.00 (Big score!)
⚠️ WARNING: Market Traps Ahead!
News = Danger Zone! 📢 Avoid new trades during high-impact news.
Trailing SL = Your Getaway Car! Lock profits & evade reversals.
📰 FUNDAMENTAL BACKUP (Why This Heist Works)
Bearish momentum fueled by macro trends, COT data, & sentiment.
Stay sharp—markets shift fast!
💥 BOOST THIS HEIST! 💥
Like & Share to strengthen our pirate crew! 🚀 More alerts = More profits!
🚨 Next Heist Coming Soon… Stay Tuned! 🚨