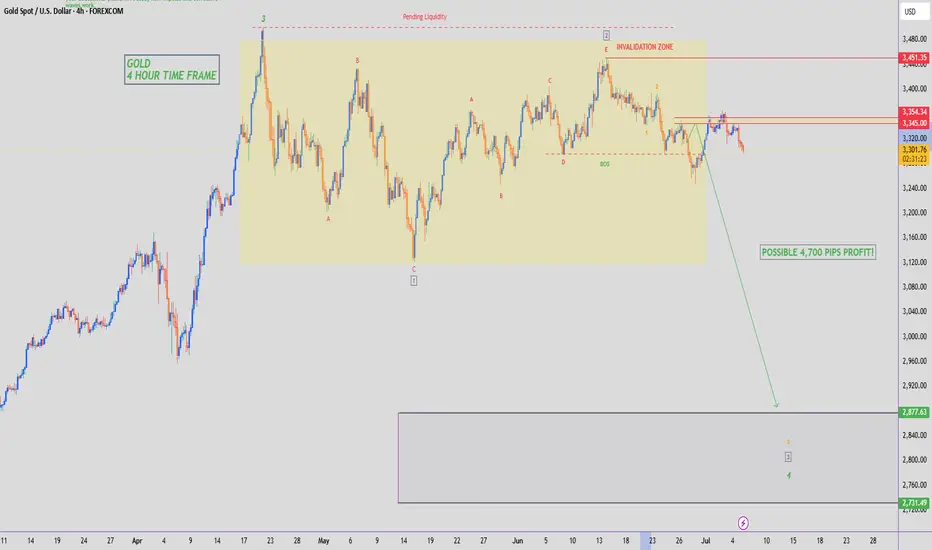
GOLD - SHORT TO $2,800 (UPDATE)Gold has started the week extremely bearish, down 450 PIPS since last night at market open. This puts our 'Sell Trade' in 480 PIPS profit so far. Great start to the week.
XAUUSDG trade ideas
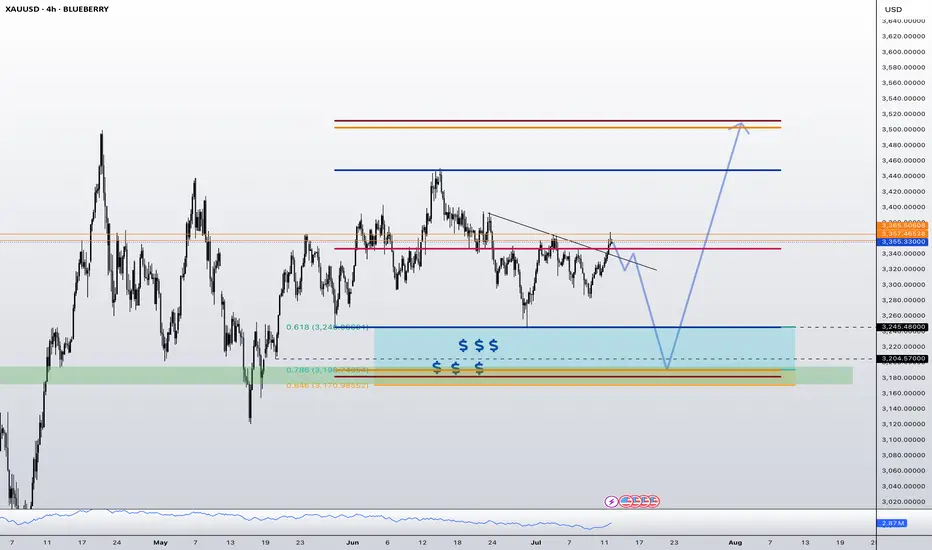
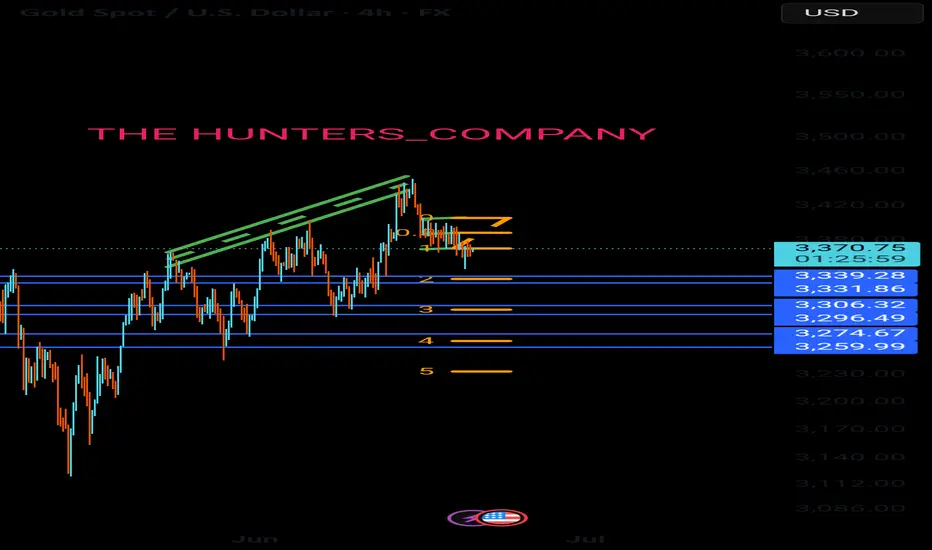
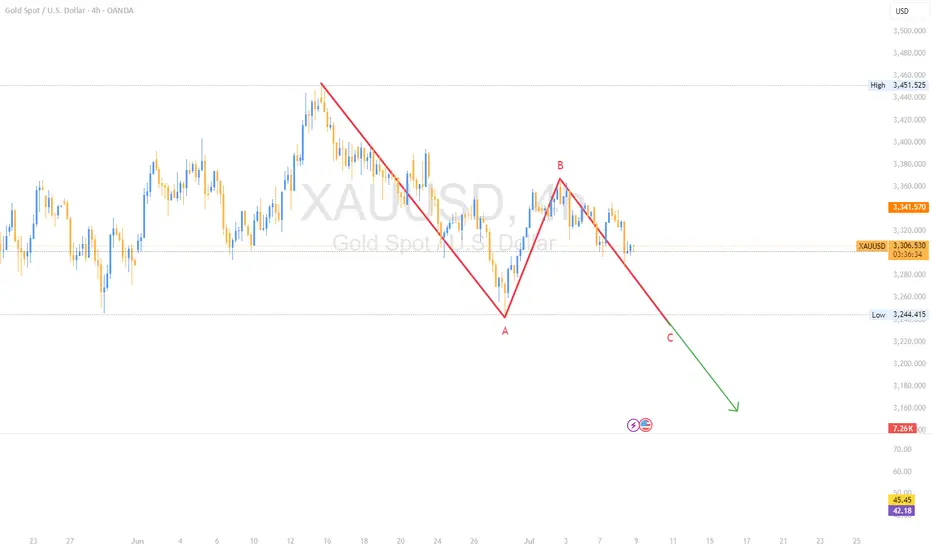
XAU/USD elliot wave countOANDA:XAUUSD
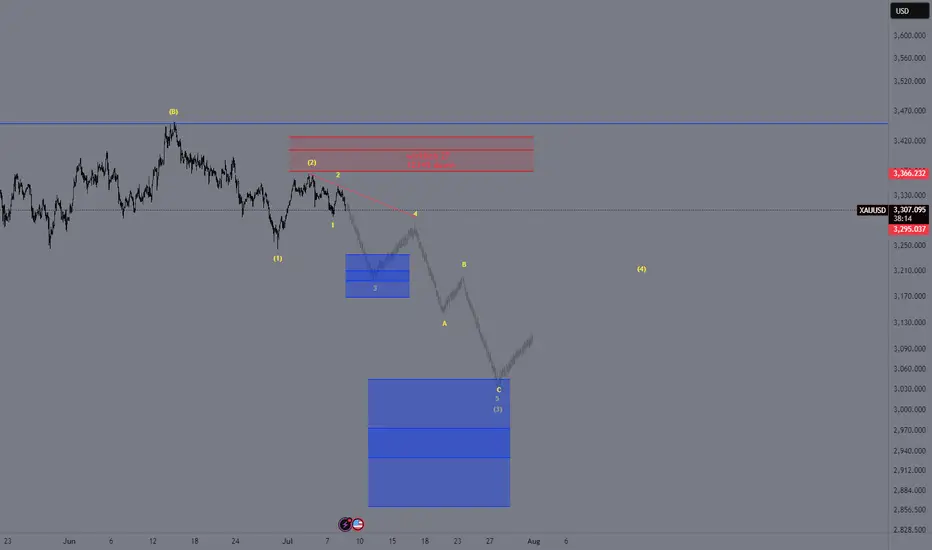
📊 Elliott Wave Analysis (Overview)
🔹 Primary Structure: We're currently moving from white Wave 3 into white Wave 4.
🔹 Wave 4 Breakdown:
So far, Wave 4 is developing as a typical ABC corrective pattern.
Waves (A) and (B) (in brackets) have already been formed.
🔹 Wave (B) Internal Structure:
Wave (B) is unfolding as an impulse: we’ve completed Bracket 1, Bracket 2, and we’re now on the way into Bracket 3.
Within Bracket 3, we've already built a yellow Wave 1 and a potential yellow Wave 2.
🔹 Current Market Condition:
For the bearish scenario to stay valid, we must remain below the red trendline.
If we break above the red trendline, then yellow Wave 2 would likely extend higher and complete itself inside the red Fibonacci zone — making the correction deeper.
🎯 Target Zones:
Targets for yellow Wave 3 and the broader Bracket 3 are already displayed on the chart.
However, these targets can still be adjusted depending on how price unfolds in the coming sessions.
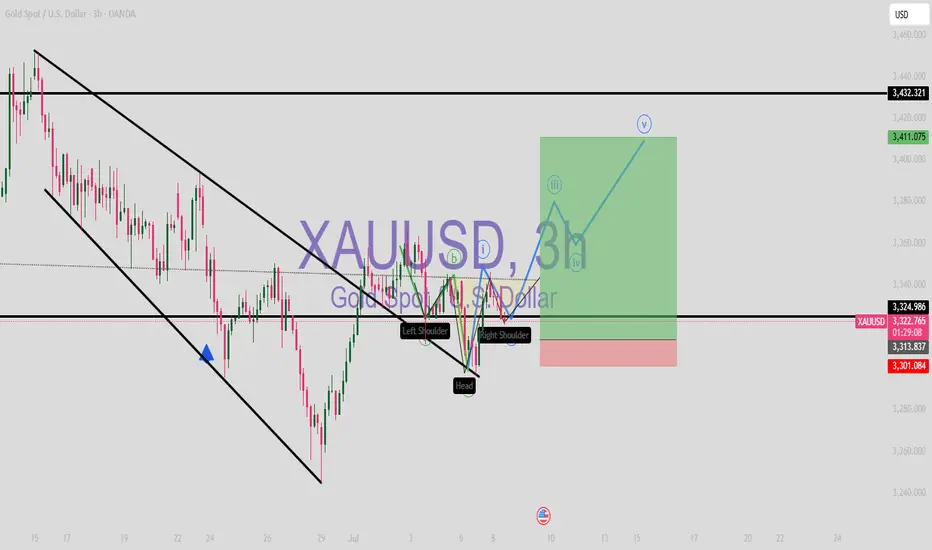
XAUUSD (LONG)
Inverse head and shoulders
Restest of tredline(previous was resistance now support)
Eliiots wave count (ABC done,1-5 in progress)
Excellent yesterday's sessionAs discussed throughout my yesterday's session commentary: "My position: In my opinion I need to stay on Hourly 4 time-frame for us and the potential break-out to the downside since Hourly 4 chart remains Bearish (never Swing Buy while #H4 is Bearish) on logarithmic scale, hence on limited upside. My expectation is that we still have one (minor) rebound left which will be the final Selling attempt / entry towards #3,300.80 benchmark, if Buyers manage to reverse this, #3,352.80 and #3,400.80 marks are Targets to monitor / which I will pursue with set of Scalp and Swing orders. Trade accordingly as I Bought #3,302.80 with set of aggressive Scalp orders."
I have Bought Gold with aggressive Scalps from #3,297.80 - #3,302.80 zone, firstly closing my orders as near as #3,310.80. Later on, did #4 more Scalps from #3,308.80 - #3,313.80 / closing all as near as #3,322.80 as I announced that Gold will certainly recover as per above (cca #171.000 EUR Profit using #100 Lots).
Technical analysis: Ranged Price-action came as no Technical surprise as Price-action remains in Rectangle on a combination of Fundamental pressure and Technical necessity for a Lower Low’s extension. It is closely related to currency Volatility on DX (and the economy related Fed’s talks and Tariffs agreements of utmost importance) as the Price-action in near equilibrium with DX (# -0.27%) also on Weekly scale and even if the pair completes full scale reversal, Gold should stay under Selling pressure. On the Short-term side, there is an clear Resistance and Support zone, limiting Sellers advances to it’s maximum thru Fundamental side (every early to late U.S. session revives Buyers on the aftermath). Gold should already Trade widely below #3,300.80 psychological barrier, but now Resistance tests seems more likely to develop and showcase Short-term Buyers presence. Hourly 4 chart points that Lower High’s Lower zone is near and Resisting the Price-action at #3,334.80 - #3,342.80 which makes it an possible Hourly 1 chart’s Ascending Channel variance - typical Target of similar sequence if break-out is delivered includes #3,348.80 - #3,352.80 on Short-term. In extension - I will advance with extreme care ahead of the most significant macroeconomic events of the week and since my model leans more to the Bullish side and Fundamentally Gold may soar, I will remain Scalping Gold as using Swing orders practically is worthless on such market.
My position: I will keep Buying and Selling Gold only with my aggressive Scalp orders from my key entry and reversal points.
Ready, Steady...?Gold has consolidated the past few weeks and has now bounced from solid support.
The current wave 4 looks complete and should now be followed by a strong upward move in wave 5, wave 5's in the metals are the strongest...expect a move towards $4000 coming.
Your chance to get on board early and ride this bull run again!
Appreciate a thumbs up, good trading and God Bless you all!

SHORT IDEAI previously posted a bullish play. But now after studying the charts.
I see a potential for a really big BULL squeeze.
And a very nice opportunity to swing gold!!
XAUUSD SHORT
📉 CHoCH Spotted (LTF) – Market just flipped bearish!
🔥 Sellers in control after breaking structure.
🎯 TP: Demand Zone below
🛑 SL: Just above the supply zone
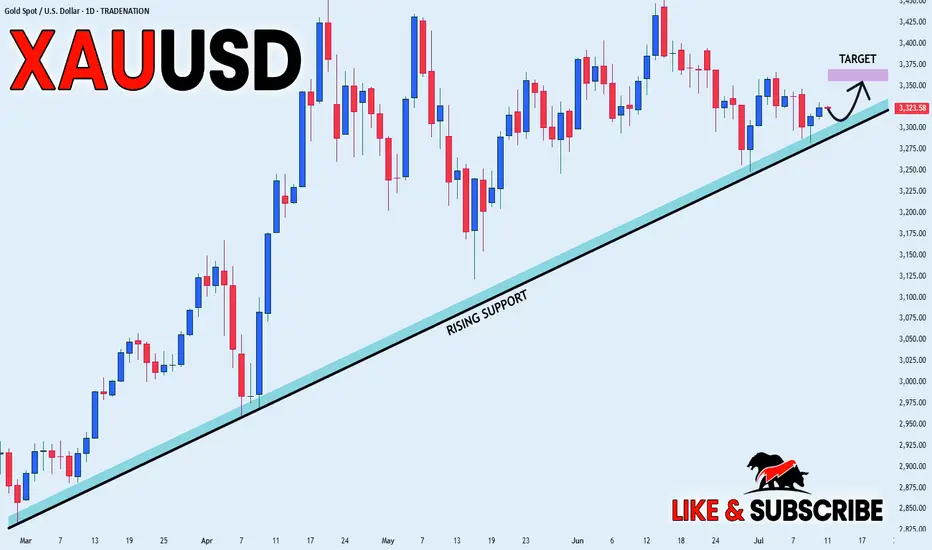
GOLD SWING LONG|
✅GOLD is trading in a strong
Long-term uptrend along the
Rising support line so we are
Bullish biased and after the price
Breakout of the local opening wedge
We we will be expecting a
Further bullish move up
LONG🚀
✅Like and subscribe to never miss a new idea!✅
Disclosure: I am part of Trade Nation's Influencer program and receive a monthly fee for using their TradingView charts in my analysis.
XAUUSD SELLPrice retraced back to an Area of Interest left behind impulsively.
Let's see if price respect the entry zone for a possible 4:1+
Like for more ideas
Follow if you agree
XAUUSD Sell Nowthis is gold pairs and my analysis say gold down soon possible, like my analysis and share.
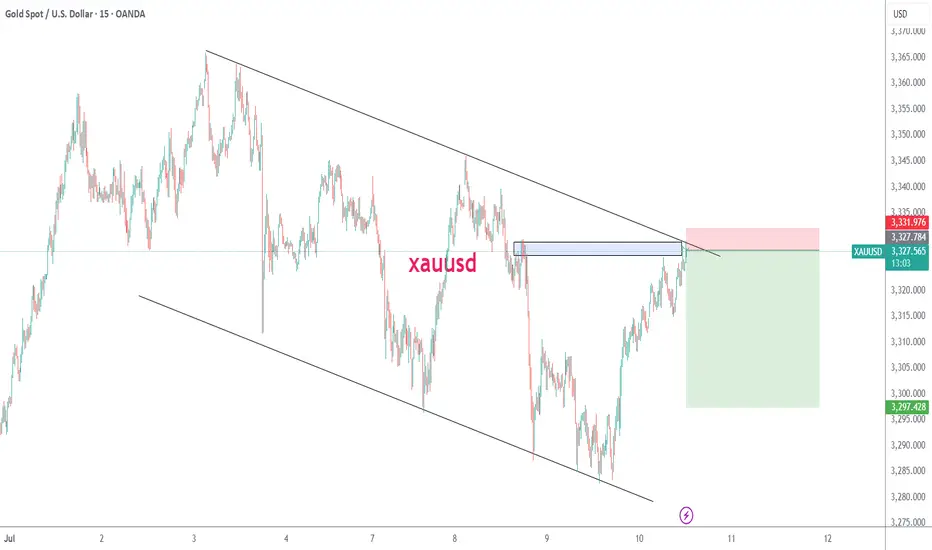
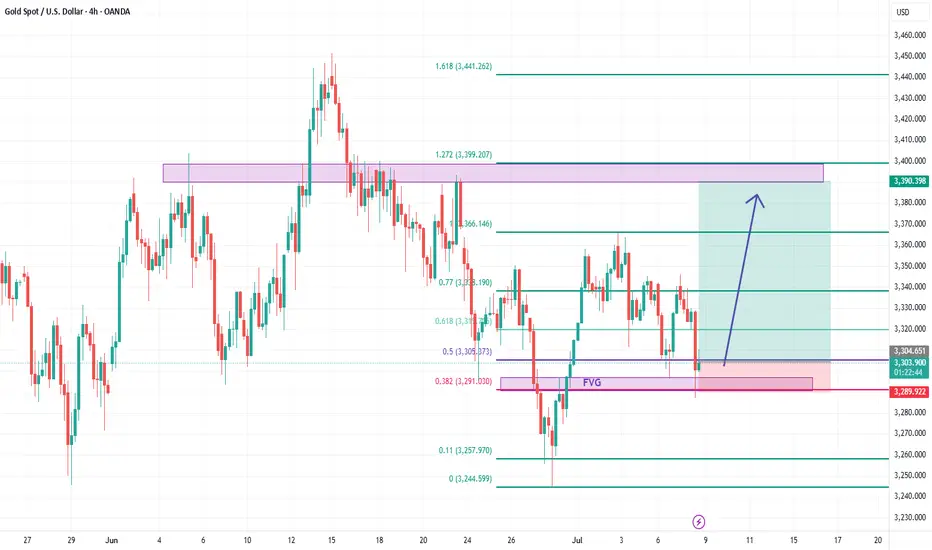
Gold next setupAs you see on chart
gold rebound from Fibo 38 + FVG
If 2290 hold
we may see 3390
Entry point now @ 3404
SL 2290
TL 3390
RR 8:1
good lock
Wego
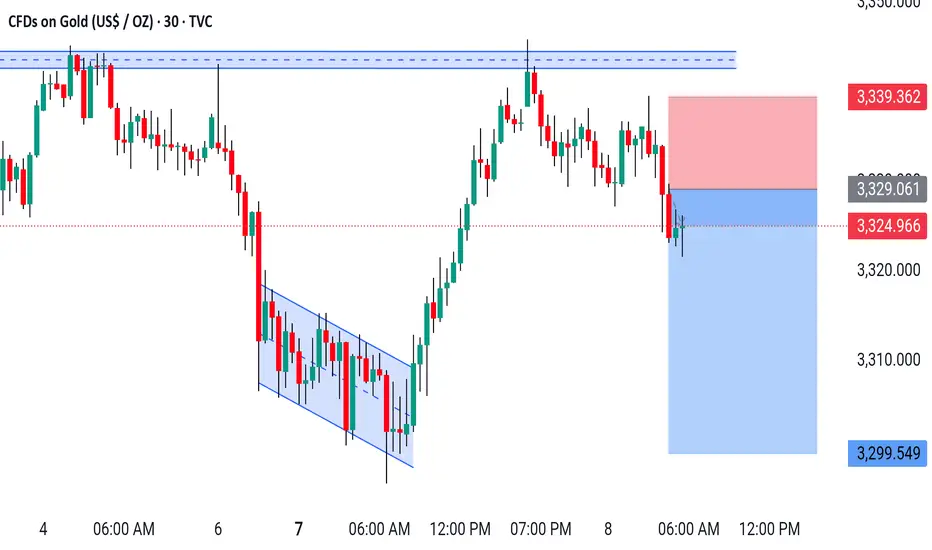
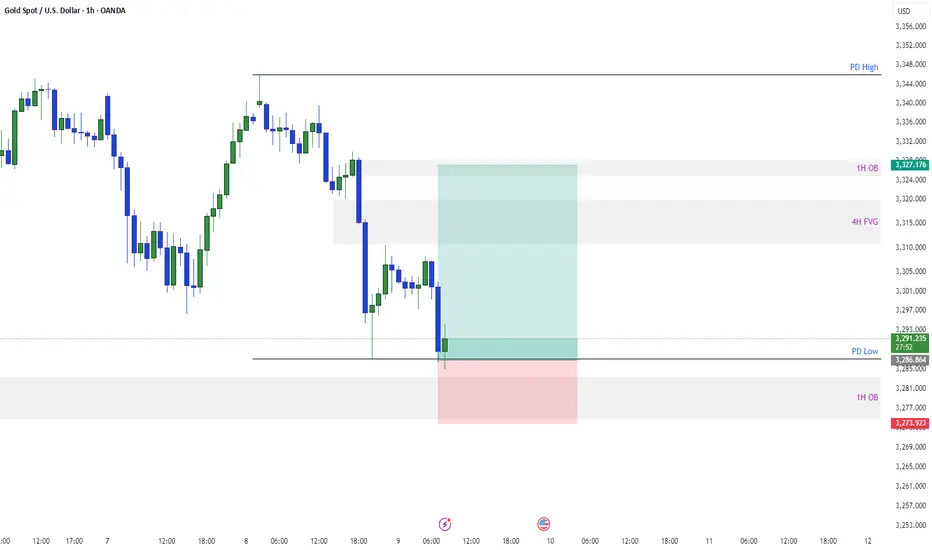
XAU / USD 1 Hour ChartHello traders. I have marked my area of interest on the hourly chart. We have Pre NY volume starting in 2.5 hours or so from now. Looking to see if we correct the move down from the overnight sessions , or do we continue down to retest a lower area for support, as marked on the chart?? Patience is key. Big G gets my thanks. Be well and trade the trend, I will post another chart / update in a few hours.
XAUSD is BullishPrice was in a downtrend, however the bullish divergence on 15 min time frame hints the control of bulls, if previous lower high is broken with good volume then we can expect a bullish rebound from the levels as per Do w theory. Targets are mentioned on the chart chart.
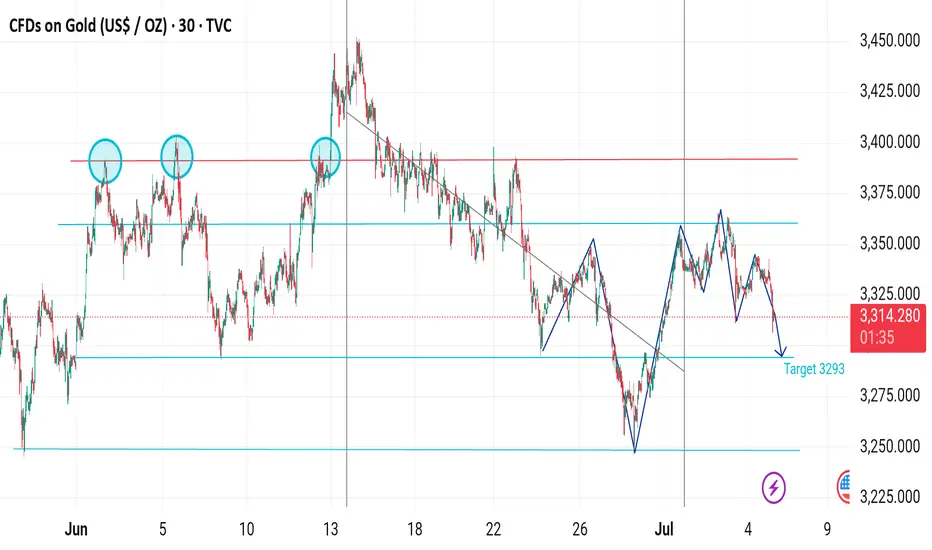
Gold Bearish Reversal – Targeting 3293 After Channel Breakdown📉 Gold (XAU/USD) 30-Min Chart Analysis:
🔹 Pattern Overview:
Triple Top Formation spotted (circled areas), indicating strong resistance around the 3,365–3,375 zone.
A descending channel formed after the top, showing consistent lower highs and lower lows — clear bearish momentum.
Fib retracement level (0.618) acted as a resistance during the bounce.
🔹 Current Price Action:
Price broke down from the recent bullish correction inside the channel.
Bearish impulse wave is forming again after lower high around 3,355.
Price is currently dropping from ~3,360 to 3,313, heading toward key support.
🔹 Target & Support:
Marked downside target: 3,293 — aligned with prior support zone and measured move from the last swing high/low.
This is a critical demand area; potential short-term bounce could occur there.
🔹 Conclusion:
Bias: Bearish below 3,335.
Immediate Target: 3,293
Invalidation: Break above 3,355 could delay or reverse bearish move.
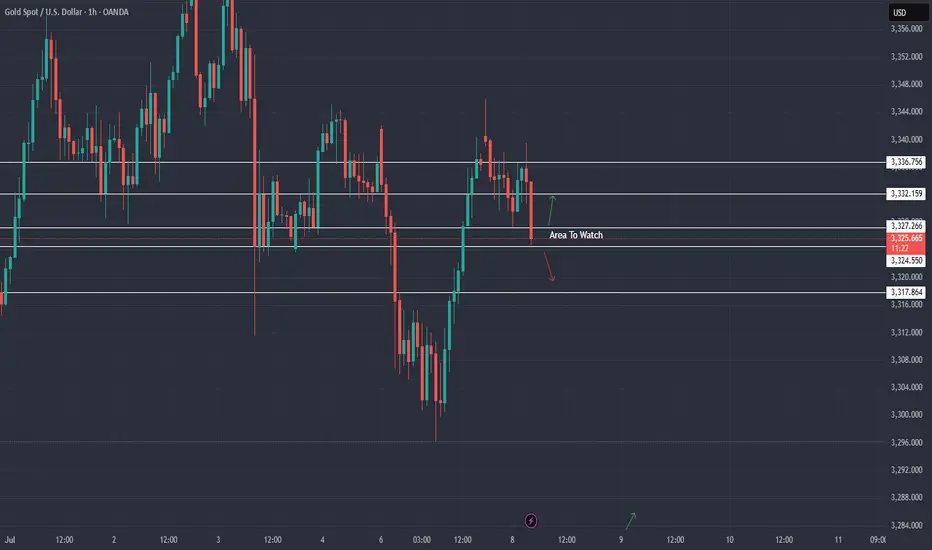
XAU / USD Hourly ChartHello traders. Here is the one hour chart showing where I would look for potential scalp short positions if things line up correctly. 3321 is the first area to watch for a possible short, but the second move down may be more condusive as it takes me forever to type this out. This is speculation of a trade set up, not advice. Big G gets a shout out. Be well and trade the trend.
Gold: update hello friends✋️
According to the recent growth of gold, you can see that it is constantly resisting and forming a falling pattern.
For this reason, it can be a warning that the fall can continue and the price will fall to the specified limits.
🔥Follow us for more signals🔥
*Trade safely with us*
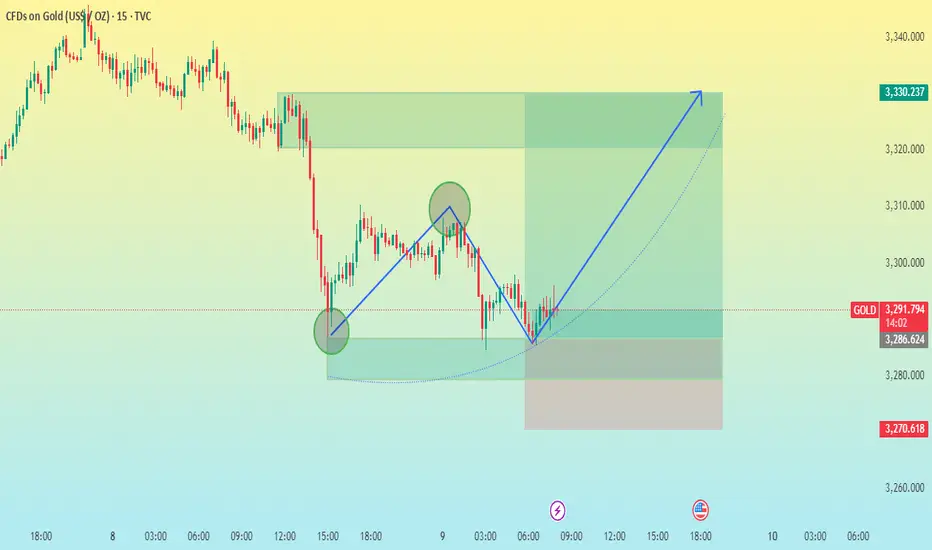
XAU/USD 15M CHART PATTERNThis chart is a 15-minute candlestick chart of Gold (XAU/USD) as of July 9, 2025, and it shows technical analysis using price action, chart patterns, and risk-reward mapping. Here's a comprehensive breakdown:
---
🔍 1. Pattern Analysis:
Cup and Handle Pattern (Potential Formation):
The chart shows a curved “U” shape forming a base (highlighted by the dotted curved line), suggesting the cup.
A handle seems to be forming or has formed recently, a typical consolidation phase after the cup.
The breakout is expected to occur to the upside, as indicated by the blue upward arrow.
---
📉 Price Levels and Zones:
Current Price: 3,294.474
Support Zone: Around 3,270.618 (red line – likely the stop-loss level)
Resistance/Target Zone: 3,330.237 (green upper target box)
Risk-Reward Ratio: Favorable — the reward zone is significantly wider than the risk zone.
---
🟩 Key Technical Markings:
Green Circles: Indicate potential swing low (left base of cup) and swing high (top of handle).
Blue Arrows: Outline the anticipated bullish breakout trajectory.
Rectangles:
Green Rectangle above the current price indicates the take profit/target area.
Red Rectangle below the current price indicates the stop-loss zone.
---
📈 Volume & Momentum (Implied):
While volume isn't shown directly, the chart implies momentum building at the handle, a classic precursor to breakout in such formations.
The bullish bias is further supported by higher lows forming along the curved base.
---
⏰ Time Context:
The chart timeframe is 15-minute candles, making this a short-term/intraday setup.
The anticipated move may complete within a few hours to a trading day if the pattern plays out.
---
📊 Trading Plan Summary (based on chart):
Parameter Value
Entry (approx.) 3,294
Stop Loss 3,270
Take Profit 3,330
Risk:Reward ~1:1.5+
---
✅ Conclusion:
The chart shows a bullish cup and handle formation with a clear plan for a long trade.
The setup looks technically sound with a defined risk and upside potential.
Ideal confirmation would be a strong breakout candle with volume from the handle area.
Would you like a trading strategy or script based on this chart for automation (e.g., in TradingView Pine Script)?
Gold Recovery Trade As gold moved around 500 pips on last day. The pull back seems good and this trade's possibility will be good and a good Risk Reward ratio. Keep your risk small if you want to take the trade. This isn't an investment advice this is a probability analysis. Which according to market structure seems good.
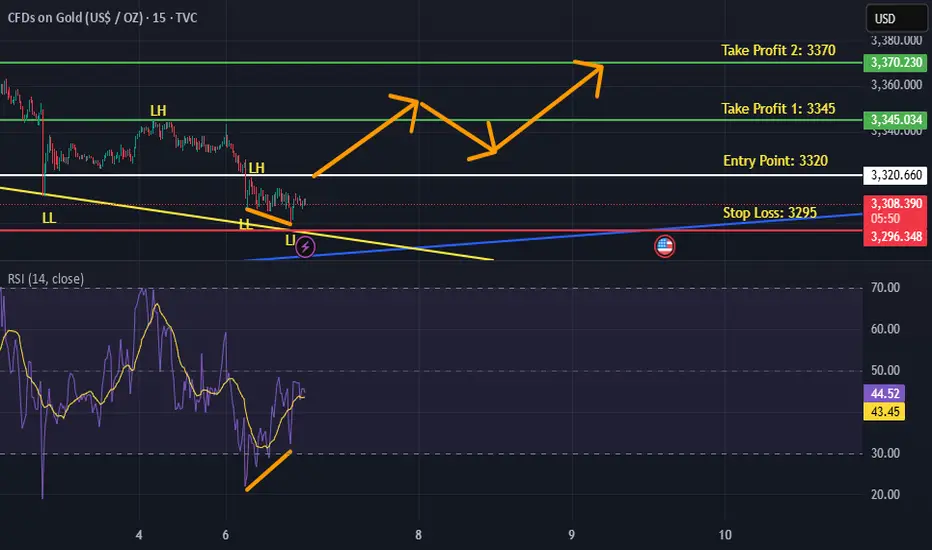
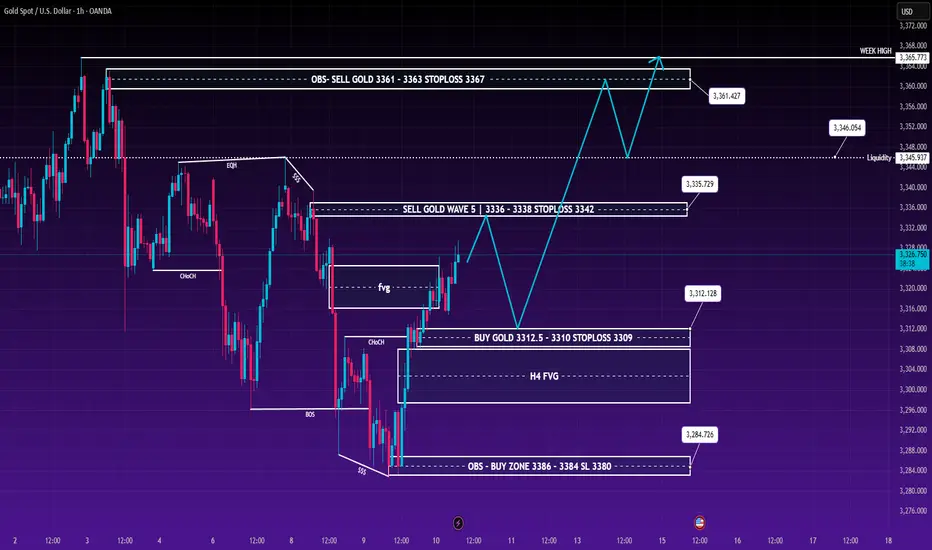
[XAU/USD] GOLD TODAY – PREFER BUY SCENARIO – WAVE 5 COMPLETION🔎 TECHNICAL ANALYSIS
Currently, Gold is moving in Wave 5 of the primary impulse structure. Key price zones have been clearly identified:
🟢 Main Trading Plan: Prefer BUY
✅ BUY LIMIT around: 3312.5
🛡 Stoploss: 3309
🎯 Expected Target:
Short-term: 3336–3342
Medium-term: 3361 (OBS Supply)
Longer-term: Potentially test WEEK HIGH ~3365–3367
Note: 3312.5 is a strong confluence zone consisting of:
H4 FVG
Liquidity Pool
Option data shows concentration of funds at this zone
Wyckoff structure clearly indicates ST (secondary test) at this zone
🛑 SELL Setup – If you're scalping or trading corrective waves:
SELL GOLD WAVE 5 Zone: 3336–3338
SL: 3342
Expect a pullback to 3312.5 before continuing upwards
Scenario: This is a small corrective wave 4 within the larger Wave 5.
📊 CHART 2 – WYCKOFF PHASE C–D SUPPORT
The supplementary chart shows a clear WYCKOFF accumulation model:
Phase C is complete → Currently in Phase D (Markup Phase)
The upward wave from ~3285 has completed 5 small Elliott steps, preparing for a pullback to the support zone (3312.5) before breaking higher.
🌐 MACROECONOMIC NEWS AFFECTING GOLD
🏦 The Fed is expected to keep interest rates high in July with a 93.3% probability → Weaker USD, supporting higher Gold prices
📉 US bond yields are declining, increasing demand for safe-haven assets
🪙 Tether is quietly accumulating 80 tonnes of gold in Switzerland – A signal of the trend toward physical asset accumulation for safety
🧾 FOMC meeting minutes: Most members believe tariffs could have a long-term impact on inflation → Expect Gold to remain positively supported
✅ CONCLUSION
For today and the next few sessions, the BUY GOLD scenario at 3312.5 remains the main strategy, with expectations of movement towards higher levels. Be cautious when the price reaches the 3336–3338 zone, as a small pullback could occur.
"Price doesn't just reflect technicals; it also reflects sentiment – and today sentiment favours the buyers."
📌 SUMMARY TRADING PLAN:
BUY Limit: 3312.5
STOPLOSS: 3309
TP: 3336 - 3361 – 3367
Wave 5 Channel + Liquidity
SELL Scalp: 3336–3338
Stoploss: 3342 - 3312.5
Corrective wave, light scalp
📌 If you're trading Gold this week, remember to set clear SL levels and prefer to wait for a pullback – avoid FOMO at high prices.
Elliot WaveOn the 4hr you could see that wave C is in progress. On the daily gold is currently busy with a Wave 5. Once Wave C is finish on 4hr we might get a movement up . Wave ABC on the 4hr is a pullback on the daily.
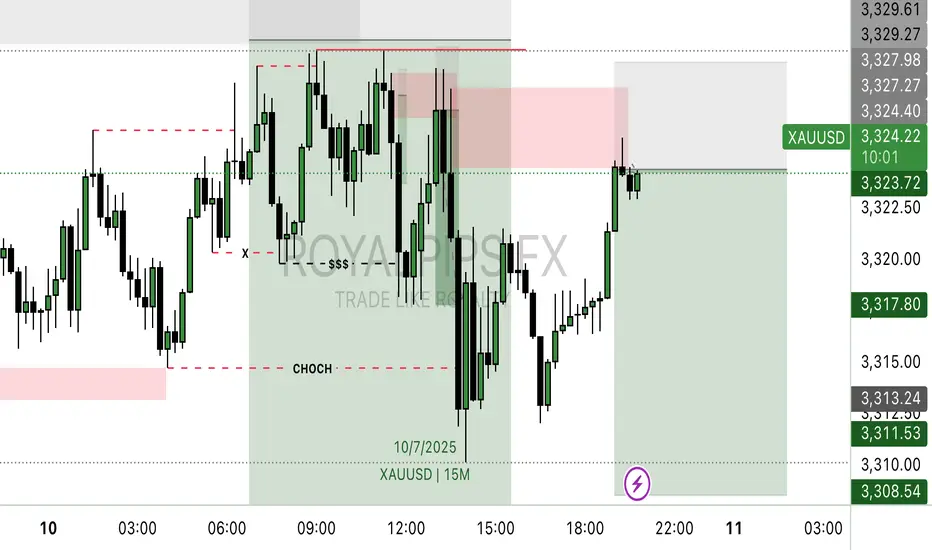
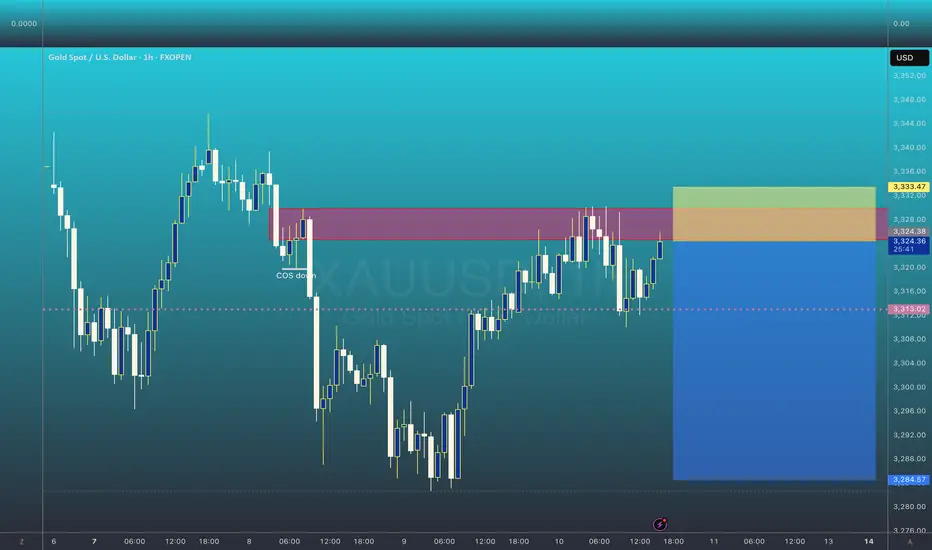
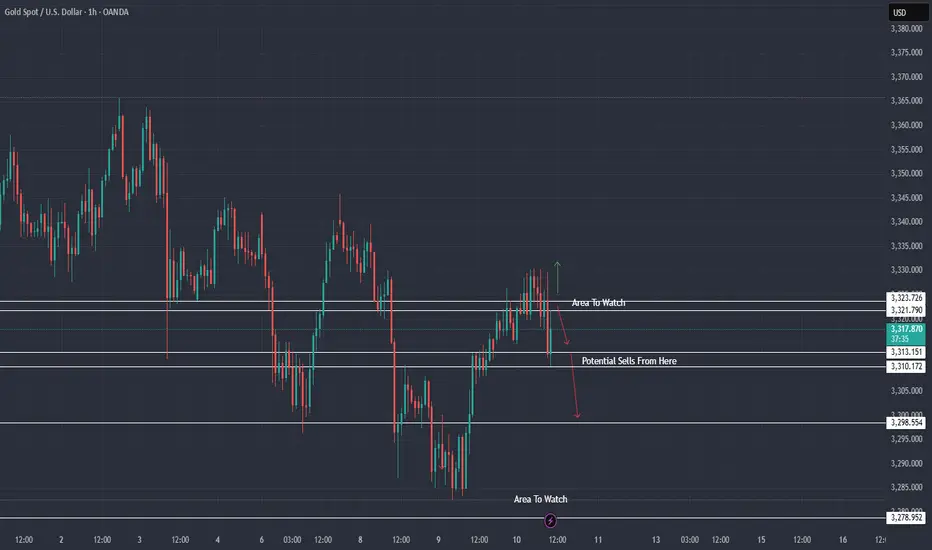
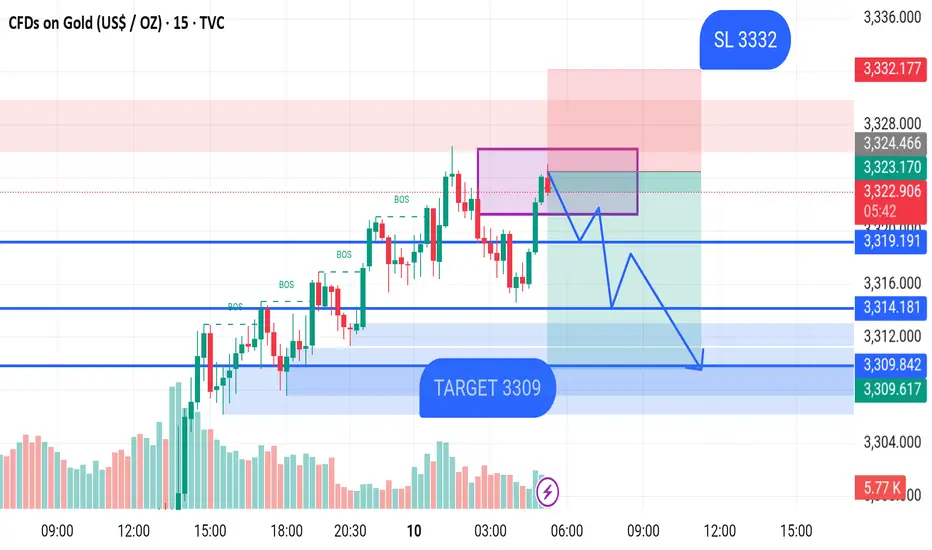
GOLD SELL M15 XAU/USD (Gold) 15-Min Chart Analysis – July 10, 2025
The chart shows that price is currently trading around 3323.98, approaching a key supply zone marked in purple. This area is expected to act as resistance, where price may reverse.
Multiple Break of Structure (BOS) levels have been marked, confirming bullish momentum earlier. However, the chart now suggests a potential bearish reversal from the supply zone.
Trade Idea:
Entry Zone: Near the top of the purple resistance area (~3324)
Stop Loss (SL): 3332
Target: 3309 zone (highlighted in blue), which aligns with the demand zone and previous structure
Key Levels:
Resistance Zone: 3324–3332
Support Zones:
First Support: 3319.19
Second Support: 3314.18
Final Target Zone: 3309.84 – 3309.61
The expected move is a sell from the supply zone down to the 3309 target. Price is projected to form lower highs and lower lows as shown by the blue arrow path.
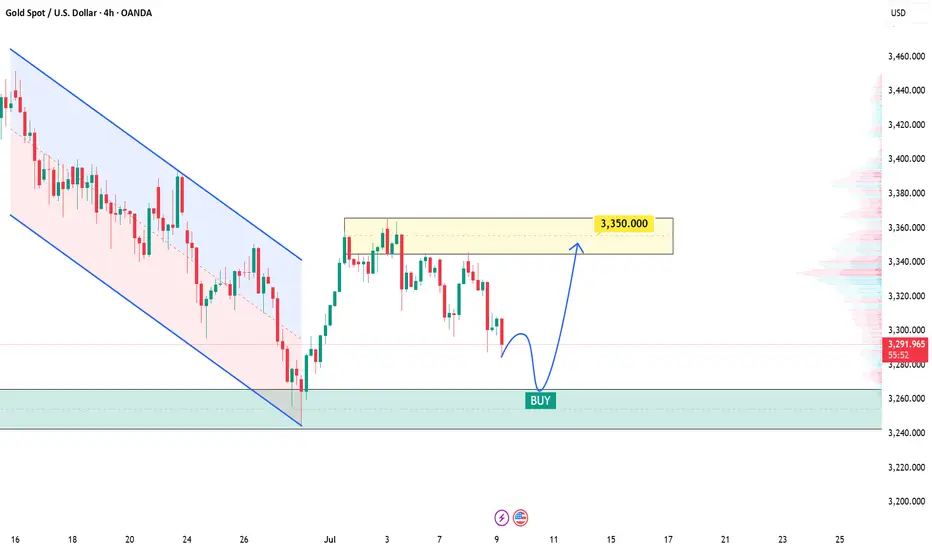
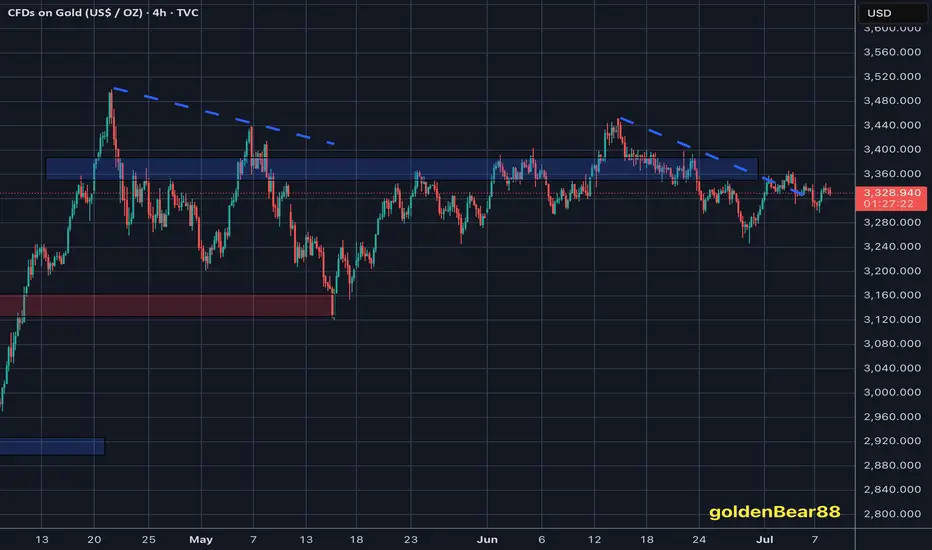
XAUUSD: Setup Signals a Potential Continuation Toward 3,550Gold is currently moving within a short-term bearish structure following a sharp rejection at a key confluence resistance zone. The ongoing pullback has taken price back to the origin of a previous strong rally, aligning with a high-liquidity area on the Volume Profile.
What stands out, however, is the absence of any clear reversal signal so far. Selling pressure continues to dominate after each weak rebound, indicating the market may not yet be ready for a meaningful bullish move. That said, the presence of a prior swing low combined with dense volume makes this zone a strategic observation area.
The most prudent scenario at this point is to wait for a confirmed reaction at support—preferably in the form of reversal patterns such as a Bullish Engulfing, Fakey, or Pin Bar backed by volume confirmation. Only then will a short-term long setup offer a favourable risk-reward opportunity.
If price bounces, the first target would be around 3,350 USD—a previous resistance level and a likely zone for profit-taking. On the other hand, a decisive break below 3,280 USD would invalidate the recovery scenario and open the door to a deeper continuation of the downtrend.
In summary: This is a key watch zone—not the time to guess bottoms. Wait for confirmation, act with clarity, and always pair your setups with disciplined risk management.