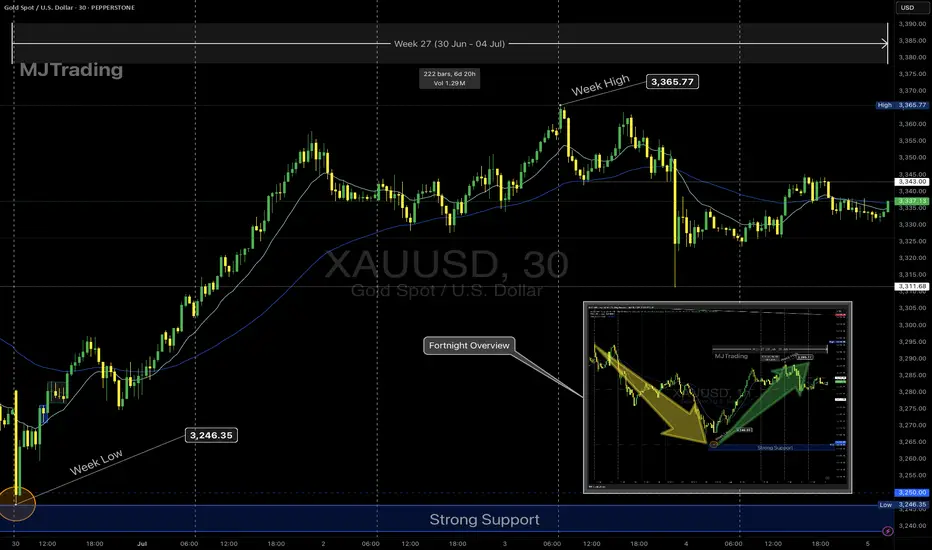
Gold Weekly Recap – Week 27 (30 Jun – 04 Jul)🟡 XAUUSD | MJTrading
Overview
Gold (XAUUSD) staged a significant recovery this week after retesting a critical support zone. Price action reflected strong buying interest at lower levels, followed by consolidation near mid-range resistance.
🔹 Key Levels:
Strong Support Zone: 3,246 – 3,250
Weekly Low: 3,246.35 (30 June)
Weekly High: 3,365.77 (3 July)
Closing Price: ~3,343
🔹 Price Action Summary:
✅ Early Week Retest & Reversal
After the prior week’s decline, gold opened the week near the major support area around 3,246. This zone acted as a strong demand pocket, triggering a swift rejection and initiating a bullish reversal.
✅ Sustained Rally to Resistance
Price climbed steadily, riding the 15-period EMA to reach the weekly high of 3,365.77 on 3 July. This move represented a nearly 4% recovery off the lows, fueled by renewed safe-haven flows and short covering.
✅ Midweek Consolidation
Following the rally, gold entered a sideways consolidation phase between 3,340 and 3,365. EMA flattening reflected a pause in momentum as traders assessed the next directional catalyst.
✅ Late-Week Pullback
Toward the end of the week, price tested the 3,310–3,320 area before modestly bouncing into the Friday close. Overall, the market maintained a cautiously bullish tone while holding above the prior support.
🔹 Technical Perspective:
🔸 Bias: Cautiously Bullish
Price defended the strong support and printed a higher low structure.
Sustained closes above 3,300 maintain the bullish outlook.
🔸 Near-Term Resistance:
3,365–3,390 remains the immediate supply zone to monitor for breakout attempts.
🔸 Key Support:
The 3,246–3,250 area continues to be the primary downside line in the sand.
🔹 Special Note – 4th July US Bank Holiday
Trading volumes were notably lighter on Thursday, 4th July, due to the US Independence Day holiday. This contributed to reduced liquidity and muted volatility, with many traders and institutions off desks. The thinner market conditions likely influenced the late-week pullback and consolidation, as participation was limited heading into the weekend.
🔹 Sentiment & Outlook
The decisive rebound from support suggests that buyers are defending value zones aggressively. However, failure to close the week above 3,365 leaves gold vulnerable to another retest of mid-range levels if fresh catalysts don’t emerge.
Traders should watch for:
A clean breakout above 3,365 to confirm continuation higher.
Any sustained weakness below 3,300 as a signal of fading bullish momentum.
🧭 Next Week’s Focus:
Monitoring whether the consolidation evolves into accumulation or distribution.
Watching for a breakout or deeper pullback
Reactions to upcoming economic data
EMA alignment: If the 15 EMA continues to track above the 60 EMA, it supports a bullish bias.
Chart Notes:
The main chart highlights this week’s action, while the inset provides a fortnight overview of the broader decline and recovery for context.
Thank you for your time and your support...
🚀🚀Boost it if you like it (Thanks)🚀🚀
#Gold #XAUUSD #GoldTrading #Forex #Commodities #TechnicalAnalysis #PriceAction #TradingRecap #MJTrading #GoldForecast #MarketReview #WeeklyRecap #TradingView
XAUUSDG trade ideas
Gold has a big win this dayNews: In the early Asian session on Thursday (July 10), spot gold fluctuated slightly higher, once regaining the 3320 mark, and is currently trading around $3323/ounce. On Wednesday, gold prices rebounded strongly after hitting a two-week low of 3282.61, closing at $3313.38/ounce, showing strong momentum for recovery. Trump extended the tariff agreement to August 1 and began to collect tariffs again. Although it eased market tensions, his remarks will not be extended after the expiration, and he issued tariff threats, which increased global trade uncertainty and pushed up risk aversion. The market is still facing economic and inflation concerns brought about by tariffs, which will also weaken the dollar and support gold prices.
Analysis of gold trend: After the full-day trend of gold on Wednesday, the lowest price was 3282 and the highest price was 3322, with a range of $40, so the bullish strength has come out. However, Li Siyu would like to emphasize here that gold is in a bullish trend for the time being, but it is not an absolute unilateral trend, but a fluctuating trend under the bullish trend. There are opportunities both up and down on Thursday. If it rises, you can look at 3345, and if it falls, you can look at 3285. Therefore, before there is an absolute strong unilateral rise, it is recommended that everyone keep looking at this wave of gold fluctuations. However, today's market is more important. Today is Thursday, and Thursday is often the node of the weekly change time. Today is likely to continue the rebound on Wednesday and continue to rise.
From a technical point of view, the daily line closed positive under the rebound of 3282 and stood firmly above the lower Bollinger track. If it continues to close positive on Thursday, it is necessary to pay attention to the suppression of the middle Bollinger track, that is, the high point of 3345. After breaking through, there will be another wave of rise on Friday, and you can see 3365 and 3400. Therefore, today's gains and losses of 3345 are crucial. The strong rebound in the H4 cycle is quite obvious. When it falls, it is very weak and continuous. When it rises, it is very strong and continuous. It depends on whether the continuous positive trend on Thursday will continue. Now the K-line stands firmly on the middle track of Bollinger. If it continues to rise, the high point of the upper track is around 3340-3345. In principle, the continuation of the long position will test the high point of the upper track. Therefore, it is still possible to go long today. Of course, it is not an absolute long trend now, so don't chase the rise. The support below the small cycle is around 3310-3300. If it falls back to this price, you can continue to go long. Clearly define the target. Today, we will see the gains and losses of 3345.
Start buying gold, a rebound may come at any time!Gold is undoubtedly weak at present, and bears have the upper hand. However, since gold touched the 3290-3280 area, gold bears have made more tentative moves, but have never really fallen below the 3290-3280 area, proving that as gold continues to fall, bears have become more cautious.
From the perspective of gold structure, multiple technical structural supports are concentrated in the 3285-3275 area, which makes it difficult for gold to fall below this area easily. After gold has failed to fall below this area, gold is expected to build a short-term bottom structure with the help of multiple supports in this area, thereby stimulating bulls to exert their strength and a rebound may come at any time.
Therefore, in the short term, I do not advocate chasing short gold; instead, I prefer to try to find the bottom and go long gold in the 3290-3280 area; but we should note that because gold is currently in an obvious short trend, we should appropriately reduce the expectation of gold rebound, so we can appropriately look at the rebound target: 3305-3315 area.
Happy 4th July everyone quick break downIn this video I break down the pairs im looking at this upcoming week. My thoughts of the market this previous week & what I was able to learn coming from a $1000 Lost

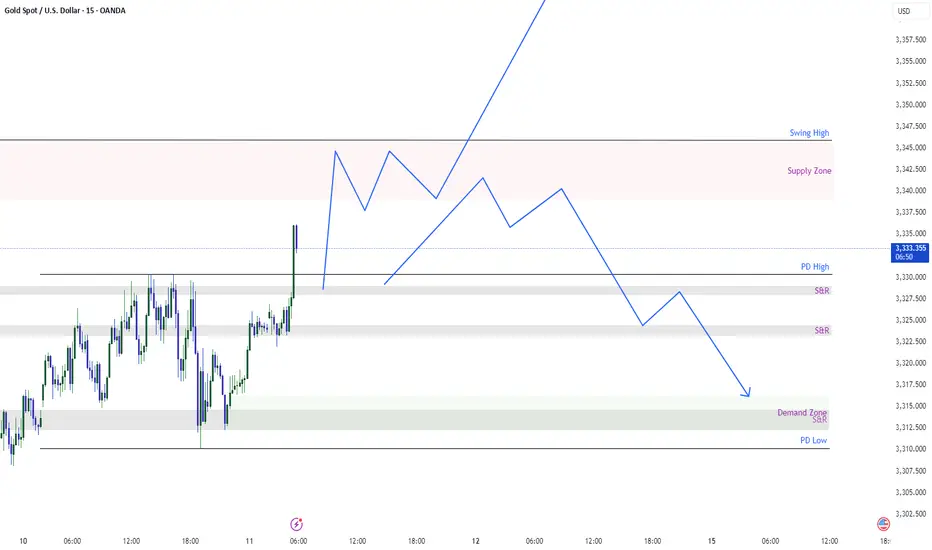
XAUUSD Possible MoveBuyers and Sellers remained in fight yesterday and finally buyers took the charge and today the gold has taken previous day high which was on 3330. It now can go to take the swing high which is residing on 3345. Or it may touch supply zone retraces back previous S&R level.
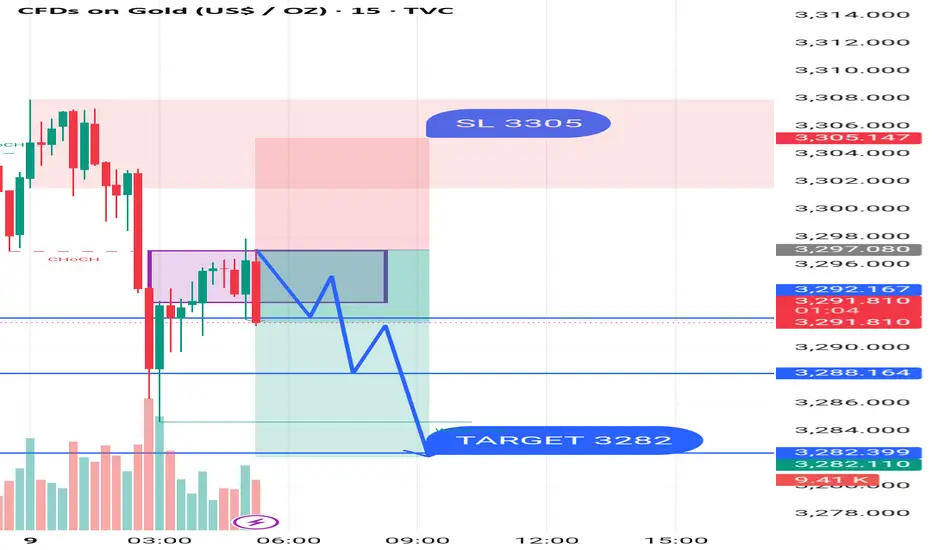
GOLD SELL M15Gold (XAU/USD) 15-Min Chart Analysis – July 9, 2025
The price is currently trading around the 3,295 level, after a recent Change of Character (CHoCH) and Break of Structure (BOS) indicating a shift from bullish to bearish momentum.
The market has formed a consolidation zone (highlighted in purple), suggesting a possible bearish continuation setup. Price is expected to retest the supply zone and then move lower.
Sell Setup Details:
Entry Zone: Inside the purple consolidation range (~3,295–3,297)
Stop Loss (SL): 3,305
Target (TP): 3,282
Key Support Levels:
3,292.16
3,288.16
3,282.39 (Main Target Zone)
This setup anticipates a bearish move after a rejection from the supply area, aiming for the liquidity zone near 3,282.
Long on monday morning 3363 then short on Monday Gold still in range bound except both option 1st long on monday 3363 then sell from. this area to 3277 zone then continue till liquidation 3233
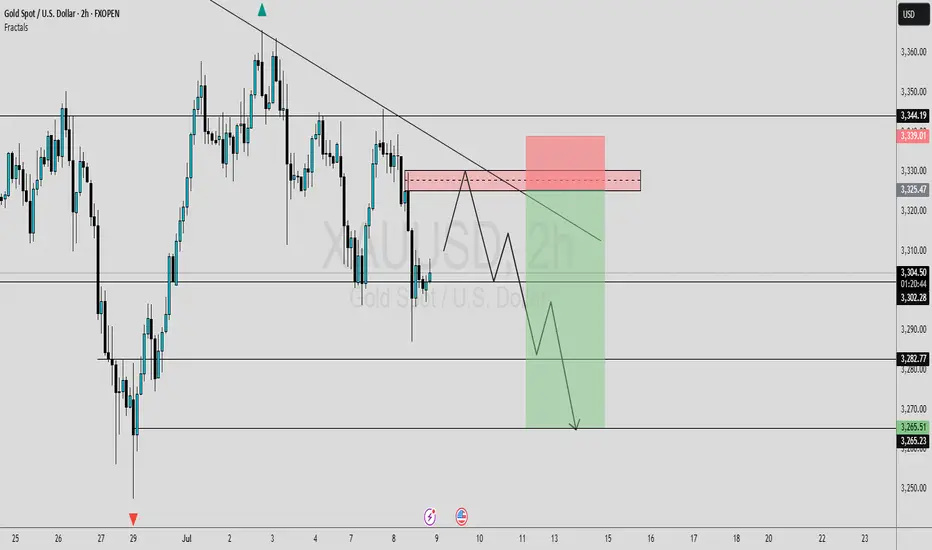
#GOLD UPDATESIn this analysis we're focusing on 2H timeframe for finding the upcoming changes in gold price.
Here we can see clearly that gold price creates trendline resistance and also price sweep all the SSL and pre. daily LQ sweep. Now I'm waiting for retracement, If price retest my supply zone and give bearish sign or reversal confirmation than we'll execute our trades. This is a higher time frame outlook. Further analyze more deeply into smaller time frame and place our position from an perfect point.
Always use stoploss for your trade.
Always use proper money management and proper risk to reward ratio.
Keep an eye on these levels. Confirmation is key.
#XAUUSD 2H Technical Analysis Expected Move.
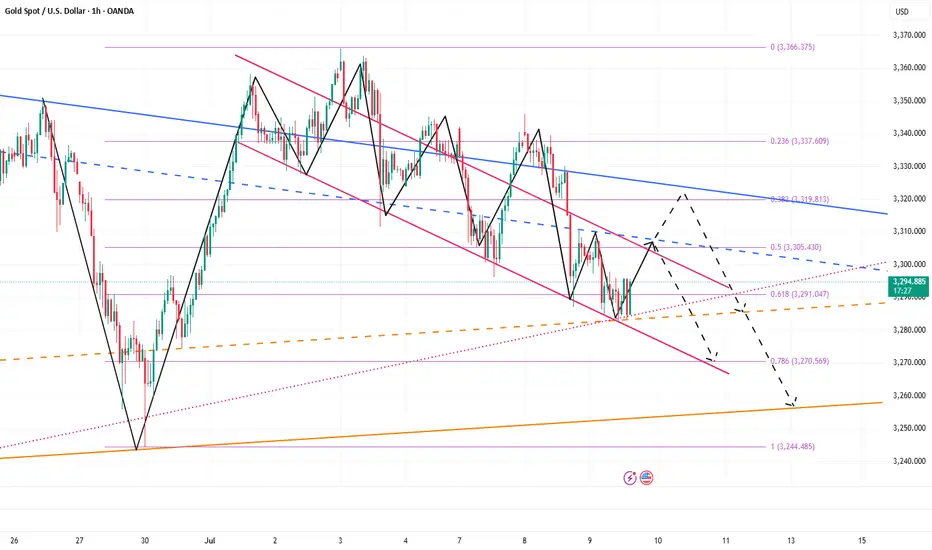
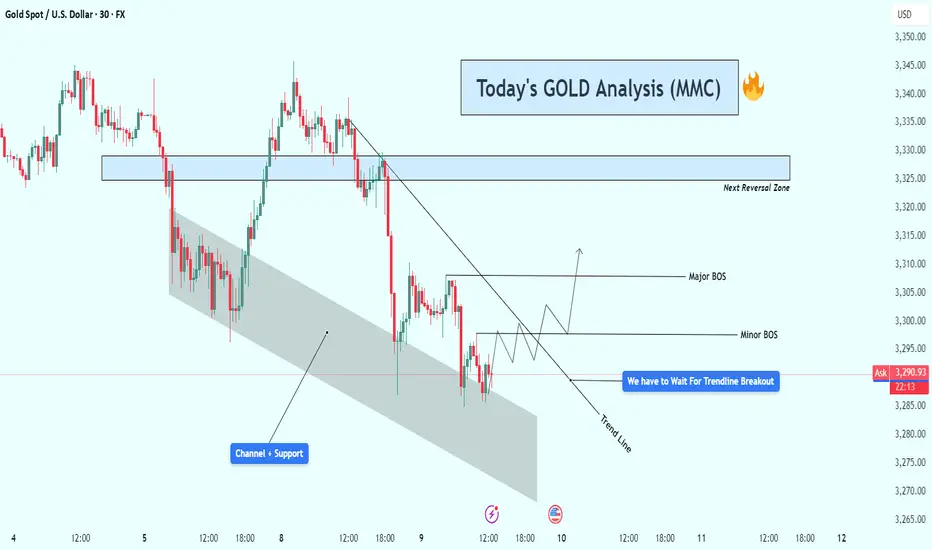
Gold (XAU/USD) Technical Analysis : Structural Analysis + TargetGold is currently trading near $3,292 on the 30-minute timeframe, showing classic signs of accumulation and compression within a well-respected descending channel. The current price action is approaching a critical decision zone, and the market is offering potential clues for both short-term and swing traders.
🔎 Detailed Breakdown of Chart Elements:
🔷 1. Descending Channel & Dynamic Support
Gold has been moving inside a falling channel, with price repeatedly reacting to both the upper and lower boundaries.
The lower boundary of the channel, currently acting as support, has been tested multiple times, suggesting a strong buying interest at this level.
This channel also aligns with the broader downtrend structure, giving sellers confidence while also creating interest for counter-trend buyers looking for reversal setups.
📐 2. Trendline Pressure and Compression
A downward sloping trendline, drawn from the recent swing highs, continues to apply bearish pressure.
Price is squeezing between the channel support and this descending trendline — a tight range compression, which often precedes a volatile breakout.
The analysis notes: “We have to wait for a trendline breakout” – this is a crucial technical signal that will determine the next move.
🚧 3. Break of Structure (BOS) Zones
Two potential bullish BOS (Break of Structure) levels have been identified:
Minor BOS (~$3,300):
A break above this level may signal short-term bullish intent and invalidate minor lower highs.
Early confirmation for buyers to enter with tight risk management.
Major BOS (~$3,310):
This is the key swing high which, if broken, would invalidate the current bearish structure and flip market sentiment bullish.
A strong bullish candle closing above this level could signal the start of a larger upward leg.
📍 4. Next Reversal Zone (Supply Area: $3,320 – $3,330)
This zone represents a strong supply area where previous price action saw heavy selling.
If bulls manage to clear the BOS zones, this area becomes the next target/resistance.
Price reaching this level could lead to a pullback, making it an ideal area for partial take-profits or reassessment of continuation trades.
📈 5. Scenario Planning & Strategy
✅ Bullish Bias (If Breakout Occurs):
Wait for a confirmed breakout above the trendline and Minor BOS with volume.
Ideal long entry would be on the retest of the trendline (now acting as support).
First target: Major BOS, then extend to the Reversal Zone.
Stop-loss can be placed below the channel support or latest swing low.
🚫 Bearish Continuation (If No Breakout):
If price fails to break above the trendline and continues to reject at resistance, sellers may look to short the retest of the trendline.
Targets can be set at the channel's lower boundary or previous lows.
Confirmation: Bearish engulfing patterns, rejection wicks, or divergence.
🧠 Technical Summary & Outlook
Gold is currently in a neutral to slightly bullish consolidation, showing early signs of demand at the bottom of the channel. The market is in "wait-and-watch" mode — traders should focus on the trendline breakout, which will serve as the trigger for directional bias.
The structure is clean, zones are well defined, and potential is high for both scalping and intraday setups. Traders are advised to stay patient and follow price action confirmation before entering trades.
📌 Key Levels to Watch:
Support Zone: $3,280 – $3,285 (Channel Base)
Trendline Resistance: ~$3,294–$3,296
Minor BOS: ~$3,300
Major BOS: ~$3,310
Reversal Zone (Supply): $3,320 – $3,330
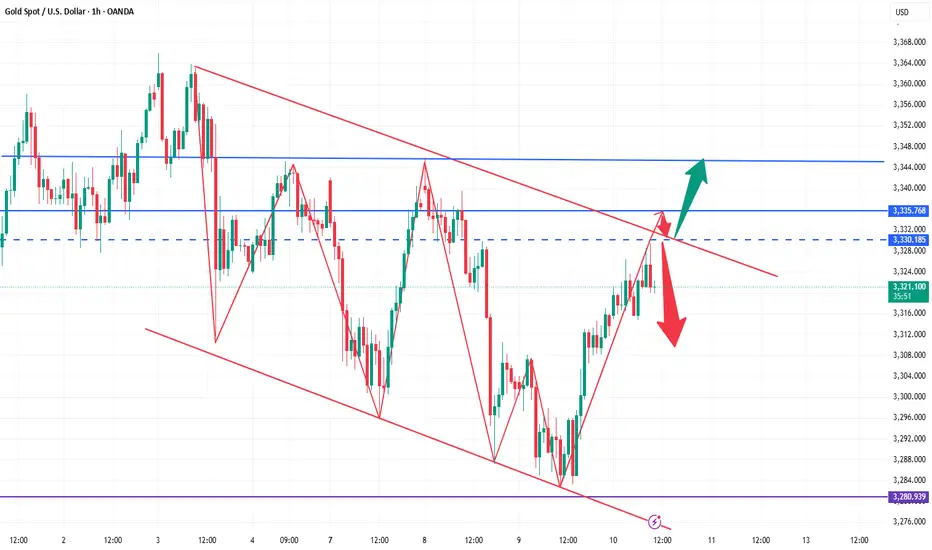
After repeated tug-of-war, where will gold go?At present, the gold market is divided between long and short positions. The Federal Reserve may maintain high interest rates, which weakens the investment appeal of gold; however, trade frictions and geopolitical risks provide safe-haven support for gold. Overall, market sentiment is mixed, with bulls lacking confidence, but bears have not been able to fully control the situation. Last week's strong non-farm data reduced market expectations for a rate cut in July, pushing up U.S. bond yields and the dollar, putting pressure on gold, which does not generate interest. In addition, Trump said on social media that he would impose a 10% tariff on countries that "support anti-U.S. policies." The market is waiting for the release of the minutes of the Fed's June meeting, which will more clearly show policymakers' views on the current economic situation and future policies, and may determine the direction of interest rates. If the minutes show that the Fed is inclined to maintain high interest rates for a longer period of time, gold prices may continue to face downward pressure.
From a technical perspective, gold was under pressure at a high level at the opening, so gold is expected to fall today. Today's key pressure level is 3345. Before the price effectively breaks through and stabilizes at 3345, any rebound is a short-selling opportunity; once it stabilizes at 3345, the bottom pattern is confirmed to be established, and the bulls will start an upward market. At this time, the short-selling idea should be abandoned. From a technical point of view, the 1-hour chart has shown a trend from weak to strong, and the Bollinger Bands are opening and diverging upward, indicating that the market may accelerate upward. Today's operation suggestion is to focus on low-long and high-short as a supplement. In terms of specific points, the lower support is 3327-3320, and the upper resistance is 3355-3360.
Operation strategy:
1. It is recommended to buy gold when it rebounds to around 3327-3320, with the target at 3340-3350.
2. It is recommended to sell gold when it rebounds to around 3345-3355, with the target at 3330-3320.
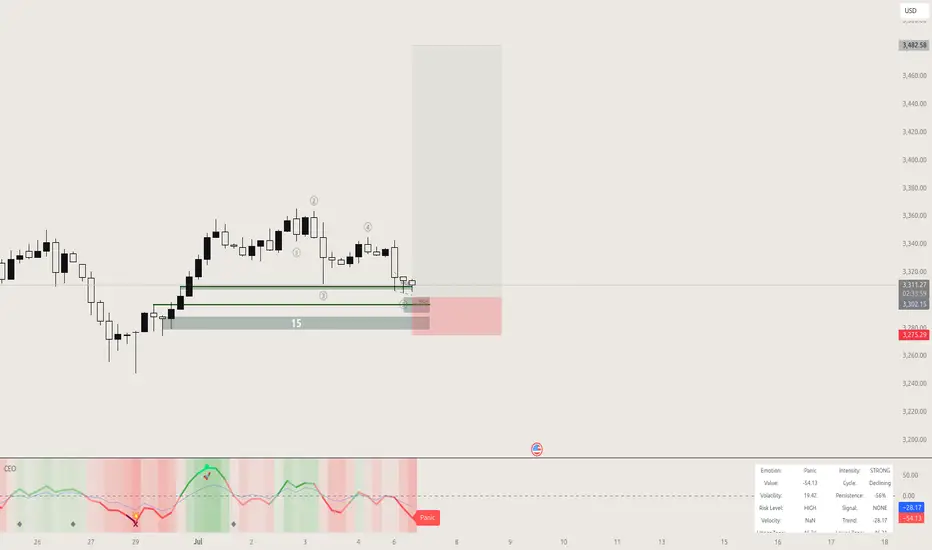
Gold new ATH soon?🟡 GOLD LONG SETUP: Buying the Fear at Key Support 📈
ICMARKETS:XAUUSD
"Be fearful when others are greedy, and greedy when others are fearful" - Warren Buffett
The oscillator we developed is showing some compelling signals on gold right now, and the market sentiment couldn't be more perfect for a contrarian play. 💎
Technical Analysis:
Our custom oscillator is painting a clear picture at the bottom - we're seeing those beautiful green zones emerging after extended red periods
Price action has found solid support around the 3,300 level, creating a strong foundation for the next leg up
The fear in the market is palpable, which historically has been an excellent buying opportunity for precious metals
Volume profile suggests accumulation is happening at these levels
Why This Setup Works: 🎯
The beauty of this oscillator lies in its ability to identify when institutional money starts flowing back into gold during periods of maximum pessimism. When retail traders are panicking and selling, smart money is quietly accumulating.
Key levels to watch:
• Support: 3,300 (current zone)
• First target: 3,350
• Extended target: 3,400+
Risk Management: ⚠️
• Stop loss below 3,275
• Position sizing: Never risk more than 2% of account
• Trail stops as momentum builds
The oscillator's fear signals have been remarkably accurate in identifying these reversal points. When fear reaches extremes, that's typically when the best opportunities present themselves.
This is not financial advice - always do your own research and manage risk appropriately.
What are your thoughts on this setup? Are you seeing similar signals on your charts? 🤔
#Gold #XAUUSD #TechnicalAnalysis #BuyTheFear #Oscillator
Gold shows signs of slowing down, are the bears ready?This wave of bullish pull-up is a complete rebound. With the help of the timeliness of fundamentals, the highest rebound only reached around 3330 and then began to fall. At this time, many people probably think that the short-term trend has begun to change. I still stick to my bearish thinking. The important target pressure is definitely around 3330. As long as this position is under pressure and falls back to 3280 again, it will be shaky. At present, the stop loss is based on the break of 3335. If it really breaks, it will be similar to the break of 3280. Even if 3340-3345 is short, it is also a short-term bull correction. If the falling channel is broken, I can't convince myself to continue to be short and stick to it. Once 3335 breaks, I can really confirm the reversal of the short-term trend. Then 3280 will also be the bottom of the medium term. In short, since I am shorting near 3320-3330 in the direction of the band and the short-term negative, I think that the stop loss will be given to 3335. The stop profit target is uncertain. The channel has not been broken. Now the short-term long and short conversions are frequent. It is definitely the best choice in my own trading system. No one will win all the time. It is too fake to win all the time. Make your moves according to your own ideas without regrets. If this wave of strategy verification fails, everyone is welcome to supervise. We dare to take responsibility and review every judgment.
GOLD SELL M15 Gold (XAU/USD) 15-Min Chart Analysis – July 11, 2025
Price is currently trading around 3346.94, after showing a Break of Structure (BOS) to the upside, reaching into a supply zone (highlighted in red). This area also marks a "Weak High", indicating potential for a bearish reversal.
Key Observations:
Supply Zone: Between approximately 3346 – 3353
Stop Loss (SL): Set at 3353
Entry: Anticipated from the top of the supply zone after rejection
Expected Move: Price is projected to drop after rejecting from the supply zone and form lower highs and lower lows.
Target Levels (Bearish Scenario):
1. First Support: 3342.17
2. Second Support: 3337.13
3. Main Target: 3332.13 (highlighted as "TARGET 3332")
This analysis anticipates a bearish move from the current level, based on price action and structure.

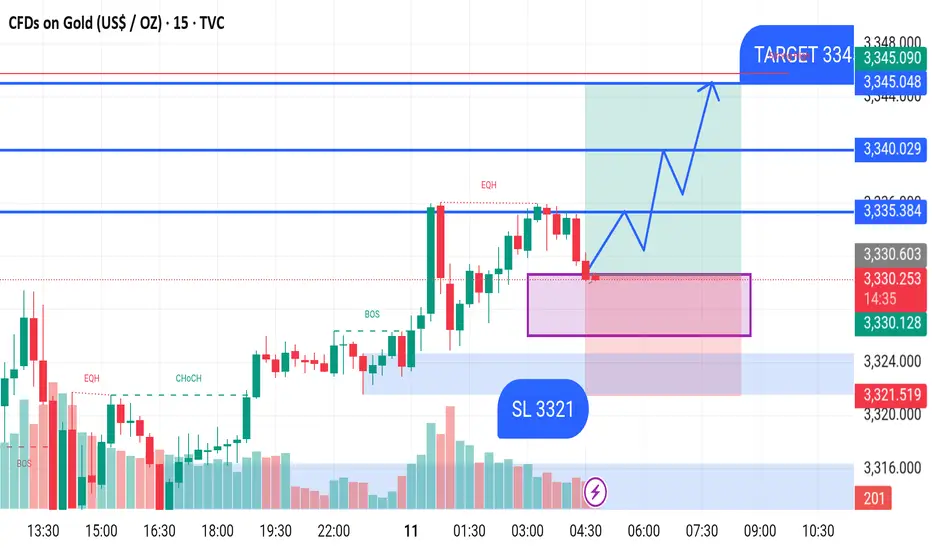
GOLD BUY M15 XAU/USD (Gold) 15-Min Chart Analysis – July 11, 2025
The chart shows a bullish setup forming after a Break of Structure (BOS) and Change of Character (CHoCH), indicating a potential shift in market sentiment from bearish to bullish.
Key Analysis:
Price Level: Currently trading around $3,331.
Support Zone: A demand zone is marked in purple around the $3,330 – $3,325 range.
SL (Stop Loss): Placed at $3,321 to protect against downside risk.
EQH (Equal Highs): Indicates liquidity buildup, hinting at a possible breakout above.
Entry Zone: A potential long entry is expected after a retest of the highlighted demand area.
Bullish Scenario:
After a successful retest of the demand zone, price is expected to push higher in waves.
Multiple targets are defined above current levels.
Targets:
1. First Target: $3,335
2. Second Target: $3,340
3. Final Target: $3,345
This setup suggests a strong buying opportunity with a favorable risk-reward ratio if the support zone holds.
7.11 Gold Analysis7.11 Gold Analysis
At present, the long and short forces are in a tug-of-war between three key factors:
1. Expectations of Fed rate cuts (core support)
Latest developments: Fed Governor Waller strongly called for a rate cut in July, but the market expects a rate cut in September with a probability of over 70% (CME data). The chairman of the San Francisco Fed expressed support for two rate cuts this year to ease inflation concerns.
Influence mechanism: Rate cuts will lower real interest rates and the US dollar exchange rate, significantly reducing the cost of holding gold. If subsequent CPI/PPI data are weak or the job market deteriorates, the rally may be triggered in advance.
2. Middle East geopolitical risks (pulse momentum)
Event escalation: The Israeli Defense Minister threatened to strike Iran again, and the risk of obstruction of Red Sea shipping increased.
Risk aversion logic: If the conflict breaks out in substance (such as an attack on oil facilities), it will trigger a safe-haven fund to flow into gold. At the same time, the surge in oil prices may push up global inflation and strengthen the anti-inflation properties of gold.
3. Trump's tariff policy (stagflation catalyst)
Policy impact: 50% tariff on Brazilian goods and imported copper (effective on August 1), triggering global supply chain disturbances.
Double effect: Pushing up the US dollar in the short term will suppress gold prices, but it may aggravate stagflation risks in the medium and long term, providing underlying support for gold.
Key contradiction conclusion:
The expectation of interest rate cuts is the cornerstone of gold's trend rise, and geopolitical and tariff risks provide breakthrough momentum. If the three resonate (such as escalation of conflicts + September interest rate cuts + tariffs push up inflation), gold prices may quickly hit above $3,400.
Technical multi-cycle analysis
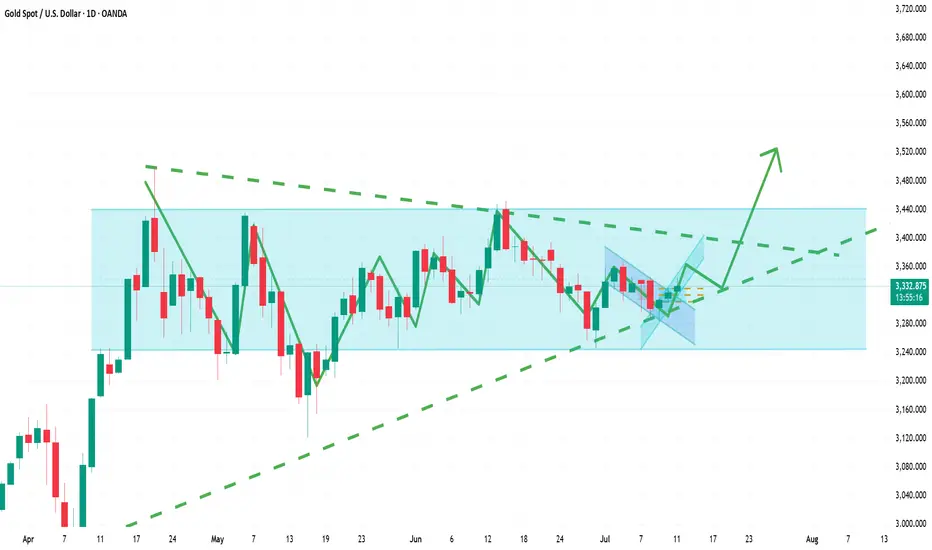
Daily level
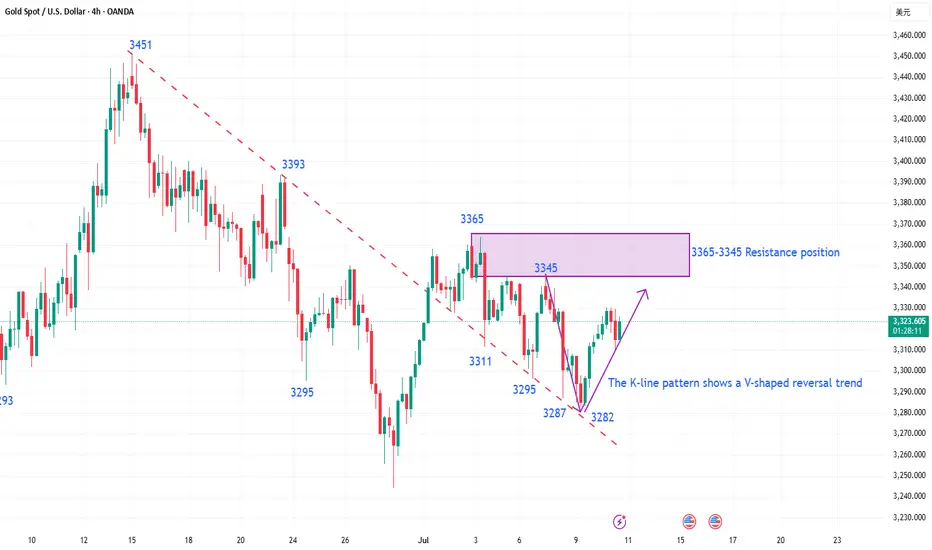
Pattern structure: Gold has fallen from the April high of $3,500, forming a triangular convergence pattern. After breaking through the previous high resistance of $3,346 and standing firm, it will enter the $3,350-3,374 oscillation box. MACD shows a golden cross signal, and RSI stands firm in the neutral zone of 55, indicating that bulls are accumulating power.
Key watershed:
Upward breakthrough point: $3374 (0.618 Fibonacci retracement level + previous daily high), after stabilization, it will open up the 3400-3420 space.
Downward risk point: $3330 (10-day moving average + triangle upper rail), if it fails, it may drop to 3310-3280 support.
Short cycle (4H/1H)
4-hour chart: The price runs in the rising channel (lower edge 3340/upper edge 3372), and the narrowing of the Bollinger Bands indicates that a breakthrough is imminent. Pay attention to the $3345 moving average support, and maintain the offensive if it holds.
1-hour chart: MACD top divergence repair is completed, and the high point of $3340 breaks through and stabilizes, which will trigger short-term follow-up buying.
Today's key events and trading windows
US June PPI annual rate: If the data is lower than the previous value of 2.2%, it will strengthen the logic of interest rate cuts and push up gold prices;
Federal Reserve Board member Waller's speech: Dovish remarks may become a catalyst for breaking through $3,346;
Israel Security Cabinet Meeting: Any signal of military action will trigger safe-haven buying.
Today's strategy
It is recommended to buy around 3,320, stop loss at 3,300. Target 3,340.
If my analysis can help you, I hope you can cheer me up.
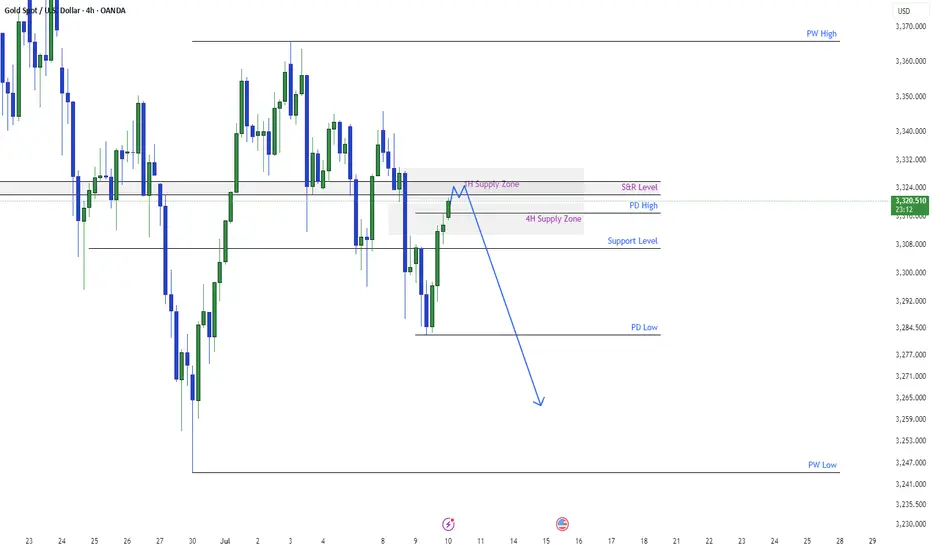
XAUUSD Reaching Supply ZoneXAUUSD is reaching a supply zone. There resides a good S&R level. We can expect gold to hit supply zone and follow the sell trend again. The strength of the gold is saying the same. The other possibility might be gold may break S&R level and go higher. Sellers are in stronger position and we may see higher probability percentage for sell.
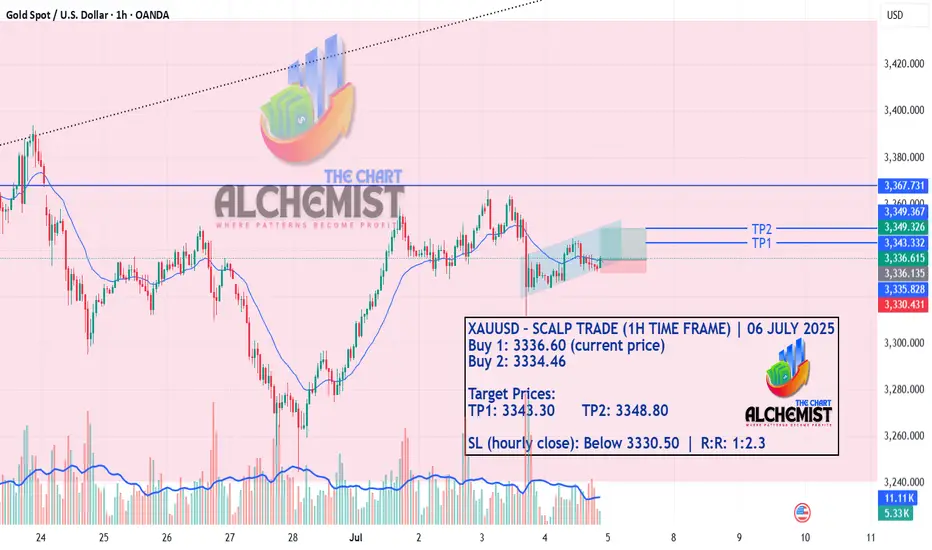
XAUUSD – SCALP TRADE (1H TIME FRAME)| 06 JULY 2025 - 2:30 PM GMTXAUUSD – SCALP TRADE (1H TIME FRAME) | 06 JULY 2025 - 2:30 PM GMT
On the higher time frames, XAUUSD is ranging inside a light pink channel. Zooming into the 1-hour chart, we see a change of character following a recent spike, then a sideways pullback forming a light blue channel. The current price action near the lower boundary hints at an intraday upward move toward the channel top.
This scalp trade setup offers a short-term opportunity with defined risk and moderate reward potential.
XAUUSD – SCALP TRADE (1H TIME FRAME) | 06 JULY 2025
Buy 1: 3336.60 (current price)
Buy 2: 3334.46
Target Prices:
TP1: 3343.30 TP2: 3348.80
SL (hourly close): Below 3330.50 | R:R: 1:2.3
📢 Disclaimer: Do not copy or redistribute signals without prior consent or proper credit to The Chart Alchemist (TCA).
✨ Kindly support our efforts by boosting and sharing this idea!
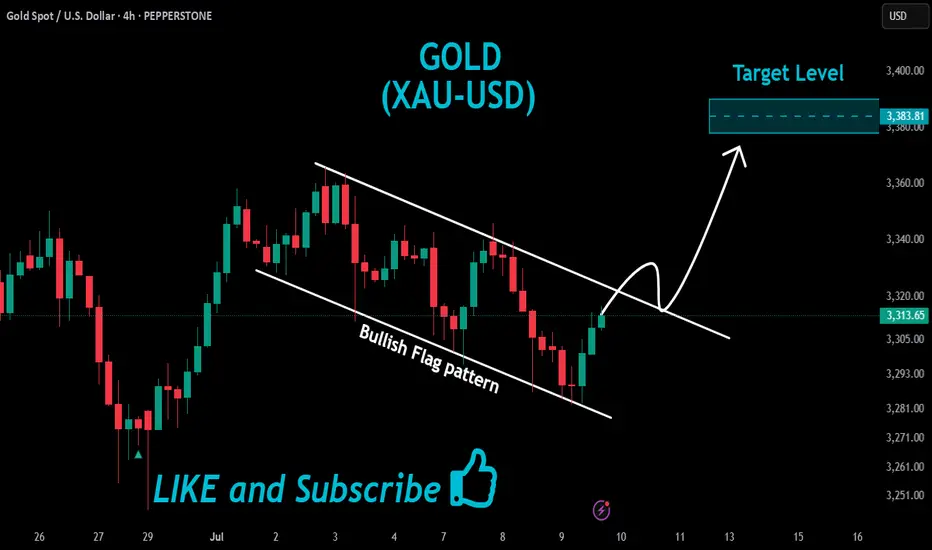
GOLD Wait For Breakout!
HI,Traders !
#GOLD has formed a Bullish Flag pattern
While trading in an uptrend As
we mentioned in a previous analysis
So we are bullish biased and
IF we see a bullish breakout
We will be expecting a
Further bullish move up !
Comment and subscribe to help us grow !
The intraday low has already appeared, so go long on gold boldlyGold unexpectedly fell sharply to around 3287. To be honest, the short position is relatively strong. However, since gold fell below 3000, we can clearly see that gold has shown strong resistance to falling during the decline, and the volatility tends to converge around 3287, proving that the buying support below is strong; and as gold continues to retreat, the off-market wait-and-see funds will be more willing to go long on gold; and some short positions will be more willing to go long on gold after profit taking;
In addition, although the short position is strong, it is difficult to continue in the short term. The intraday decline is basically in place. It is estimated that 3287 is the intraday low, so at this stage, it is inconvenient for us to continue to chase short gold. On the contrary, we can boldly go long on gold in the 3305-3295 area and look at the target area: 3320-3330.
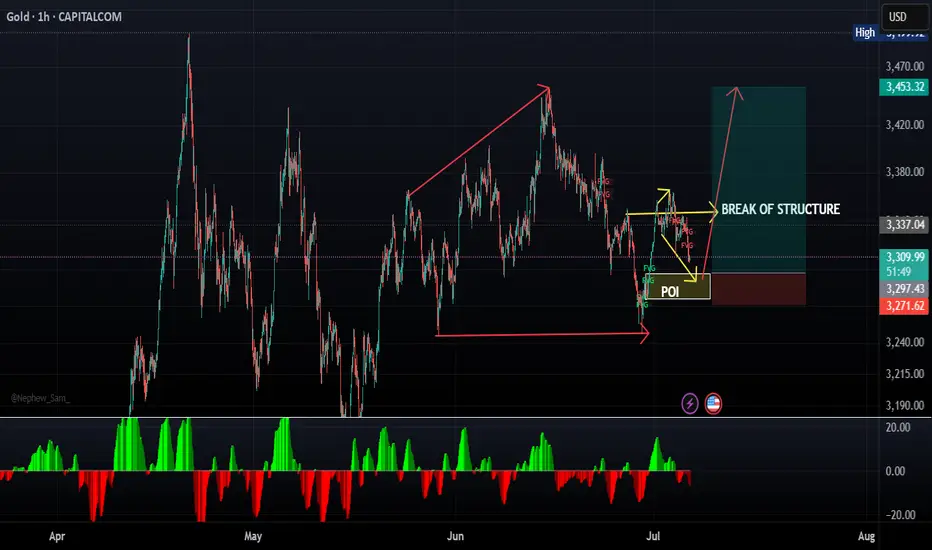
XAUUSD LONG/BUY 1:6RReason for buy
1. Break of structure
2. Corrective structure in play (Running flat)
3. Order block at 3299 levels (POI)
4. Impulsive wave up expected to complete the structure (Expanding flat)
Entry: 3299 (POI)
STOPLOSS: 3272
TAKE PROFIT:
1. 3372
2. 3408
3. 3460
4. 3500
Always use a STOPLOSS
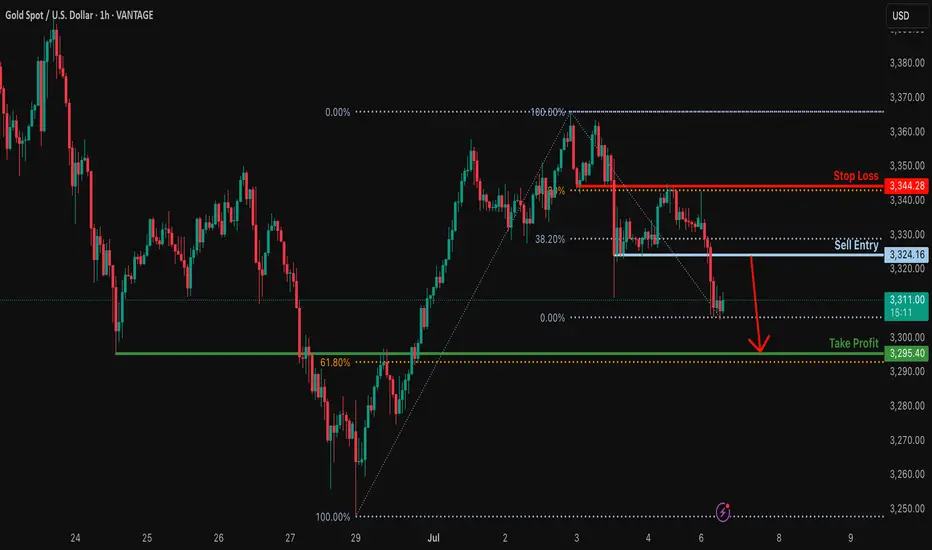
Bearish reversal off pullback resistance?XAU/USD is rising towards the resistance level which is a pullback resistance that is slightly below the 38.2% Fibonacci retracement and could drop from this level too ur take profit.
Entry: 3,324.16
Why we like it:
There is a pullback resistance level that is slightly below the38.2% Fibonacci retracement.
Stop loss: 3,344.28
Why we like it:
There is an overlap resistance level that aligns with the 61.8% Fibonacci retracement.
Takeprofit: 3,295.40
Why we like it:
There is a pullback support level that aligns with the 61.8% Fibonacci retracement.
Enjoying your TradingView experience? Review us!
Please be advised that the information presented on TradingView is provided to Vantage (‘Vantage Global Limited’, ‘we’) by a third-party provider (‘Everest Fortune Group’). Please be reminded that you are solely responsible for the trading decisions on your account. There is a very high degree of risk involved in trading. Any information and/or content is intended entirely for research, educational and informational purposes only and does not constitute investment or consultation advice or investment strategy. The information is not tailored to the investment needs of any specific person and therefore does not involve a consideration of any of the investment objectives, financial situation or needs of any viewer that may receive it. Kindly also note that past performance is not a reliable indicator of future results. Actual results may differ materially from those anticipated in forward-looking or past performance statements. We assume no liability as to the accuracy or completeness of any of the information and/or content provided herein and the Company cannot be held responsible for any omission, mistake nor for any loss or damage including without limitation to any loss of profit which may arise from reliance on any information supplied by Everest Fortune Group.
Gold Gaining Strong Bullish MomentumHello Traders,
Let's talk about Gold. Here is what I see for its next moves.
I use these tools to help me:
EMA (Exponential Moving Average)
Fib Ret. & Ext. (Fibonacci Retracement and Extension)
VWAP (Volume Weighted Average Price)
Volume Profile
RSI (Relative Strength Index)
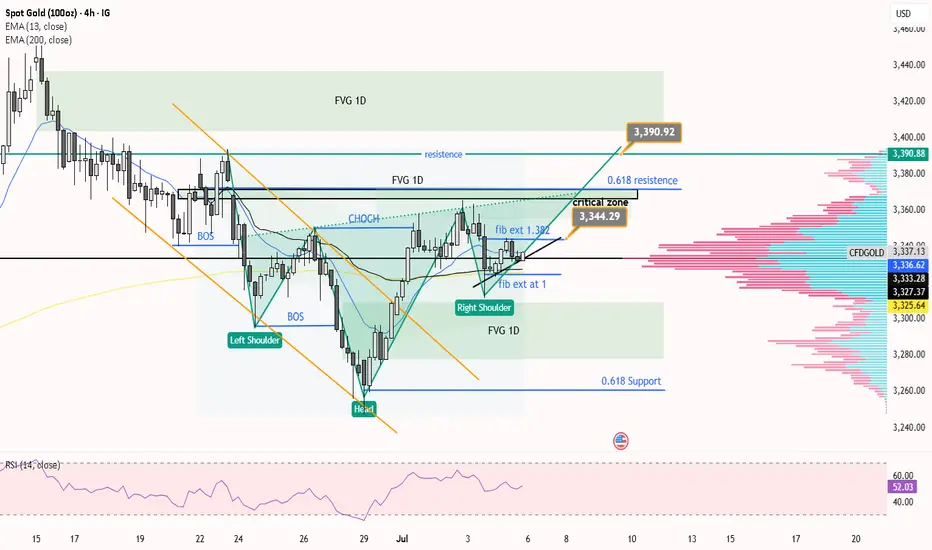
Looking at the big picture, it looks bullish for Gold. I see an inverse head and shoulders pattern forming. Also, the EMA and VWAP are below the price, which is a bullish sign. Gold also broke out of falling wedges and then moved back a little (a retracement), which is another bullish signal.
There is an important area I call the critical zone. This zone is between $3344 and $3364. It's important because it has a Fibonacci extension (between 2 and 1.618), a small FVG (Fair Value Gap) from the 1-day chart, and a resistance level from the 4-hour chart (at 0.618). This critical zone is important on both the 1-hour and 4-hour charts.
My idea is this: If the price of Gold goes above $3344, we can expect it to move higher into that critical zone, maybe up to $3364.
But, if you look very closely, there is also an ascending triangle pattern. This means we need to wait. It's best to wait until the price clearly breaks out (moves up strongly) or breaks down (moves down strongly) from this triangle before you open any trade.
Fundamental analysis:
FOMC Meeting Minutes (July 9):
Impact on Gold: Stronger (less rate cut chance) = Negative/Neutral for Gold. Weaker (more rate cut chance) = Positive for Gold. Volatility expected.
Trump's Tariff Deadline & Announcement (July 9 onwards):
Impact on Gold: New/higher tariffs = Strongly Positive for Gold (safe haven demand). This is the biggest risk/opportunity.
US Dollar ($) Trend:
Impact on Gold: US Dollar is downtrending = Positive for Gold.
US Bond Yields:
Impact on Gold: If yields fall = Positive for Gold. If yields stay high/rise = Neutral/Negative for Gold, but other factors (tariffs, central bank buying) might reduce this negative impact.
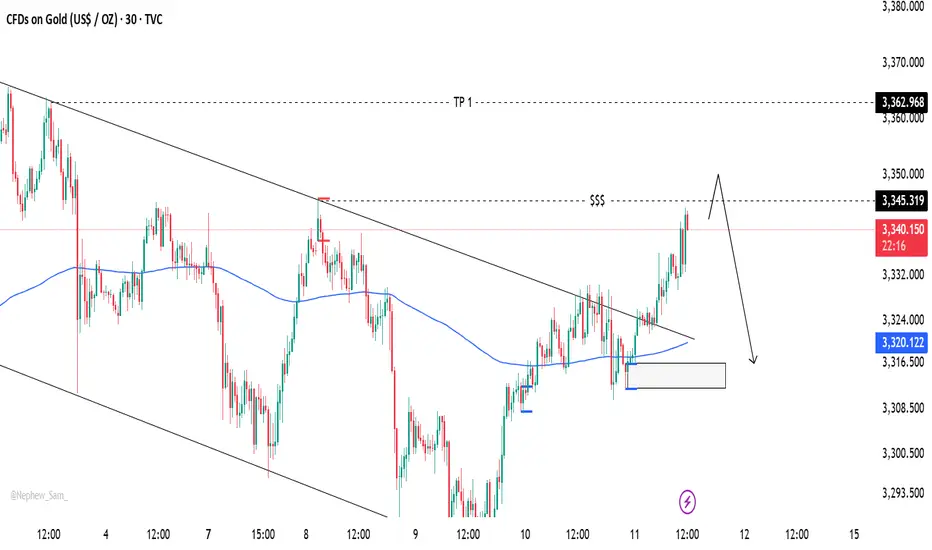
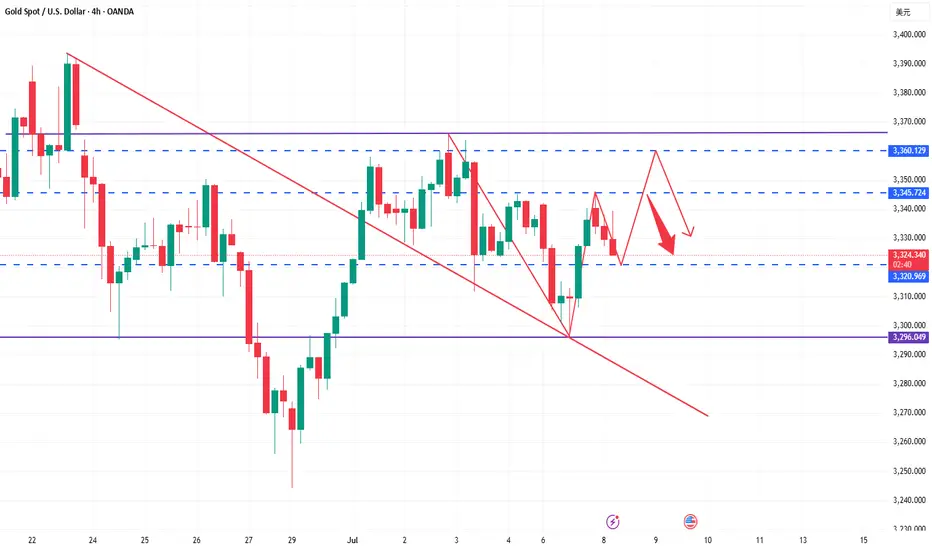
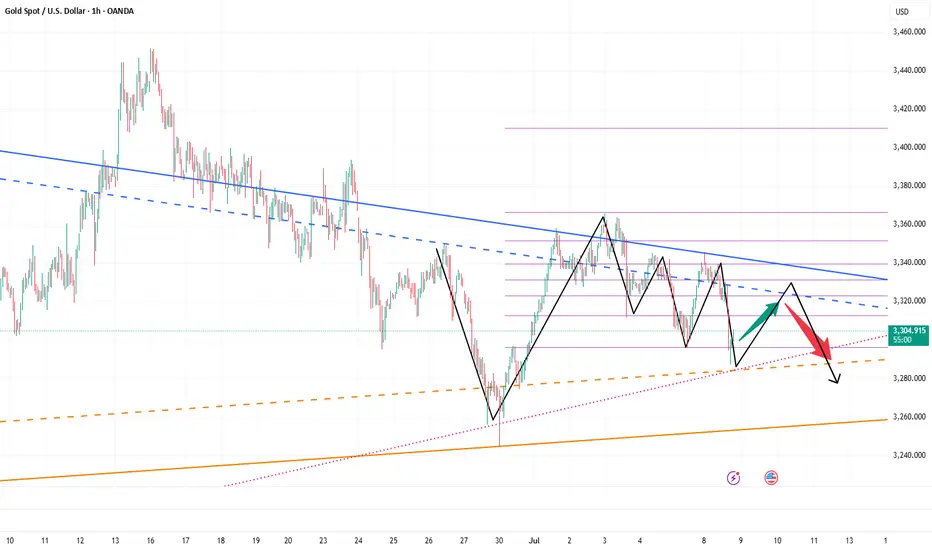
Gold’s Chart Update Next Move: Bullish or Bearish?Gold has shown strong bullish momentum 💪 as it breaks through the descending trendline 📉, positioning itself to target the upper liquidity zone 💰. Right now, we have two key scenarios to watch:
1️⃣ Bullish Scenario: If Gold breaks above the 3345 level and closes a solid candle above it 🔝, we could see a move towards 3360 🚀, signaling further upward potential.
2️⃣ Bearish Scenario: However, if Gold sweeps the 3345 zone and fails to maintain the bullish momentum 🔻, we may see a pullback that could push prices lower 📉.
Stay vigilant 👀 and keep an eye on price action for the next big move! 🔍📊