Gold longsTVC:GOLD price is approaching a support level forming a H&S Patten, giving us an insight that bulls are most likely to take over pro price. What are your predictions traders? Let me know on the comment session.
XAUUSDG trade ideas
Gold Analysis and Trading Strategy | July 10✅ Fundamental Analysis:
🔹 U.S. President Trump announced a 50% punitive tariff on Brazil starting August 1st, escalating global trade tensions and increasing risk premiums, thereby boosting safe-haven demand for gold.
🔹 The EU is accelerating trade talks with the U.S., but disagreements over the 25% tariff and quota mechanism raise uncertainty, which supports gold prices.
🔹 The Fed’s June meeting minutes show most officials oppose a rate cut in July, citing concerns that tariffs could raise inflation. However, markets still expect a 50bps rate cut in September.
🔹 Trump’s continued pressure on the Fed to cut rates, coupled with the Fed’s internal divisions, has heightened policy uncertainty and amplified gold’s volatility.
🔹 Tensions in the Middle East remain elevated, with the U.S. imposing additional sanctions on Iran. Geopolitical risks continue to fuel safe-haven flows into gold.
✅ Technical Analysis:
🔸 The 4-hour chart shows gold rebounding sharply after a pullback, forming a "zigzag correction" pattern characterized by a choppy retracement followed by a corrective rally and renewed pressure.
🔸 After retreating from the 3365 high to 3345, gold has established a descending channel. The upper boundary of this downtrend channel, which now acts as resistance, has shifted down to the 3328–3330 zone, which is also the key resistance during the Asian and European sessions today.
🔸 The market remains in a consolidation phase. The initial test of the 3328–3330 resistance zone during the Asian session is likely to be rejected. While gold is still in a rebound phase, it is not advisable to rush into short positions—instead, closely monitor how price reacts at this resistance area.
🔸 If gold fails to break and hold above 3328–3330, it should still be regarded as a rebound within a downtrend. However, if gold successfully breaks and stabilizes above this level, a bullish reversal may be underway. The next level to watch is 3345, which is a key inflection point between bullish and bearish sentiment. A firm break above this level would alter the current weak technical structure.
🔸 On the 1-hour chart, the moving averages remain bearishly aligned, with no signs of turning up yet, suggesting that the bullish momentum is still weak. Therefore, the short-term strategy remains to sell on rallies and buy on dips.
✅ Key Intraday Levels:
🔴 Resistance Levels: 3328–3330 (descending trendline resistance). If broken, target 3345.
🟢 Support Levels: 3282–3280 (strong support area). If breached, watch for further downside toward 3245.
✅ Intraday Trading Strategy:
🔰 If gold breaks and holds above 3328–3330, consider light long positions, with targets around 3345. Stop loss around 3315.
🔰 If 3328–3330 acts as resistance and price reverses, consider light short positions, with initial support at 3307. If this level is broken, the next targets are 3297–3280.
🔰 During the European and U.S. sessions, gold may rise initially and fall later. Without further fundamental catalysts, gold could retreat back toward the 3300 psychological level after testing resistance.
🔥 Reminder: Trading strategies are time-sensitive and should be adjusted in real time based on market conditions, especially after key support or resistance levels are broken. If you need more accurate and timely trading signals, feel free to reach out to me directly!
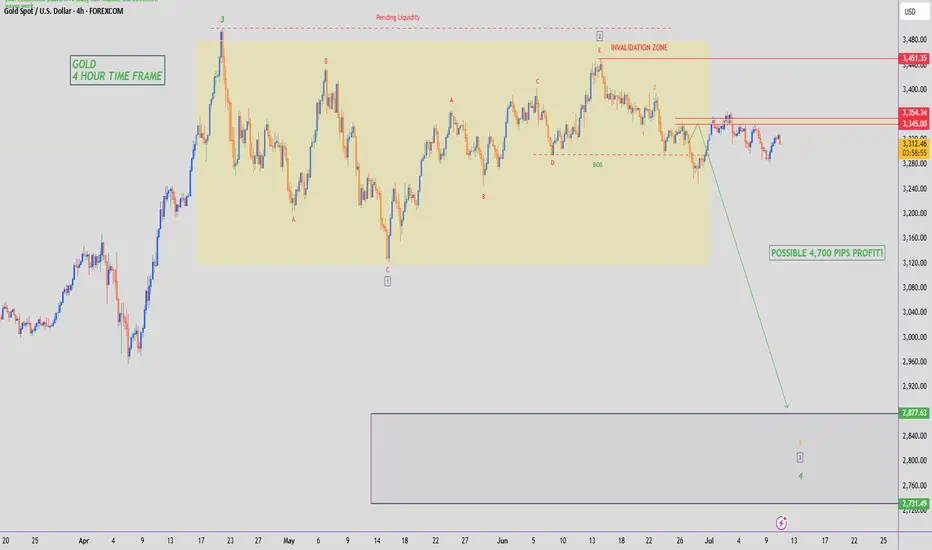
GOLD - SHORT TO $2,800 (UPDATE)I know this constant whipsaw price action on Gold, of seeing it move up & down it testing a lot of peoples patience & liquidating short term buyers & sellers who keep buying at this level with no real trading plan.
But that is how I know the market is doing its job. Flushing out the weak, retail market traders before making its big move.
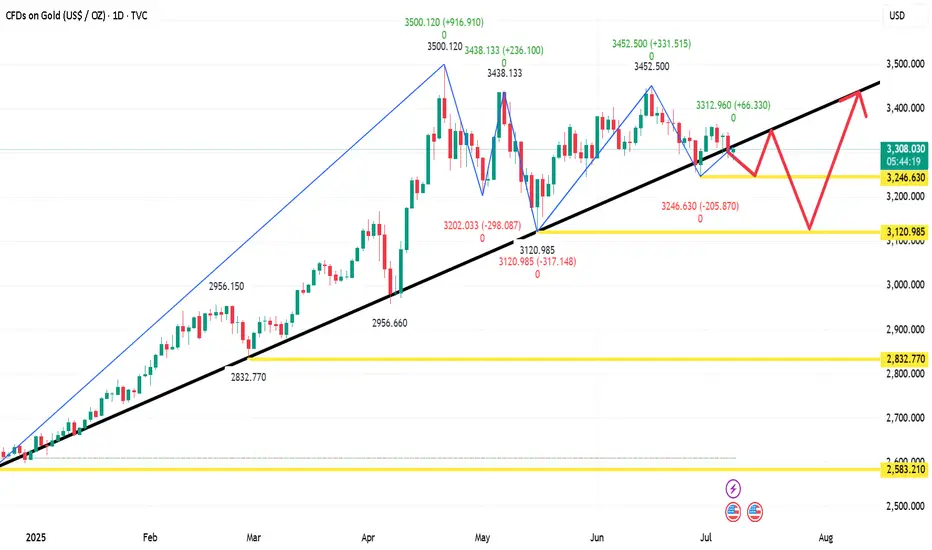
Technical analysis guide for gold in the US market!Technical aspects:
The gold daily chart shows an obvious shock consolidation structure, and is currently running between the middle and lower tracks of the Bollinger Bands, with an overall weak trend. Since hitting a high of $3499.83, the market has fallen into a sideways consolidation range, with top resistance concentrated in the $3400-3450 range and bottom support at $3250. The recent price retracement to around 3250 failed to effectively break below, forming an important support level.
The MACD indicator crossover continues, the green column is enlarged, the double lines are downward, and the momentum is weak. The RSI indicator runs around 44, and does not show oversold or rebound signals. The price is still in a weak consolidation stage. Analysts believe that if it falls below the 3250 line, it may open up further correction space, and pay attention to the 3170 area support; on the upside, if it can effectively stand above 3400, it is expected to retest the 3450 line high.
Report - 9 jully, 2025Macro & Geopolitical Overview
Trump’s Tariff Threats vs Market Optimism
Despite President Trump’s insistence that sweeping tariffs will start August 1 (with no extensions), markets have demonstrated remarkable resilience. Wall Street appears to view these threats as a continuation of negotiation tactics rather than fixed policy.
The S&P 500 is up ~6% YTD, trading close to record highs, underpinned by robust corporate fundamentals and expectations of looser monetary policy.
Banks including Goldman Sachs, Bank of America, JPMorgan, Deutsche Bank, Citigroup, and Barclays have raised their S&P 500 forecasts, projecting additional 6–11% upside over the next 12 months.
Treasury Secretary Scott Bessent claims tariffs could yield $300bn in revenue this year, with $100bn already collected.
Market Read: Consensus suggests that repeated tariff postponements have desensitized investors, with strategists highlighting the continued strength in mega-cap tech and broader earnings momentum as outweighing trade policy risks.
EU Seeks Temporary Trade Deal
The EU is negotiating a provisional deal to maintain tariffs at 10% and avoid full-scale retaliation. German finance officials have warned of potential countermeasures if no fair resolution is reached.
Implications: A temporary truce could reduce volatility in European equities and alleviate pressure on the euro. Eurozone markets already showed optimism, with the Stoxx 600 up 0.3% and DAX and CAC 40 both gaining 0.6%.
Ukraine’s Financing Strains Intensify
The EU is urgently seeking to fill Ukraine’s projected $19bn budget gap for 2025 as ceasefire prospects diminish. Options under discussion include front-loading loans from G7 support packages and leveraging frozen Russian assets.
Trump’s promise to resume defensive arms deliveries provides a partial relief but does not fully address fiscal shortfalls.
EU leadership aims to finalize support plans before winter to ensure operational stability in Ukraine’s defense and civil services.
Strategic View: Ukraine’s funding gap underscores ongoing geopolitical risk in Eastern Europe, which could impact energy markets, defense equities, and the euro.
Port of Rotterdam Defense Preparations
Europe’s largest port is preparing for potential conflict with Russia by designating military cargo spaces and coordinating with Antwerp. This forms part of an EU-wide rearmament and strategic stockpiling effort.
Proposals include stockpiling critical raw materials (copper, lithium, graphite) and essential supplies.
Supports broader EU resilience efforts to reduce dependency on imports from China and Russia.
Implications: Reinforces the structural bullish thesis on critical raw materials and European defense contractors.
Corporate & Sector Updates
Wall Street Earnings Sentiment Turning Positive
Despite tariff noise, optimism around earnings season is rising.
Big banks expect solid Q2 results supported by labor market strength and easing inflation trends.
Analysts highlight that U.S. corporates have maintained guidance despite higher input costs.
Investment Implication: Reinforces overweight positioning in U.S. large caps, especially in tech and industrials with strong balance sheets.
Former UK PM Sunak Joins Goldman Sachs
Rishi Sunak rejoining Goldman Sachs as senior adviser highlights geopolitical expertise premium at major financial institutions.
Expected to advise on economic and geopolitical strategy while maintaining parliamentary role.
His compensation will support charitable projects, minimizing domestic political fallout.
BCG’s Gaza Fallout
BCG’s involvement in controversial Gaza post-war relocation plans has led Save the Children to cut ties after 20 years, severely damaging the firm's reputation.
Implications: Could impact BCG’s client relationships and broader consulting industry reputational risks, especially in ESG-conscious markets.
BP and Shell Return to Libya
BP and Shell have signed MoUs to explore and redevelop major Libyan oil fields, signaling re-engagement despite ongoing political instability.
Libya aims to raise output from 1.3m to 2m b/d.
These moves underscore Western energy majors' renewed focus on fossil fuels amid investor pressure for returns.
Investment View: Supports medium-term oil production growth; bullish for European oil majors despite ESG headwinds.
Asia & EM Updates
China’s Overcapacity and Deflation Concerns
China criticized local firms and governments for excessive price competition (neijuan), which has entrenched factory gate deflation for 33 consecutive months.
Beijing is signaling potential “supply-side reforms” to manage capacity and stabilize prices.
Overcapacity concerns extend to green sectors (solar, EVs), threatening global price dynamics.
Implications: May support global industrial metals prices if successful. However, near-term risks for global trade tensions remain elevated.
Southeast Asia Tariff Wall
Trump threatens 25–40% tariffs on Cambodia, Indonesia, Laos, Malaysia, and Thailand to counter Chinese transshipment practices.
Vietnam accepted a 20% base tariff, rising to 40% for transshipped goods.
Analysts predict higher production costs and consumer prices, potentially slowing ASEAN manufacturing relocation trends.
Strategic View: Increases risk premium on regional supply chains and may provide a tailwind for nearshoring/U.S. manufacturing.
Brics Pushback and De-dollarization Drive
Brics leaders sharply criticized Trump’s new 10% "anti-Brics" tariff threat. The bloc reaffirmed its commitment to reduce USD dependence and reform global financial governance structures.
Market Lens: Accelerated shift toward local currency trade settlements could support alternative reserve currencies and precious metals.
Alternative Assets and Innovation
Tokenized Treasury Funds Surge
Crypto traders and institutions are pivoting to tokenized Treasury and money market funds (assets up 80% YTD to $7.4bn) as an alternative to stablecoins.
Advantages: yield generation, rapid blockchain-based settlement, and new collateral options.
BlackRock, Franklin Templeton, and Janus Henderson products seeing robust inflows.
Implications: Bullish for blockchain infrastructure and tokenization service providers. Early-stage adoption curve but strong growth potential.
Sector Themes
Private Equity (PE): U.S. public universities are increasing PE allocations (targeting up to 30%) despite valuation and exit risks. Signals belief in long-term outperformance vs. muted public equity expectations.
Agriculture & EU Budget: CAP subsidies to farmers remain protected despite budget consolidation, driven by strong lobbying. Confirms ongoing policy support for European agricultural income stability.
Energy Transition & Defense: EU budget and port strategies reflect dual focus on green resilience and military preparedness, providing structural support to both ESG and defense-linked investments.
Markets Summary & Outlook
S&P 500 +6% Near all-time highs, supported by earnings optimism.
Euro Stoxx 600 +0.3% EU trade optimism offsetting geopolitical tensions.
DAX +0.6% Strong industrials rebound; trade negotiations key.
FTSE 100 +0.5% Supported by commodity strength and oil majors.
Dollar Index: +0.2%, moderate safe haven demand.
US 10Y yield: ~4.63%, reflecting ongoing macro uncertainty and strong U.S. data.
Gold: Supported by Brics de-dollarization narrative and geopolitical hedging.
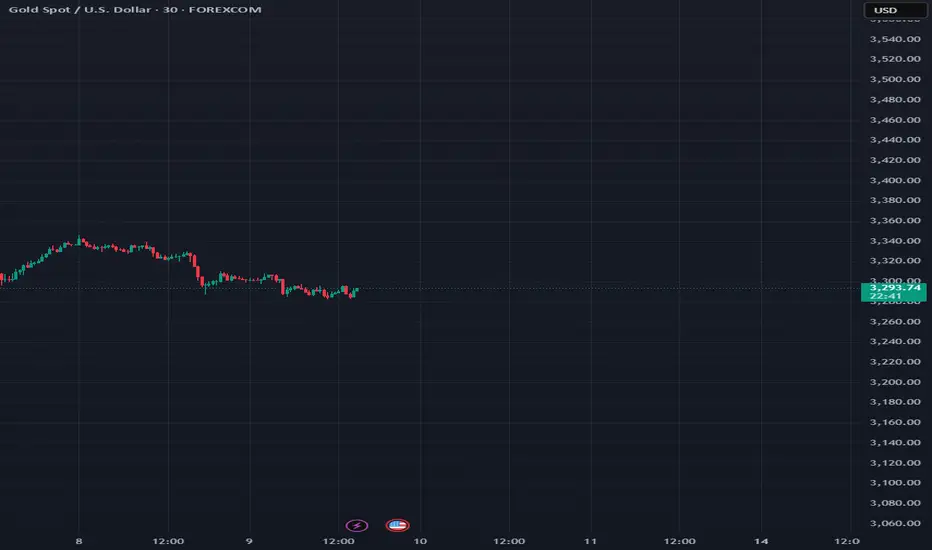
Data is about to be released. Where will gold go?Yesterday, the market expected a trade agreement between the United States and its trading partners, which boosted risk sentiment, and the strengthening of the US dollar and the rise in US bond yields further added pressure on gold prices. Gold fell 1% during the day and once lost the $3,300 mark during the session.
After gold bottomed out and stabilized at 3,320 on Monday, it fell sharply above 3,320 again on Tuesday and has now completely fallen below 3,320. The position of 3,320 is very important. In the 3,320-50 range, it chose to break down at 3,320 again.
Today, the Federal Open Market Committee of the United States will release the minutes of the June monetary policy meeting. Although Federal Reserve Chairman Powell remained neutral on the June interest rate decision, many Federal Reserve officials released dovish signals. Federal Reserve Board member Bowerman has turned to support the possibility of a rate cut in July.
From a technical point of view, the market has penetrated into the area around the lower support of 3,275-3,295.
The rhythm of the entire market is still a process of oscillating decline. From the perspective of pressure position, the daily MA5 average line has not fallen below, and may fall again to around 3270. Once the market falls too fast and approaches this position, there is a high probability that there will be a rebound demand.
Operation strategy:
Buy near 3375, stop loss at 3365, profit range 3315-3320.
Continue to hold position after breakthrough.
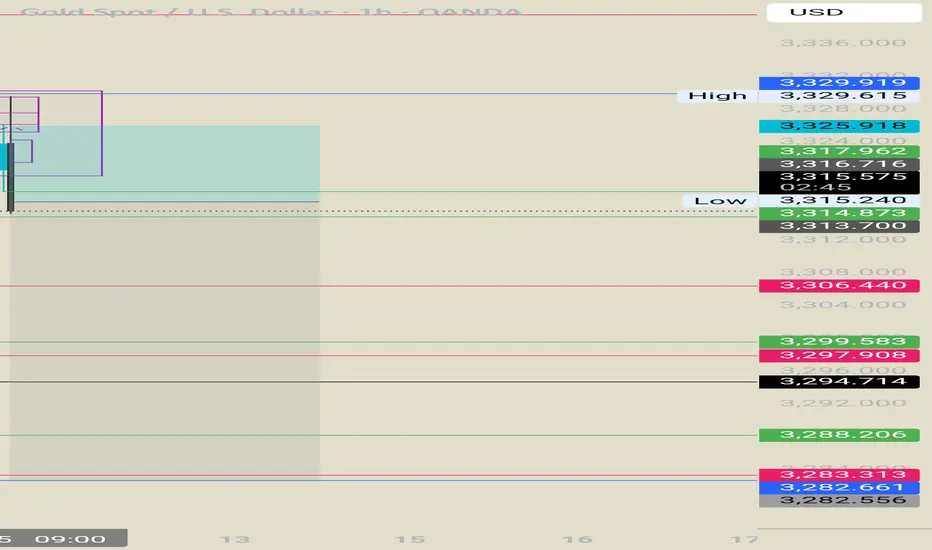
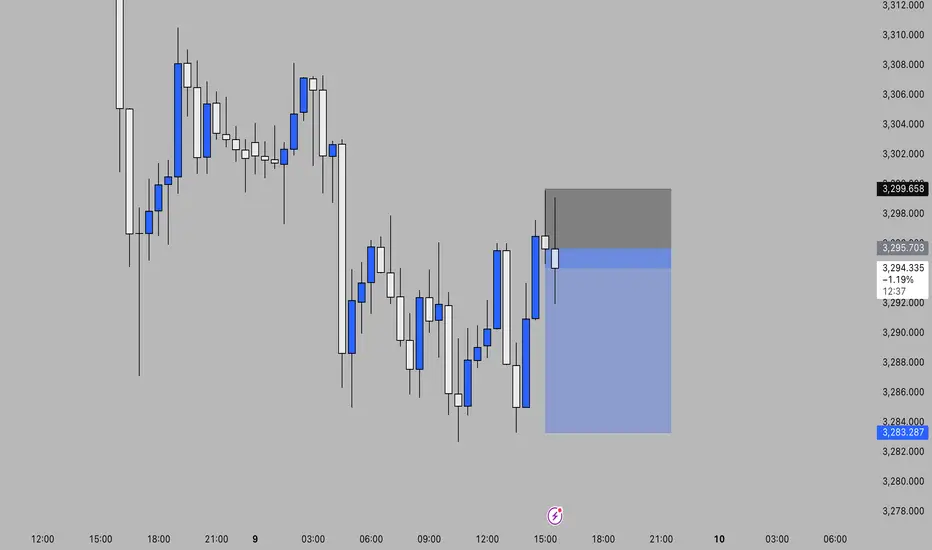
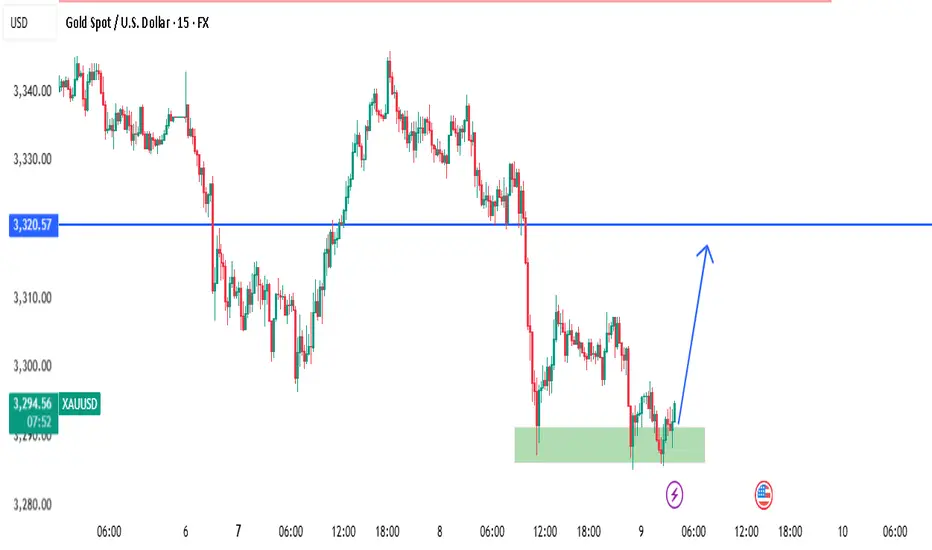
XAUUSD 15Min – Bullish Reaction from Demand Zone | SMC AnalysisSmart Money Concept (SMC) Analysis
Price has tapped into a clearly defined 4H Demand Zone (highlighted in green) with multiple rejections. Prior liquidity was swept below the 3288 region, trapping early sellers and grabbing institutional interest. This is a classic liquidity grab + demand zone confluence.
🔹 Entry: 3290 – Inside Demand Zone
🔹 SL: 3282 – Below Liquidity Sweep
🔹 TP: 3320 – Targeting Last Broken Structure (Break of Structure)
🧠 Smart Money Clues:
Liquidity grab under the lows ✅
Clean rejection wick ✅
BOS (Break of Structure) above needed for confirmation
Anticipating move back to 3320.57 (blue line) – previous SMC mitigation level
🟢 If price breaks above 3300 with strong volume, more upside is likely.
#XAUUSD #GoldAnalysis #SmartMoney #SMC #DemandZone #LiquidityGrab #TradingView #ForexSignals
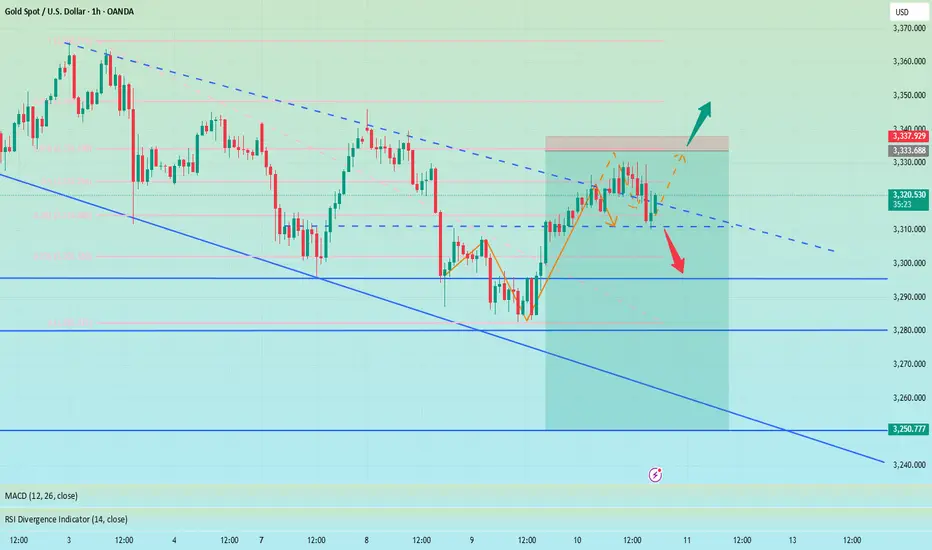
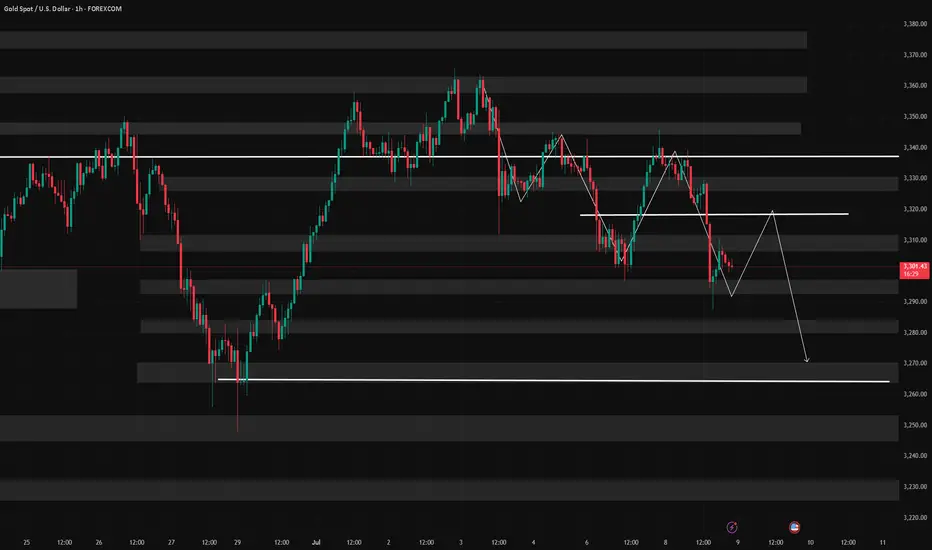
July 9, 2025 - XAUUSD GOLD Analysis and Potential OpportunityAnalysis:
Gold is currently in a choppy downtrend. Watch the 3300 level closely — if price holds above it, bulls may still have strength.
However, if it breaks below 3297, bearish momentum is likely to accelerate.
🔍 Key Levels to Watch:
• 3365 – Resistance
• 3350 – Resistance
• 3345 – Intraday key resistance
• 3330–3333 – Intraday key support zone
• 3322 – Short-term resistance
• 3310 – Resistance
• 3300 – Psychological level
• 3295 – Key support
• 3285 – Support
• 3275 – Support
📈 Intraday Strategy:
• SELL if price breaks below 3300 → watch 3295, then 3287, 3282, 3275
• BUY if price holds above 3310 → watch 3315, then 3322, 3330, 3337
👉 If you want to know how I time entries and set stop-losses, hit the like button so I know there’s interest — I may publish a detailed post by the weekend if support continues!
Disclaimer: This is my personal opinion, not financial advice. Always trade with caution and manage your risk.
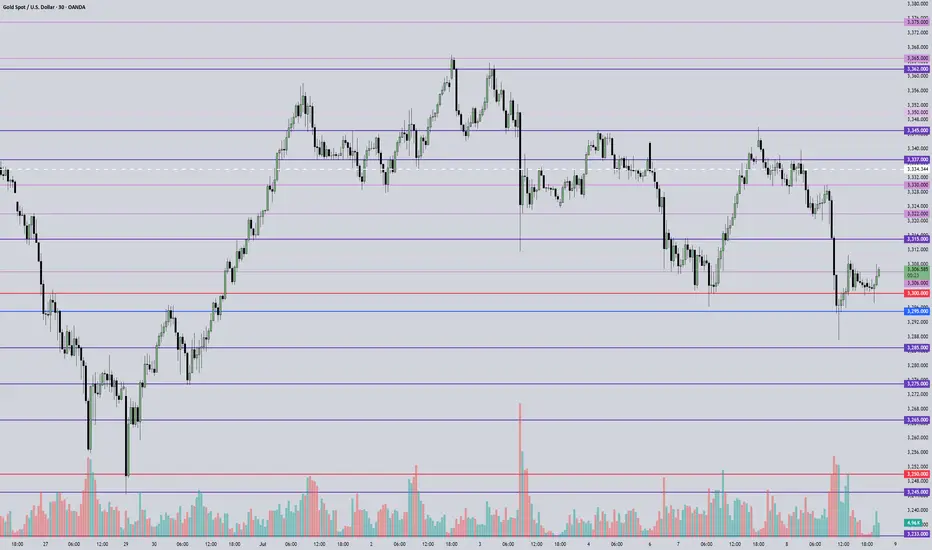
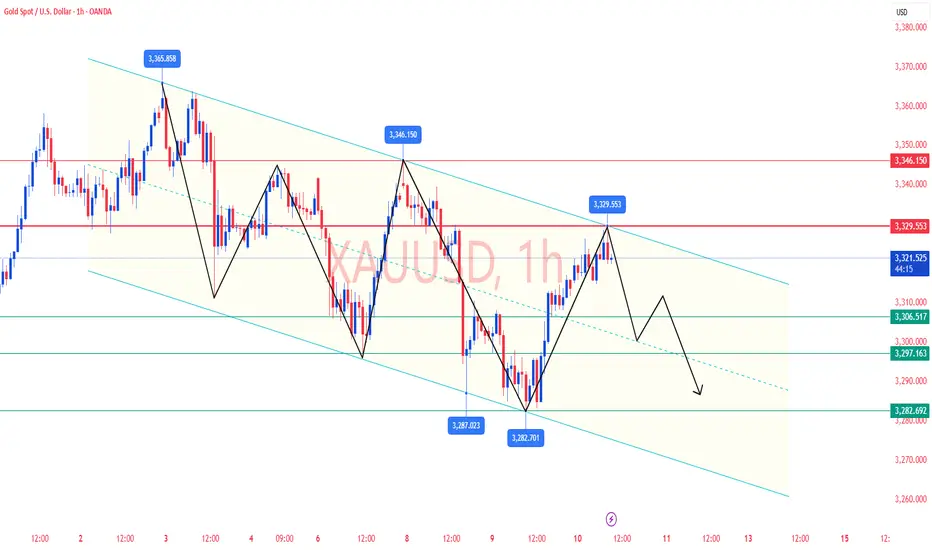
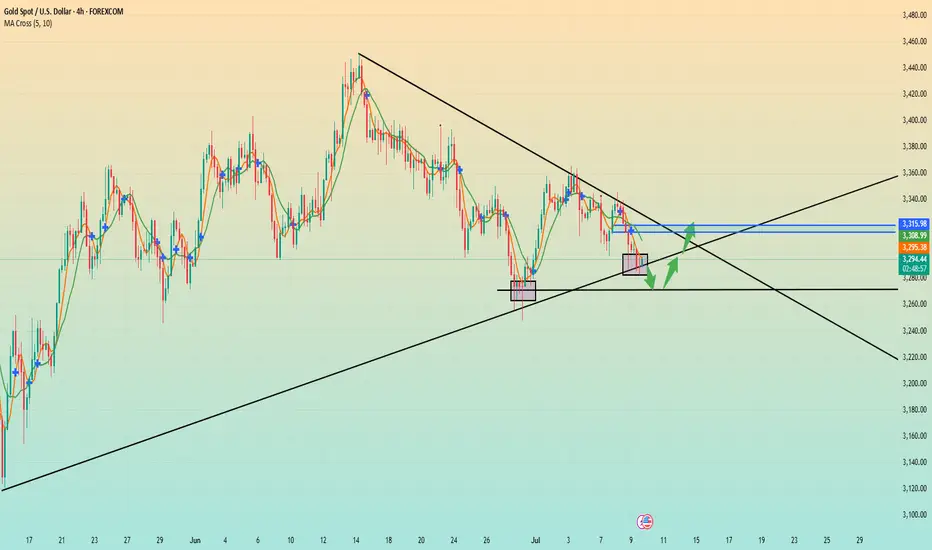
7/9: Failure to Break Above 3321 May Lead to a Drop Toward 3220Good morning, everyone!
Yesterday, gold tested support and attempted a rebound but failed to break through resistance, followed by a second leg down that broke the support zone, invalidating the potential inverse head-and-shoulders pattern and resulting in a drop below the 3300 level.
On the daily (1D) chart, price has now broken below the MA60, signaling a further confirmation of the bearish structure.
However, due to the sharp drop, a double bottom or multi-bottom structure is forming on the 30-minute chart, which may be building momentum for a potential test of the 3321 resistance zone.
📌 Key focus areas:
If 3321 is broken and held, there is room for a short-term rebound to extend;
If 3321 holds as resistance, the current rebound is likely a short-selling opportunity.
Technically speaking, without the support of bullish news, if gold fails to reclaim and sustain above 3321, there is a strong chance of a further move lower—potentially down to 3220, where the weekly MA20 is located. A deeper decline could even test the 3200–3168 support zone.
📉 Therefore, the primary trading bias remains bearish, with sell-on-rebound as the preferred strategy until a stronger bullish signal emerges. Monitor the 3321 zone closely for direction confirmation.
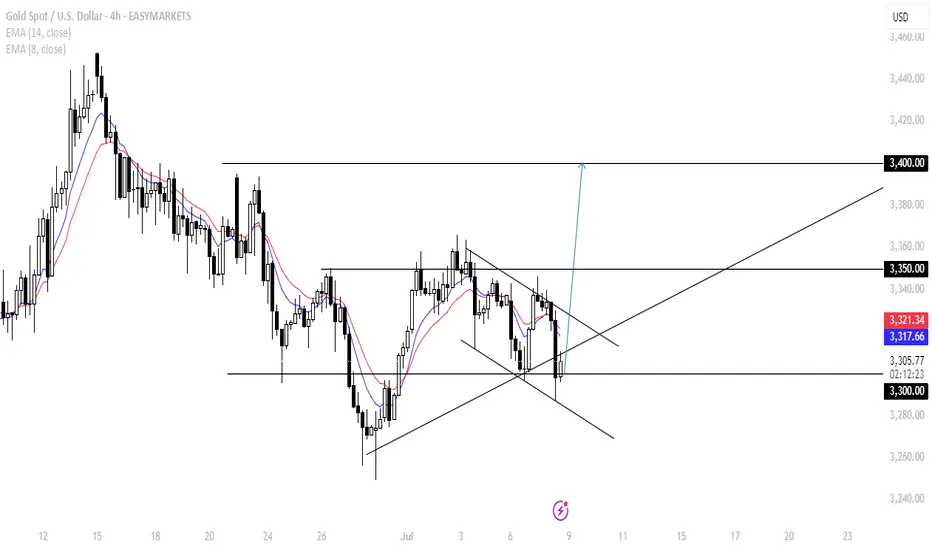
GOLD STILL ON BULLISH TRENDunexpectedly, gold came down to retest the 3300 price level today. the bullish flag structure has not been broken yet. instead of the conventional four waves of bullish flag before continuation, gold made the sixth wave today.
from technical, gold will be bullish by tomorrow and is expected to hit the 3400 price level before the week ends.
technical shows pure BULLISH SIGNAL up to the 3400 price level before weekend.
have a wonderful trading week.
BUY XAUUSD 3308Bullish flag is currently being printed. I want to see price quickly escalate from 330 towards 3340 in the next trading hours
Gold LongWaiting for the 4h order block to get hit . From there i will strike with a nice long position.
Let us wait for ny session.
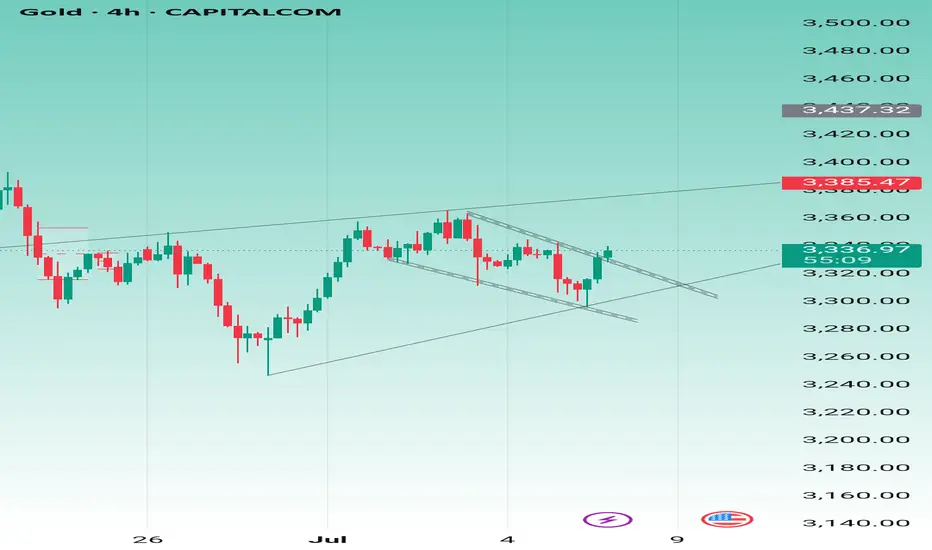
Gold Breakout + Global News AlertGold has just broken out of a falling channel, pushing up to the 3337 level — a clear bullish move! ✅
But this isn't just technical... the news is backing it too 🔥
📢 The US has imposed a 30% tariff on South Africa and 25% on Malaysia and Kazakhstan 🇺🇸
Since South Africa is one of the world’s biggest gold producers, these tariffs could tighten global supply.
➡️ That means: Gold prices may rise further due to increased demand and reduced supply.
🔍 Technical View:
Resistance levels to watch: 3385 and 3437
Break above these could take gold towards 3540+
📊 This is a perfect example of how Technical + Fundamental = Powerful setup
Trade smart. Don’t just follow price — follow the reason behind it too! 💹
#GoldBreakout #MarketUpdate #SmartTrading #GoldNews #TariffImpact #RajasTrading
Weekly range to be continued, gold short and long this weekLast week, gold opened high at 3280.9 at the beginning of the week and then fell back. The weekly low reached 3245.8, and then the market was strongly pulled up by the support of this round of trend line and fundamentals. On Thursday morning, the weekly high touched 3366, and then the market fell strongly under the strong influence of non-agricultural data. On Friday, the market consolidated in the range due to the holiday, and the weekly line finally closed at 3337.2. The weekly line closed with a medium-sized positive line with equal upper and lower shadows. After ending in this pattern, today's market continued to move in the range. In terms of points, the stop loss was still at 3346 after the short position at 3342 last Friday. Today, it first rose to 3342 and the short stop loss was still 3346. The target below is 3330 and 3322. If it falls below, the support of 3310 and 3300-3292 will be targeted.
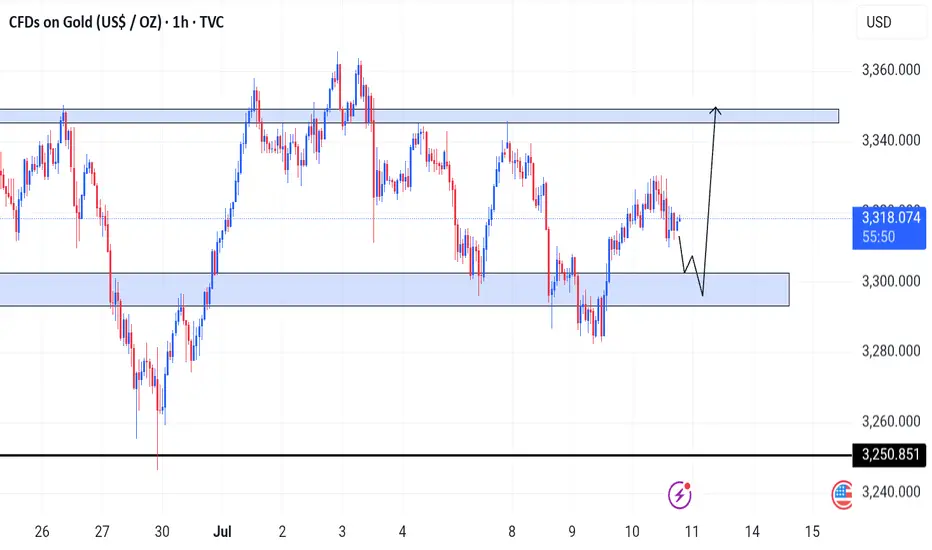
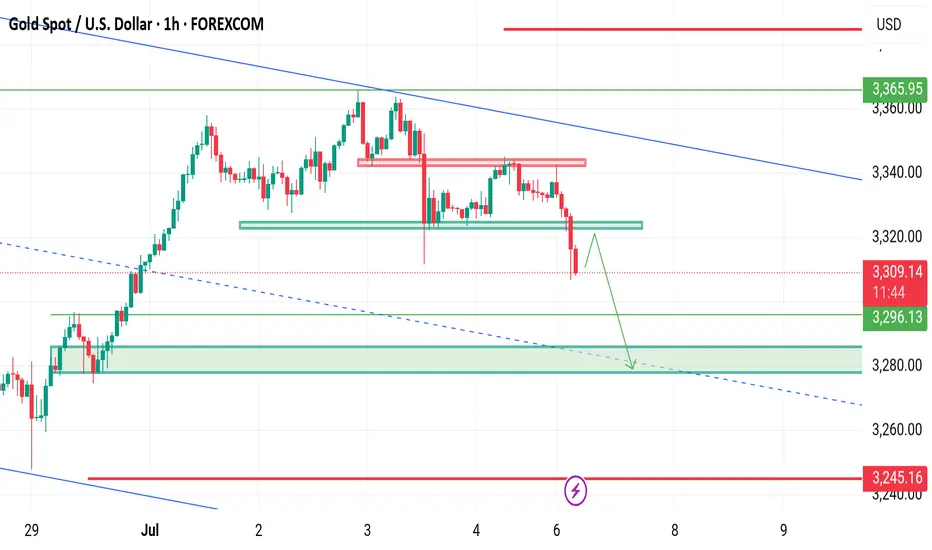
XAUUSD is on fall 3280 on Mark !H4 Timeframe Analysis
Gold is currently holding the falling pattern & Range of 3330-3280 structural support.
H4 Timeframe Analysis
Gold is currently holding the falling pattern & Range of 3330-3280 structural support.
What's possible scanarios we have?
▪️As today we have seen implusive drop due to pause of Tarrifs by Trump side ,if h1-h4 Candle closes below 3330-3320 then we'll see gold to tap 3290 then 3280 as our optimal target for today.
Also we'll 3280 piviot point if it's break then again short towards 3250.
▪️exceptional Move of Day the H4 candle remains above 3330-3335 then keep your eyes at 3345 then 3365,3380.
#XAUUSD
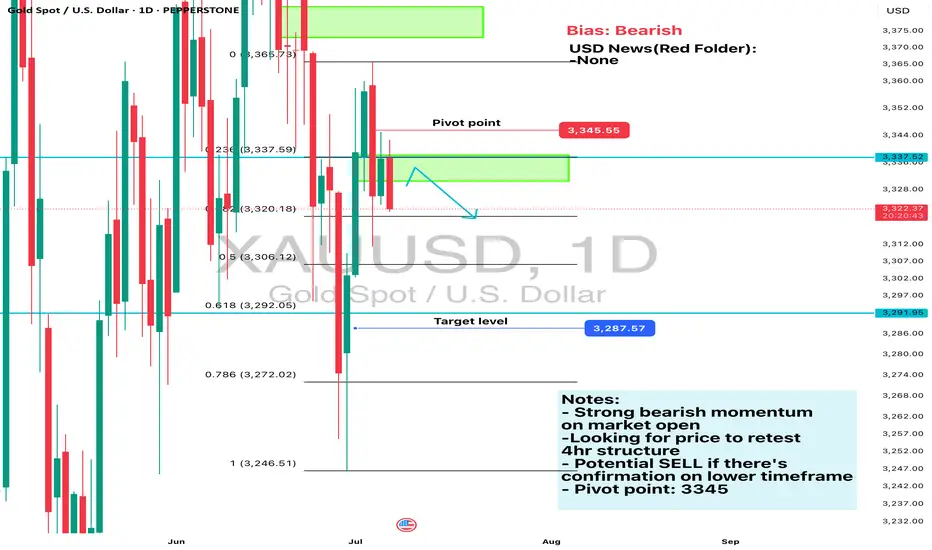
Daily Analysis- XAUUSD (Monday, 7th July 2024)Bias: Bearish
USD News(Red Folder):
-None
Notes:
- Strong bearish momentum
on market open
-Looking for price to retest
4hr structure
- Potential SELL if there's
confirmation on lower timeframe
- Pivot point: 3345
Disclaimer:
This analysis is from a personal point of view, always conduct on your own research before making any trading decisions as the analysis do not guarantee complete accuracy.
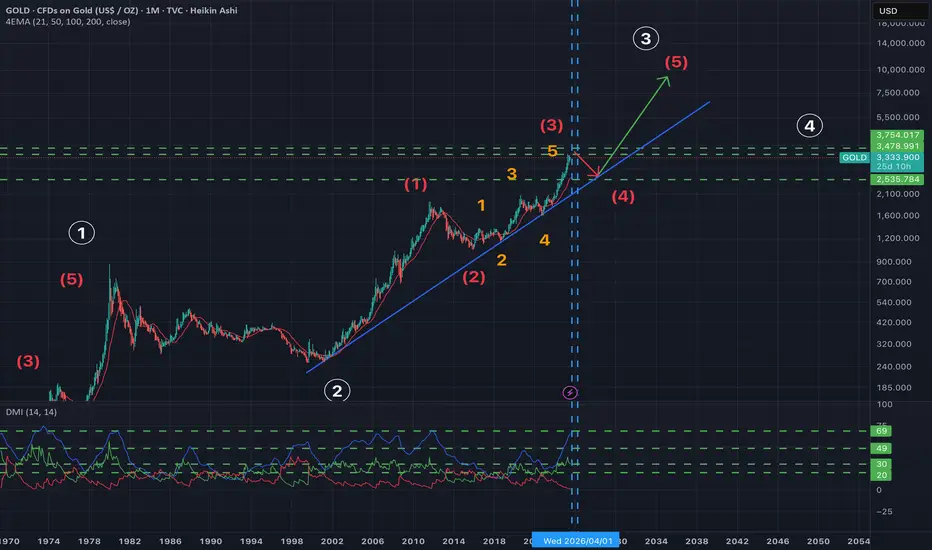
GoldHello everyone, I have a good prediction about gold. I analyzed chart of gold at monthly timeframe so in my opinion for some months, the price of gold will decrease and when it reach to blue line or reach to $2600 after that, it changed the road and it going to increase.
This analyze recommend to long-term traders
Have a good trade
SHORT IDEAI previously posted a bullish play. But now after studying the charts.
I see a potential for a really big BULL squeeze.
And a very nice opportunity to swing gold!!
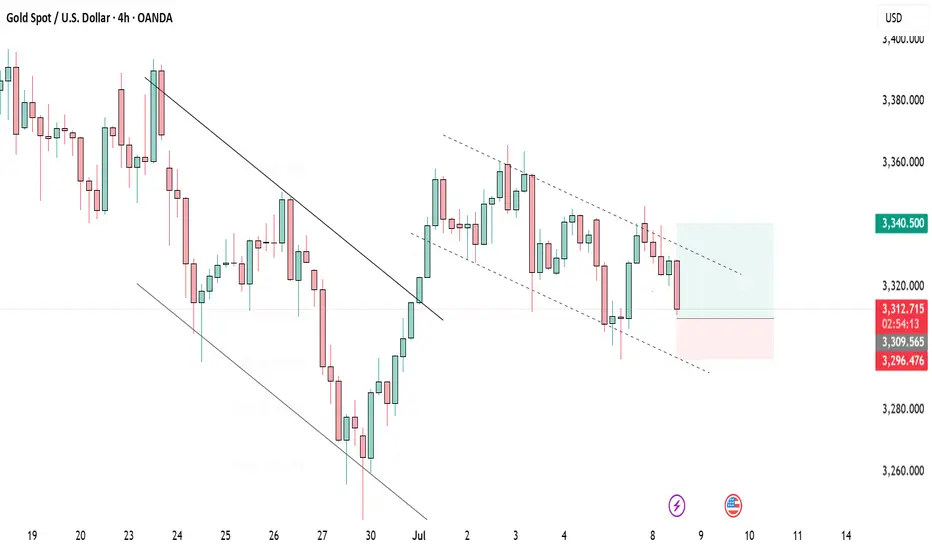
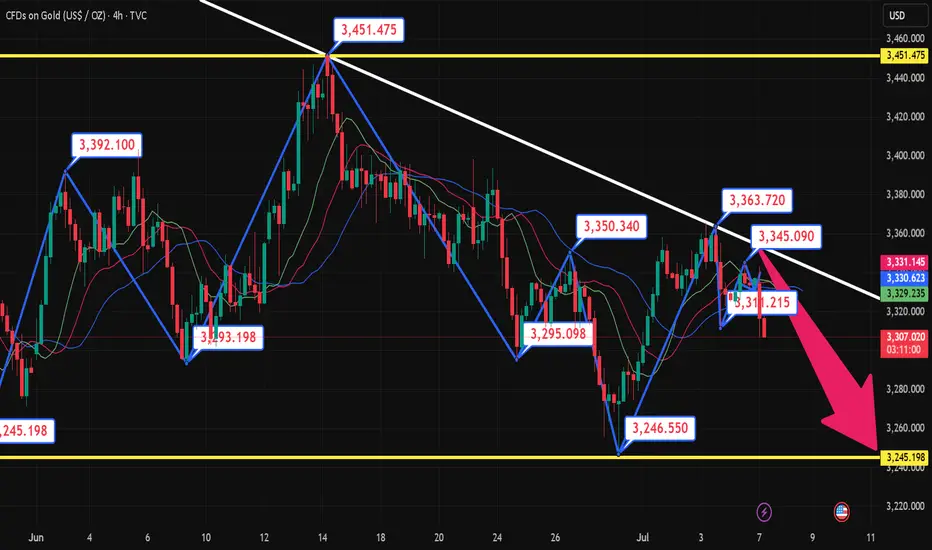
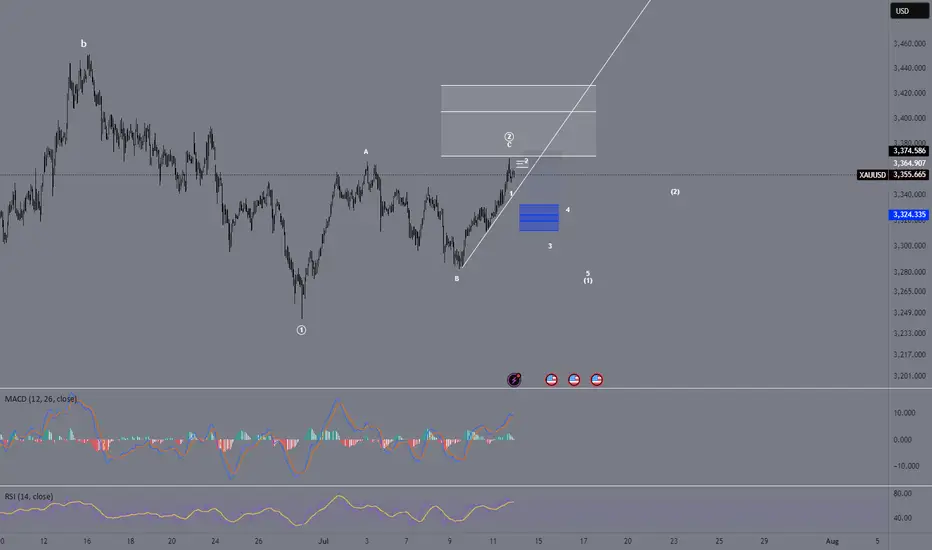
Elliott Wave Update – Is Wave 2 Complete?OANDA:XAUUSD
We're currently in an ABC correction following our Wave 1.
Potentially, Wave C is already completed, which would mean that Wave 2 has found its top.
❗ Why do I say potentially?
Because there's still a chance we could see a higher high before the real drop begins.
However, based on the current structure, I believe the top is in ✅
⚠️ Key Confirmation – White Trendline
📉 If we break below the white trendline, it confirms the end of Wave 2.
Then I expect a 5-wave move down:
➡️ (1) - (2) - (3) - (4) - (5)
📈 If the trendline holds, we might still see a higher Wave 2 before reversal.
📏 Fib Zones are marked on the chart for confluence and targets.
Let’s see how price reacts in the coming hours. A confirmed breakdown would set the stage for the next impulse ⚡
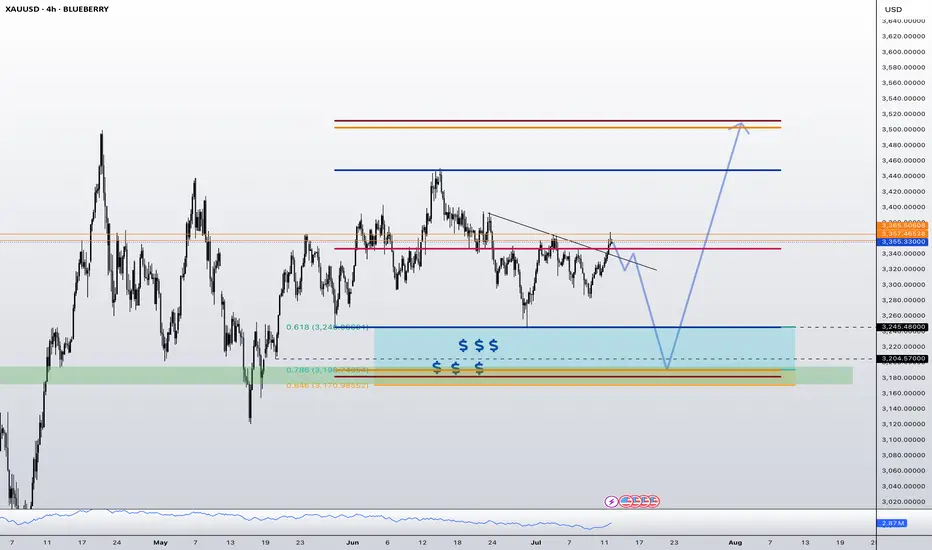
IMPORTANT BREAKOUT 〉BULLS ARE BACKAs illustrated, price has broken out of an important 4H and 1D trend line that had kept price bearish since the beginning of the month.
Yesterday, gold made its way to a ket resistance level and broke it, CLOSING above it in the 4H timeframe, which is a key sign that bulls are back.
An interesting sign is that price bounced from the 61.8 - 67% retracement of the last bullish impulse that had an extended correction.
Should price manage to stay above 3250-3300 next week, , (a very strong psychological and algorithmic price range), the path to a new ATH is well opened and the probabilities arise on its favor.
I try to visualize a potential buy area shown in green, and the invalidation of this idea would be the level from which price has bounced.
--
I have been bullish on gold since 2023, ignoring any correction to be a "bearish market" and rather accumulation phases of longer term potential for growth.
The world economy and geopolitical conflict along many other financial macroeconomic data and circumstances, are simply NOT pointing toward a better future, and gold is screaming so by continuing to rise, and central banks back this up by continuing to buy it physically.
--
GOOD LUCK
Gold fluctuates, consolidation in the 3330-3310 range📰 News information:
1. Waller meeting on interest rate cuts
2. Trump tariff issues
📈 Technical Analysis:
Waller will participate in the meeting in more than two hours and pay attention to whether there is any news of interest rate cut. The key is to operate around the 3330-3310 range. Continue to pay attention to the support of 3310-3305 at night. If gold falls below 3310,-3305 again, the downward trend will continue, and it is expected to touch 3280 again, or even 3250. If it rebounds above 3330, it is likely to continue to rise.
In addition to investment, life also includes poetry, distant places, and Allen. Facing the market is actually facing yourself, correcting your shortcomings, facing your mistakes, and exercising strict self-discipline. I share free trading strategies and analysis ideas every day for reference by brothers. I hope my analysis can help you.
TVC:GOLD FXOPEN:XAUUSD FX:XAUUSD FOREXCOM:XAUUSD PEPPERSTONE:XAUUSD OANDA:XAUUSD