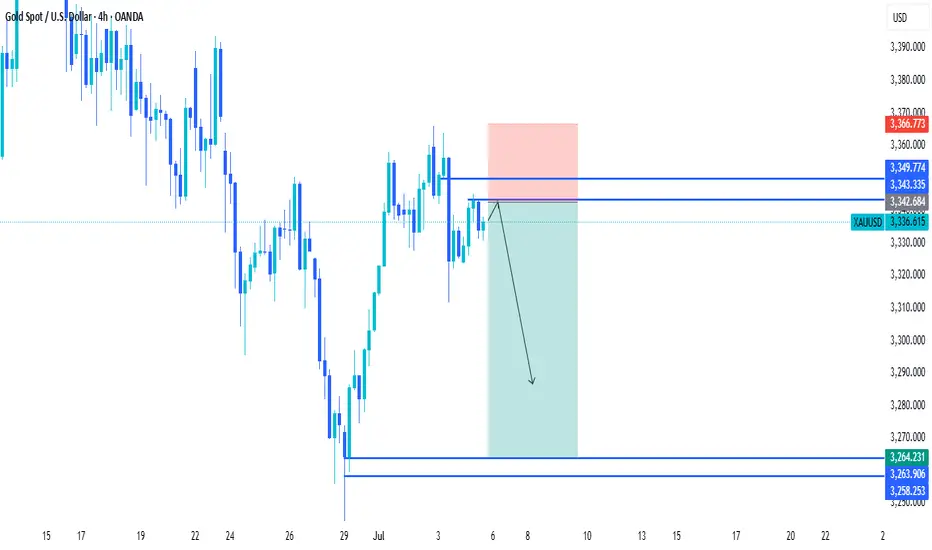
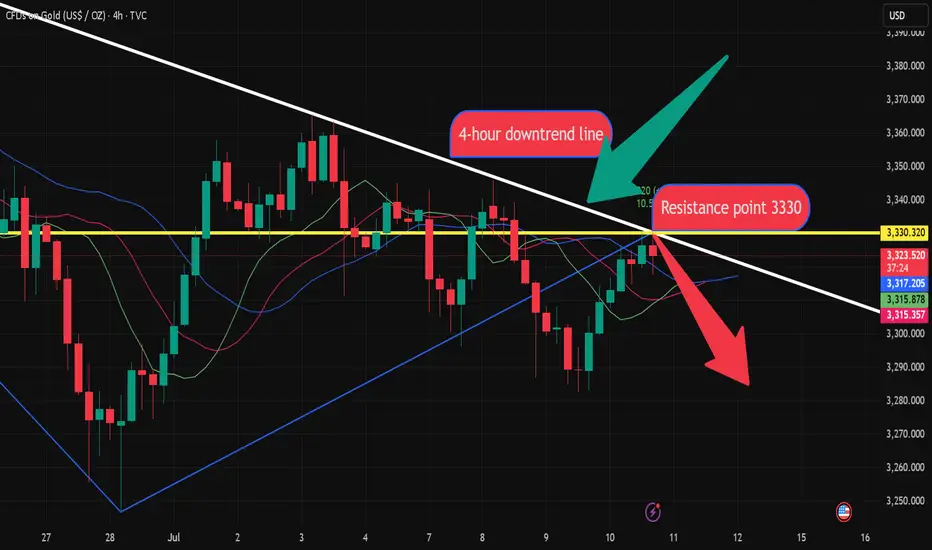
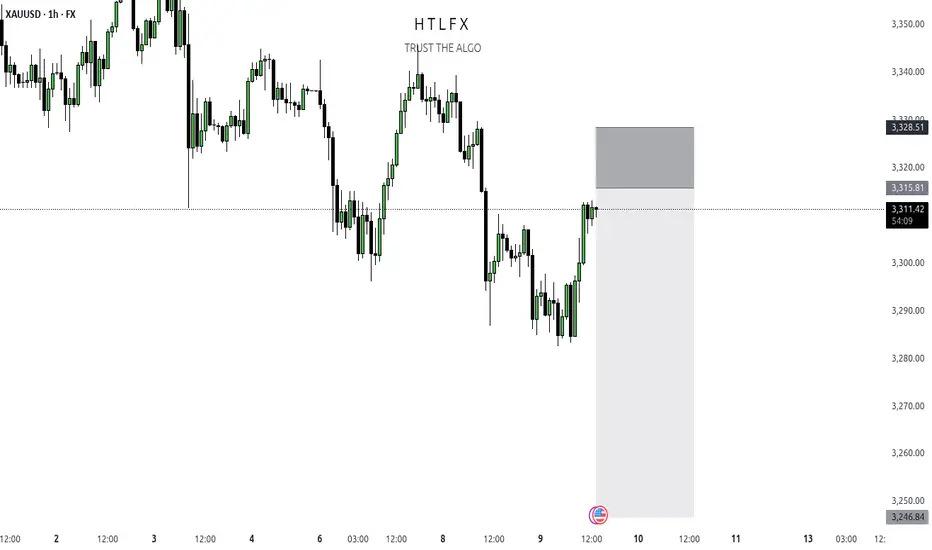
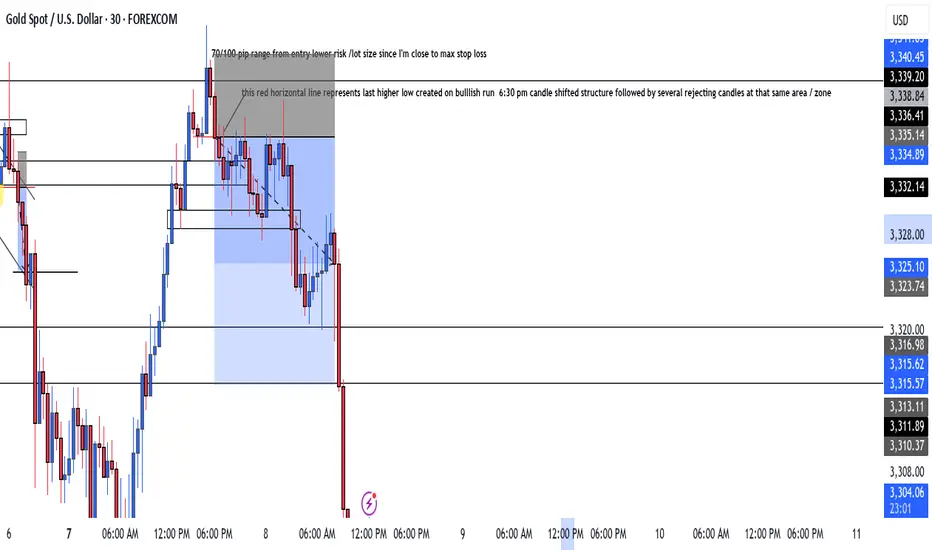
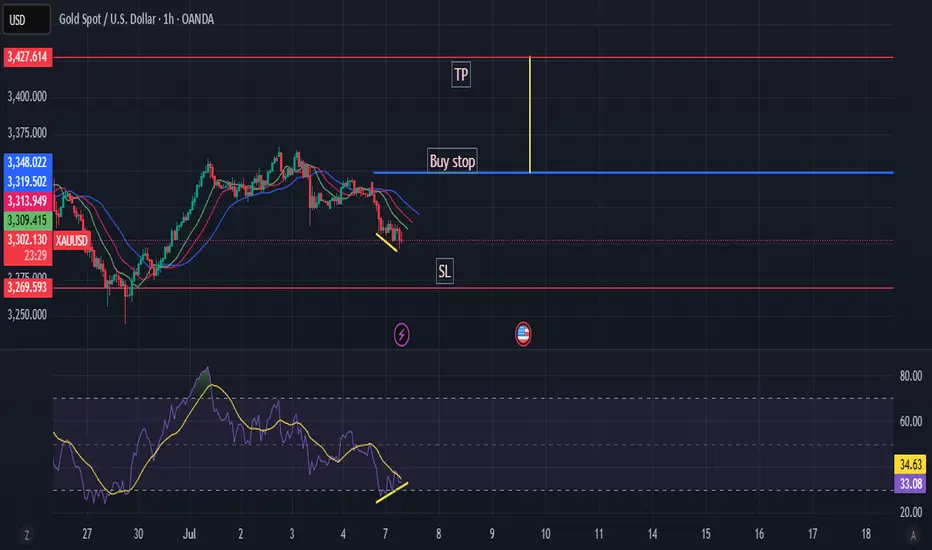
IMPORTANT BREAKOUT 〉BULLS ARE BACKAs illustrated, price has broken out of an important 4H and 1D trend line that had kept price bearish since the beginning of the month.
Yesterday, gold made its way to a ket resistance level and broke it, CLOSING above it in the 4H timeframe, which is a key sign that bulls are back.
An interesting sign is that price bounced from the 61.8 - 67% retracement of the last bullish impulse that had an extended correction.
Should price manage to stay above 3250-3300 next week, , (a very strong psychological and algorithmic price range), the path to a new ATH is well opened and the probabilities arise on its favor.
I try to visualize a potential buy area shown in green, and the invalidation of this idea would be the level from which price has bounced.
--
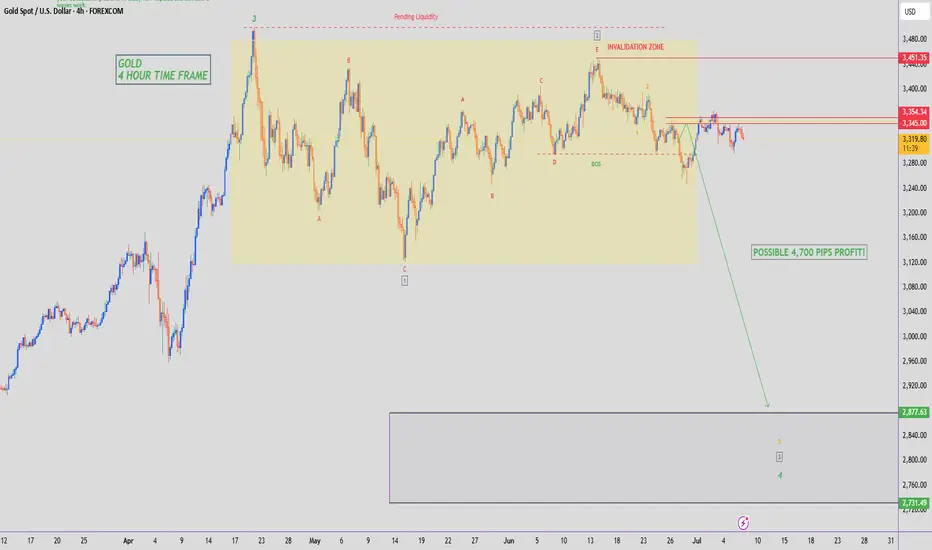
I have been bullish on gold since 2023, ignoring any correction to be a "bearish market" and rather accumulation phases of longer term potential for growth.
The world economy and geopolitical conflict along many other financial macroeconomic data and circumstances, are simply NOT pointing toward a better future, and gold is screaming so by continuing to rise, and central banks back this up by continuing to buy it physically.
--
GOOD LUCK
XAUUSDG trade ideas
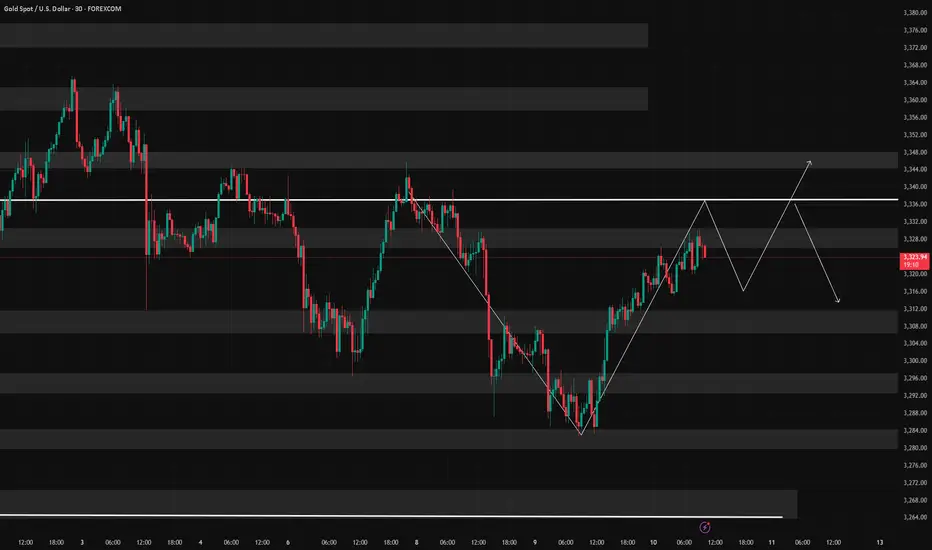
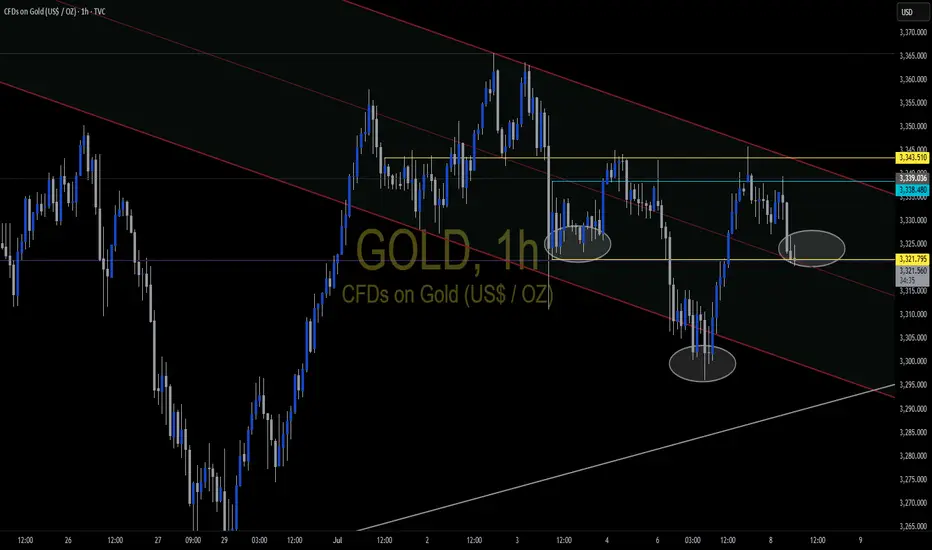
Gold fluctuates, consolidation in the 3330-3310 range📰 News information:
1. Waller meeting on interest rate cuts
2. Trump tariff issues
📈 Technical Analysis:
Waller will participate in the meeting in more than two hours and pay attention to whether there is any news of interest rate cut. The key is to operate around the 3330-3310 range. Continue to pay attention to the support of 3310-3305 at night. If gold falls below 3310,-3305 again, the downward trend will continue, and it is expected to touch 3280 again, or even 3250. If it rebounds above 3330, it is likely to continue to rise.
In addition to investment, life also includes poetry, distant places, and Allen. Facing the market is actually facing yourself, correcting your shortcomings, facing your mistakes, and exercising strict self-discipline. I share free trading strategies and analysis ideas every day for reference by brothers. I hope my analysis can help you.
TVC:GOLD FXOPEN:XAUUSD FX:XAUUSD FOREXCOM:XAUUSD PEPPERSTONE:XAUUSD OANDA:XAUUSD
Gold (XAUUSD) Long Setup – 4H ChartTrade Type: Buy (Long)
Entry: Market Buy or Re-entry near 3332–3335
Target: Above 3360 (TP1: 3360, TP2: 3370+, final target near 3380–3400 zone)
Stop Loss: Below 3325 (Recommended: 3322–3324 for margin)
Re-entry Zone: If price pulls back to 3332–3335, look for bullish confirmation for re-entry
Setup Analysis: Favorable risk-reward structure with clear upside potential toward the 3380+ resistance zone
Context:
Strong recovery from previous lows
Bullish momentum building above 3343 resistance
Volume and price structure suggest breakout continuation
Pullback entries offer strategic positioning
Date: July 11, 2025
Shared by: @Pookie_xau
Gold 4-hour resistance point fluctuates, shorts comeOn Thursday (July 10), the 4-hour resistance point of gold price was formed before the US market. The logic of shorting at the resistance point can be considered. Spot gold maintained a strong trend in the European session, trading around $3,330. Although US President Trump's remarks on imposing a new round of tariffs on many countries triggered safe-haven demand, the FOMC meeting minutes showed differences in the path of interest rate cuts within the year, making gold bulls still cautious.
Spot gold continued to retreat after the previous high of $3,499.83, and has been blocked below $3,451.14 recently, forming a relatively obvious box consolidation structure. The current price is running below the middle track of the Bollinger Band at $3,343.69, indicating that the upward momentum of the bulls is weak. Analysts believe that the short-term key support level is at $3,250, which forms a resonance support with the previous low of $3,247.87. If it falls below, it may increase the downside risk.
7/9: Focus on Selling Gold on ReboundsGood evening, everyone!
Apologies for the late update today—I had some matters to attend to. I hope your trades are going smoothly.
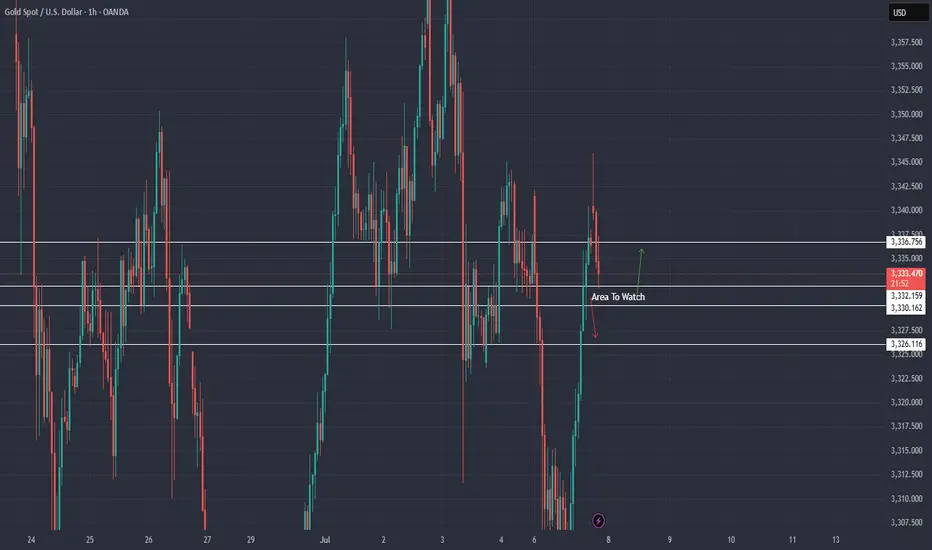
Yesterday, gold found support around 3284 and continued to rebound during today’s session, reaching as high as 3330. The key resistance at 3321 has now been broken and is currently acting as a short-term support level. However, based on the current price structure, this level is likely to be retested multiple times, and some consolidation may follow.
The next major resistance lies between 3337 and 3343. In the absence of strong bullish momentum, the preferred short-term strategy remains selling on rebounds, especially near resistance zones.
⚠️ Additionally, the U.S. Initial Jobless Claims data will be released during the New York session tonight, which may cause increased volatility and potentially whipsaw price action. Be cautious with position sizing, and avoid emotional trades or chasing price action during news releases. Patience and discipline will be key.
$XAUUSD / Gold - Thursday July 10th OutlookYesterday’s price action gave us a clean 200 pip run from the break and retest of 3308, and today we’ve already caught 140 pips using yesterday’s high (3317.17) as intraday support.
But now we’re sitting at a critical inflection point.
📍 Key levels:
Safe Buys: Only looking to buy above Tuesday’s high of 3345.74, which gives room for a clean 200-pip move up toward last Thursday’s high.
Bearish Scenario: If we fail to break that high and instead break yesterday’s high of 3316.65, we may see a sharp 340 pip drop back down to 3282.83.
⚠️ Caution: The 4H bearish trendline from mid-June is still intact, and we're currently testing it. Wait for clear confirmation either way. Higher timeframes remain bullish, so we’re playing both scenarios carefully.
XAUUSD Analysis todayHello traders, this is a complete multiple timeframe analysis of this pair. We see could find significant trading opportunities as per analysis upon price action confirmation we may take this trade. Smash the like button if you find value in this analysis and drop a comment if you have any questions or let me know which pair to cover in my next analysis.

"Gold Breakout Strategy: How to Trade XAUUSD Using the ORB MethoLearn how to mark up and trade gold (XAUUSD) using the Opening Range Breakout (ORB) strategy. In this video, I’ll walk you through how to identify the key levels, wait for confirmation, and time your entries for high-probability trades — all using the power of the ORB method. Perfect for day traders who want a simple, structured system to catch explosive gold moves.

Gold swing( PRE/ DIS ) + PDA + Dealing rang (HTF )
( LTF ) PRE / DIS + PDA + Dealing range
FOMC High risk be carful im loonking to short GOLD and Hold it's a swing opportunity not for scalp SL gonna be bigger so manage risk for swing not scalp i told u
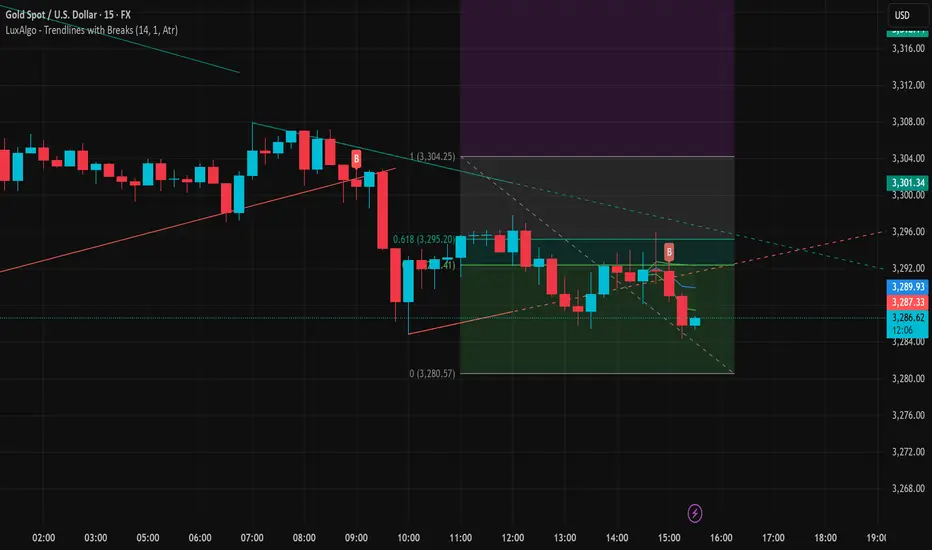
XAUUSD Loses Short-Term Support – Deeper Decline May FollowGold (XAUUSD) is showing clear signs of short-term weakness after losing a key support zone around 3,287 USD – which previously aligned with the rising trendline and the 61.8% Fibonacci retracement level (3,295.20 USD) of the prior downward move.
1. Price Structure and Current Pattern:
Price has formed a descending triangle and just broke below its lower boundary with strong bearish candles.
Consecutive bearish candles with short lower wicks indicate strong selling pressure with little buying interest.
After being rejected at 3,304.25 USD – the most recent swing high – price has dropped toward the 0.0% Fibonacci level at 3,280.57 USD.
2. Fibonacci and Key Price Zones:
The 3,295.20 area (Fibo 0.618) has now become a strong resistance after a failed recovery attempt.
The 3,280 – 3,275 zone is the next target for bears if no strong reversal appears in upcoming sessions.
A break below 3,275.73 may open the path for further downside toward 3,268 – 3,260.
3. Trendlines and Candle Behavior:
The short-term rising trendline (in red) has been broken alongside increasing sell volume.
The upper descending trendline (in light blue) remains intact, confirming that the overall structure is still bearish.
Suggested Trading Strategy:
Sell on rallies: Prefer short entries around 3,290 – 3,293, with a stop loss above 3,296.
Short-term target: Look for potential take-profit zones at 3,275 – 3,268.
Avoid bottom fishing unless there’s a strong bullish reversal signal such as an engulfing or hammer candle backed by volume.
Conclusion:
Gold is under visible downside pressure below key technical resistance. If the price fails to hold above 3,280, the downtrend could extend further. Traders should remain cautious of weak pullbacks and look to enter in line with the dominant bearish trend.
Focus on the Fed meeting minutesFrom a technical perspective, the trend of gold is obviously weak. In the morning trading yesterday, the price of gold failed to continue the previous day's rise, and the rebound high kept moving down. After breaking the key support level during the US trading session, it accelerated downward, and the daily line closed with a big negative line, and the short-selling force had the upper hand. Today's closing situation is crucial. If it continues to close with a negative line, the short-term downward trend may be established. The minutes of the Federal Reserve meeting will also bring new variables to the gold market. The policy direction may further affect the trend of gold prices. At present, the upper resistance is 3303-3308, and the lower support is 3284-3278. It is recommended to do more on the callback.
Operation strategy: It is recommended to do more on the callback of 3280-3275, with a target of 3295-3307 and a stop loss of 3370.
Analysis of the latest trend of gold and precise trading strategAnalysis of the latest trend of gold and precise trading strategies:
Core contradictions in the current market
Safe-haven support vs. dollar suppression
Gold bullish:
Trump's tariff increase on Japan and South Korea (effective on August 1) triggered market risk aversion, and US stocks fell.
The People's Bank of China has increased its gold holdings for 8 consecutive months, and long-term buying is stable.
Gold bearish:
The US dollar index rose to a one-week high (97.67), suppressing gold denominated in US dollars.
Technically, the strong resistance of $3345 has not been broken, and the bullish momentum is insufficient.
Key price breakthrough:
Break above 3345: Confirm the bullish trend, target 3380-3400.
Break below 3275: May accelerate the callback to the 3250-3230 support area.
Key technical signals
1. 4-hour level
Obvious pressure: 3345 forms a double top pressure, MACD golden cross momentum is exhausted, and if the dead cross will strengthen the callback.
Short-term support: 3280-3275 (if it falls below, look at 3250).
2. 1-hour level
Short-term bearish: The moving average is in a bearish arrangement, and the price rebounds weakly after falling below 3295.
Oversold rebound opportunity: If a long lower shadow or MACD bottom divergence appears near 3280, you can bet on short-term longs.
Today's precise trading plan
Strategy 1: Short-term rebound short (main strategy)
Entry point: 3323-3325 light position short, stop loss 3332 (to prevent false breakthroughs).
Target: 3300→3280 (if it breaks below 3280, you can hold and look at 3275).
Logic: 3345 resistance is effective + strong US dollar + 1-hour moving average suppression.
Strategy 2: Short-term long on pullback (auxiliary strategy)
Entry point: 3285-3295 stabilize and then long (need K-line to close positive or MACD golden cross to confirm).
Stop loss: below 3280, target 3310-3320.
Logic: support at the lower edge of the range + risk aversion may be repeated.
Strategy 3: Breakout and follow
Break above 3345: chase long, target 3360-3380, stop loss 3330.
Break below 3275: wait and see whether the decline accelerates, do not buy against the trend.
Risk control and key tips
Strict stop loss:
Short stop loss 3332 (to prevent sudden risk aversion).
Stop loss 3280 for long orders (to avoid a weakening trend).
Data risk:
Pay attention to US PPI data and speeches by Fed officials, which may trigger fluctuations.
Position management:
No more than 5% position in a single transaction, avoid heavy positions.
Summary
Main direction during the day: Prioritize high altitude below 3345, pay attention to pressure near 3325.
Key support: 3280-3275 is the last line of defense for bulls, and it will turn to short if it falls below.
Breakthrough strategy: Follow the trend after breaking above 3345 or below 3275.
As you see gold played out just as expected you see in previous post I identified an area where we got break of structure and previous area price would go to
GOLD - SHORT TO $2,800 (UPDATE)Gold once again last night came back to test our resistance zone, after huge bullish momentum all yesterday. But again we saw a bearish rejection from our ‘supply zone’, pushing price back down 300 PIPS.
Being extremely careful here, as Gold is currently at a make or break sort of area.
GOLD ON BUY FROM 3316#XAUUSD price we expect drop till 3316 for bullish range to form.
Buy limit 3316-3315.5, target 3330, stop loss 3310.
Below 3306 holds bearish continuation, target 3290-3280.
Bullish range can form above 3330 on 2 times breakout, target 3345
XAUUSDPreferably suitable for scalping and accurate as long as you watch carefully the price action with the drawn areas.
With your likes and comments, you give me enough energy to provide the best analysis on an ongoing basis.
And if you needed any analysis that was not on the page, you can ask me with a comment or a personal message.
Enjoy Trading ;)
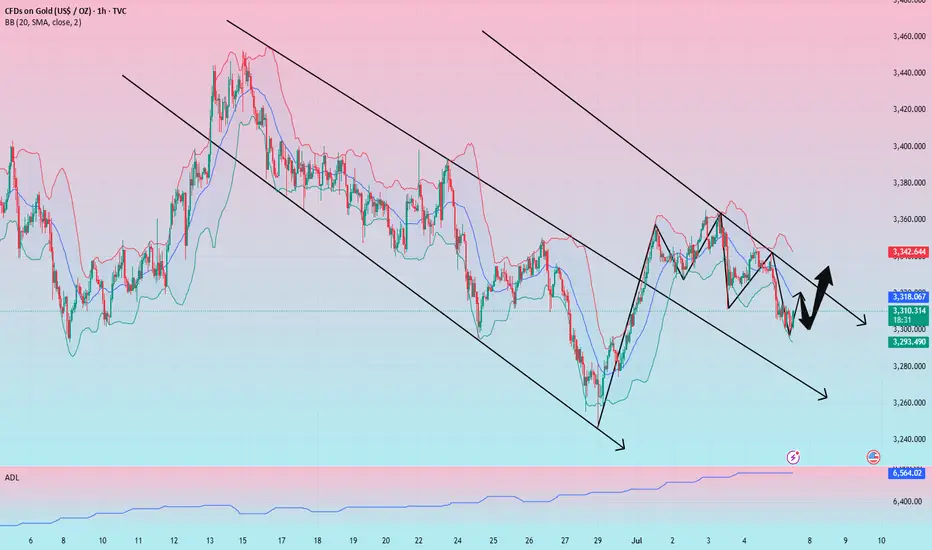
GOLD looks to be trying to make a bullish patternGold is trying to turn this downtrend around. Let's see if it can confirm the INV H&S pattern.
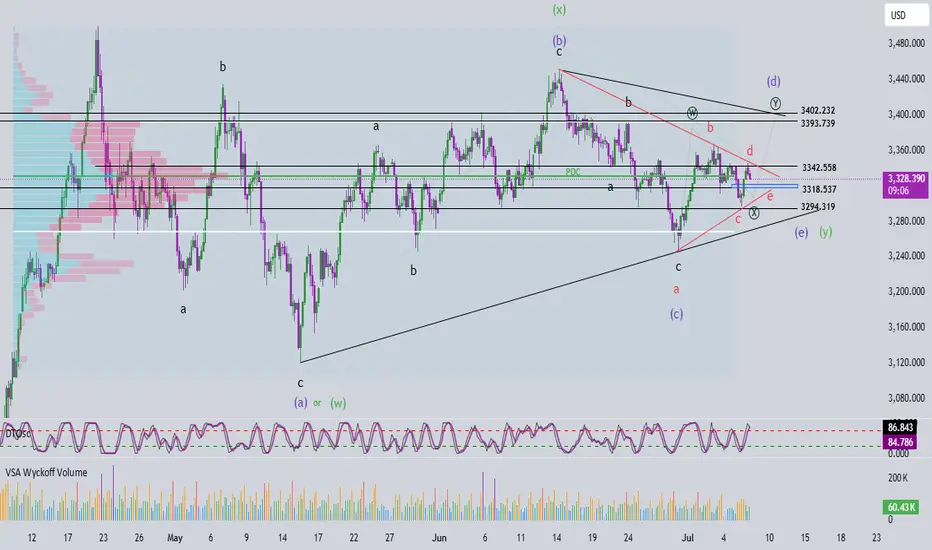
Elliott Wave Analysis – XAUUSD – July 8, 2025🔎 Momentum Analysis
On the daily (D1) timeframe, momentum is currently declining. At the same time, the 4H momentum is showing signs of reversing downward. This suggests a likely short-term corrective decline, which provides a basis for projecting potential Elliott Wave patterns.
🌀 Elliott Wave Structure
On the 4H chart, I currently see two main possible scenarios:
Scenario 1: Contracting Triangle Correction (abcde – purple)
This scenario assumes a contracting triangle correction labeled abcde in purple.
The market appears to be in wave d (purple), which is unfolding as a wxy corrective structure. Currently, it is likely in wave y.
The projected target for the end of wave y is between 3393 – 3402.
However, due to the declining momentum, I expect a short-term pullback to the 3318 – 3321 region before price resumes upward to complete wave d.
Scenario 2: Larger WXY Correction
In this case:
Wave W has completed as a standard 3-wave abc.
Wave X has also completed as a double zigzag.
Wave Y appears to be forming a small contracting triangle abcde in red.
Currently, the price is being compressed between the upper and lower boundaries of the red triangle, suggesting that it is in the final wave e.
In this scenario, the projected retracement also aligns with the 3318 – 3321 zone. After completing wave e, price is expected to break out strongly above the upper boundary of the red triangle.
✅ Strategic Conclusion
Both scenarios point to a confluence zone at 3318 – 3321, making this a key potential buying area. Two trading approaches can be considered:
Aggressive Entry: Buy within the 3318 – 3321 range.
Conservative Entry: Wait for a confirmed breakout above the red triangle before entering a long position.
📈 Suggested Trade Plan
Buy Zone: 3318 – 3321
Stop Loss: 3308
Take Profit 1: 3342
Take Profit 2: 3362
Take Profit 3: 3393
XAU / USD 1 Hour ChartHello traders. Here is my hourly chart showing my current area of interest for scalp buys/sells. Watching to see if we reject, form some support and keep moving up after the pullback, or do we keep going lower to take out the current long positions in profit? Patience is key. Big G gets a shout out. Be well and trade the trend. Safe trading.
Gold is adjusting downward, don't blindly chase the short positi
Today, gold is in a consolidation and downward trend. As of now, the lowest price has reached around 3296, and it is still consolidating around 3300.
From the current point of view, gold is indeed in a bearish trend.
However, don't chase orders, this is very dangerous.
Because from the hourly chart, although the low point of gold is constantly refreshing, the key hourly chart support range position has not yet broken.
So, here I may think that gold may still be tempting to short in the short term.
There is still a possibility of a pullback on the hourly chart.
From the current point of view, before the range is broken, there is still a probability of a pullback to 3320-30.
So, in the next operation, I suggest that you can pay attention to 3320-30.
But there is no guarantee that it will definitely pull back, because it is indeed in a bearish trend now, and it may also go down directly.
However, if it does rebound again, as long as it does not stabilize at 3330 again.
Then, we can short at 3320-30.
On the contrary, if the rebound breaks directly above 3340, then be careful.
The rebound may turn into a reversal, and it is very likely to replicate the rhythm at the beginning of last week.
XAUUSD TRADE SETUPWait for retest the entry level and bearish momentum then take a trade for Sell otherwise skip this setup