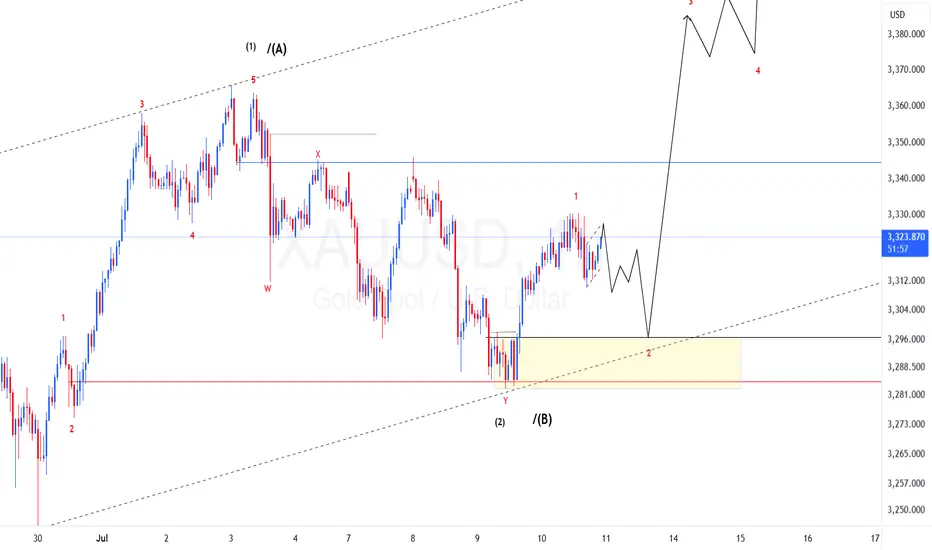
Monday pozeshan gold As my analysis a good buy is gaining momentum from 3330 big buy area next target 3365-3370if you satisfied with my target you can play
XAUUSDG trade ideas

Gold opening market strategy analysis
💡Message Strategy
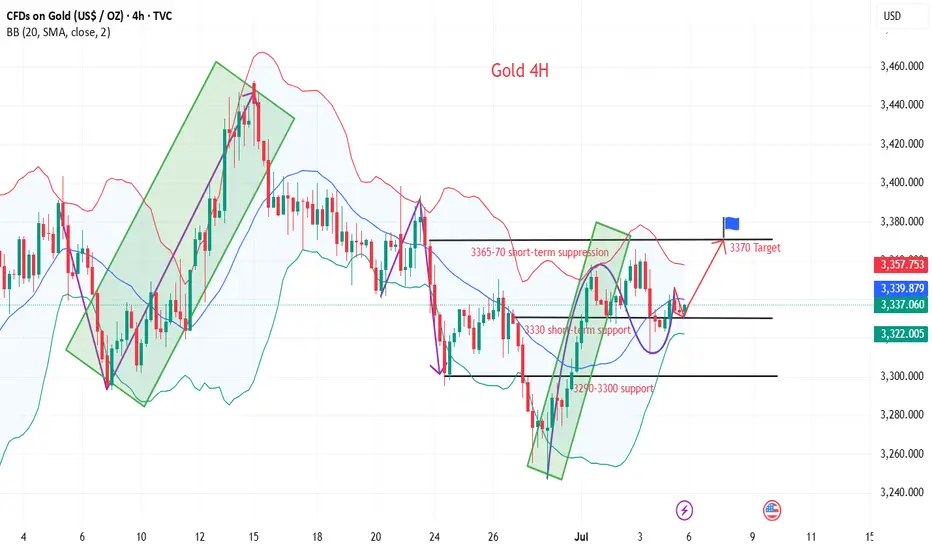
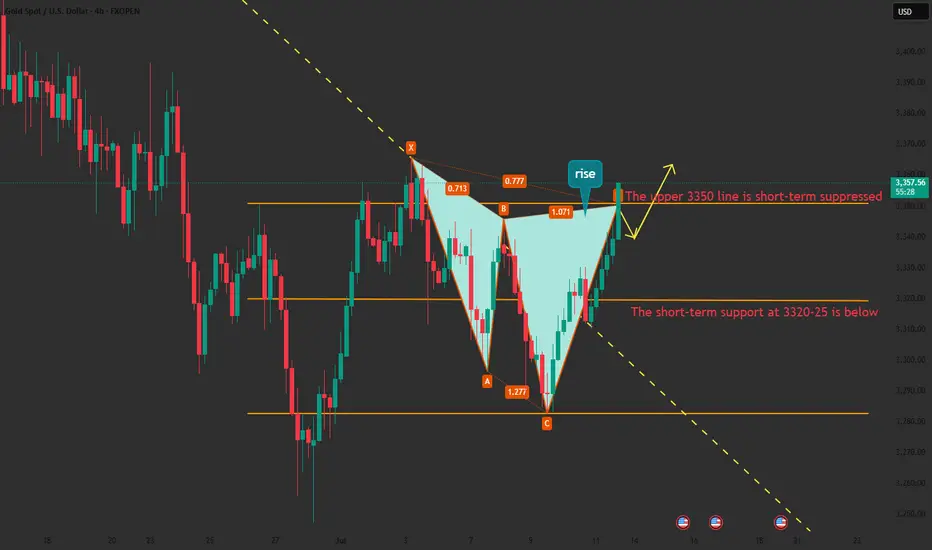
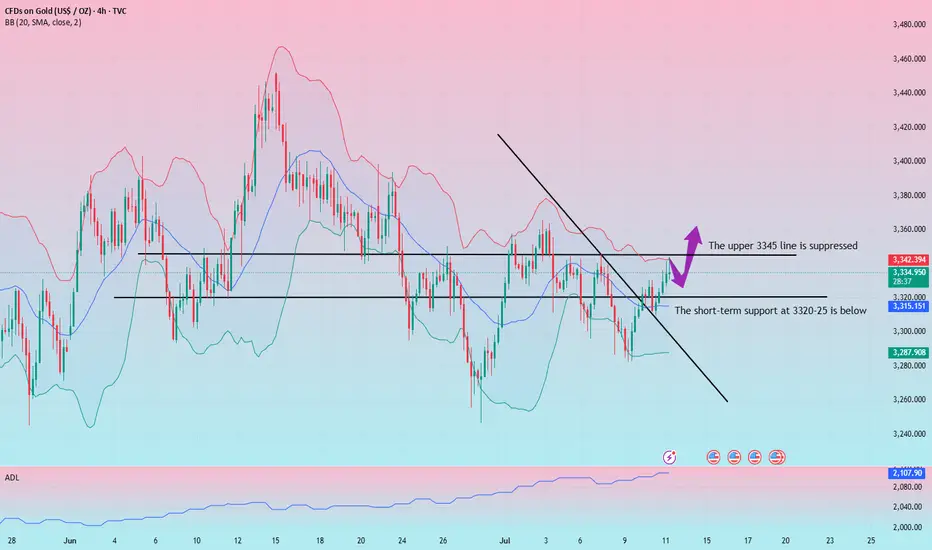
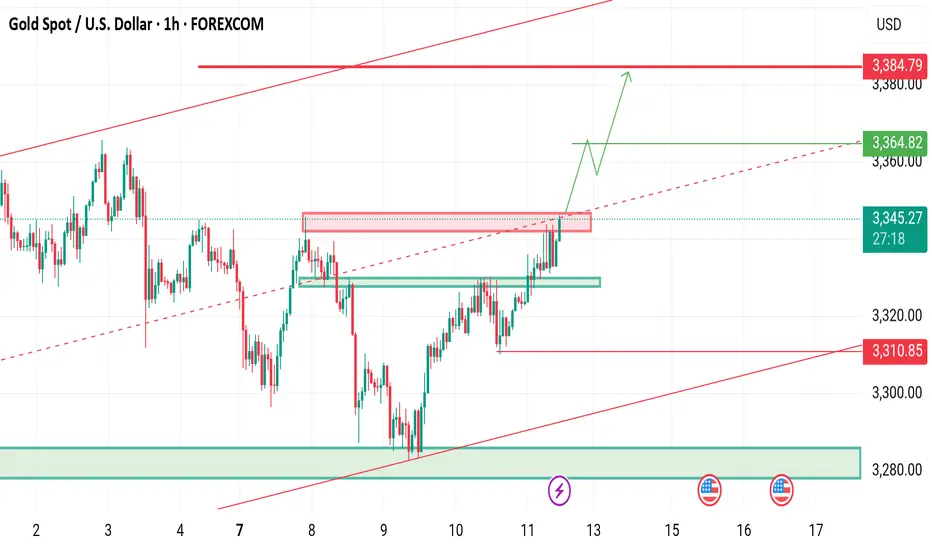
In the case of all negative non-agricultural data, gold did not fall below the support of 3300, which shows that gold bulls are still the main trend. The current daily pattern of gold is three positives, one negative and one positive. The trend of the opening next Monday is also very important. Once it continues to rise and rebound to break through the suppression, the bulls will open the door to regain the 3400 mark.
At present, the short-term pressure is still maintained at 3345-50, which is also the first point for the bulls to break through. Once the breakthrough is successful, the next target will be around 3365-3370.
📊Technical aspects
From the 4-hour analysis, the support at 3330 is concerned, and the support at 3320 is concerned. The short-term resistance at 3345-50 is concerned, and the suppression at 3365-70 is concerned. The overall low-multiple cycle participation is maintained. In the middle position, watch more and do less, and be cautious in chasing orders, and wait patiently for key points to participate. Pay attention to the specific operation strategy in time.
💰Strategy Package
Long Position:3320-3330,SL:3305,Target: 3370
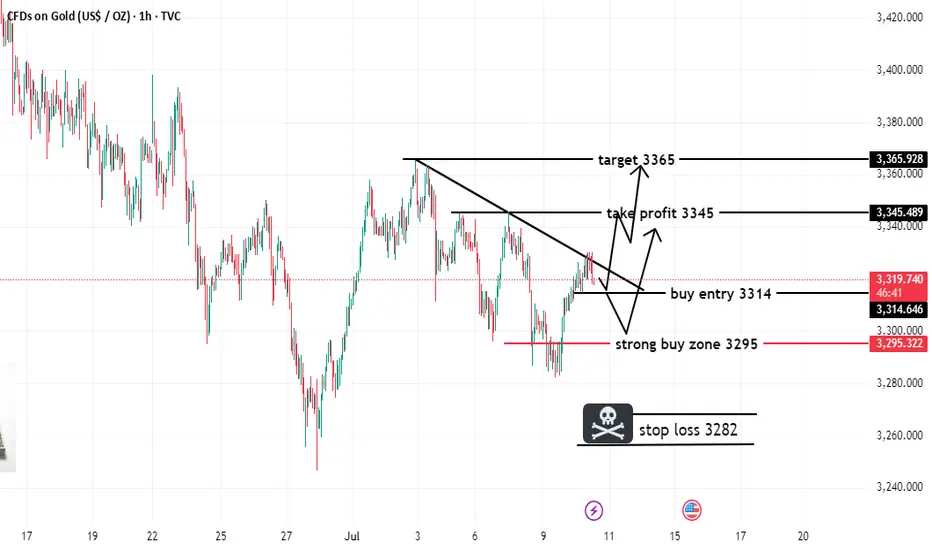
XAUUSD BREAKOUT TRADE (READ CAPTION)hi trader's. what do you think about gold
current price: 3318
gold is breakout bullish trade line gold retest down side. then gold taking support and jump upside
support zone: 3314,3295
resistance zone :3345,3365
stop loss: 3282 market low
Bulls rise, beware of Friday's black swan📰 News information:
1. Pay attention to the impact of Trump administration tariffs
📈 Technical Analysis:
Gold rose as expected and touched around 3344, which was in line with our judgment last night. However, from the market point of view, the K-line entity did not stand firmly above 3335. There are only two possible scenarios for the subsequent trend of gold. One is to stand directly above and test the 3345 resistance again, and the other is to fall in the European and American markets due to timeliness and retest the key support of 3310. At present, the upper positions are 3345 and 3365 respectively. If 3345 is repeatedly not broken and the European market falls with acceleration, then the 3310 area will still need to take back the long positions, which can be defined as a long wide-range wash. 3330-3320 is a very critical support position, and 3310 is a strong support. Therefore, the best position for shorting during the day is around 3335-3345, with the target at 3330-3320. Consider long positions after falling back and getting support here.
🎯 Trading Points:
SELL 3335-3345
TP 3330-3320
BUY 3330-3320
TP 3345-3365
In addition to investment, life also includes poetry, distant places, and Allen. Facing the market is actually facing yourself, correcting your shortcomings, facing your mistakes, and exercising strict self-discipline. I share free trading strategies and analysis ideas every day for reference by brothers. I hope my analysis can help you.
OANDA:XAUUSD PEPPERSTONE:XAUUSD FOREXCOM:XAUUSD FX:XAUUSD FXOPEN:XAUUSD TVC:GOLD
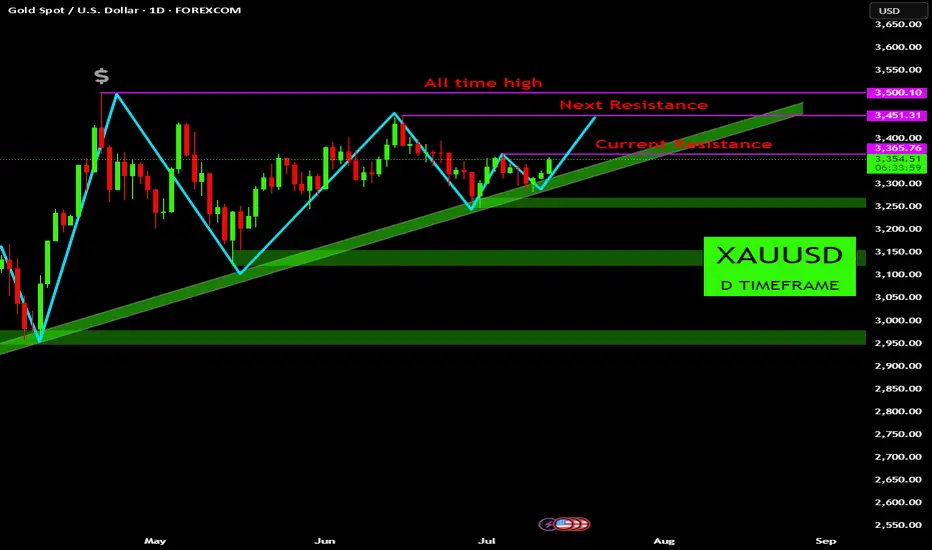
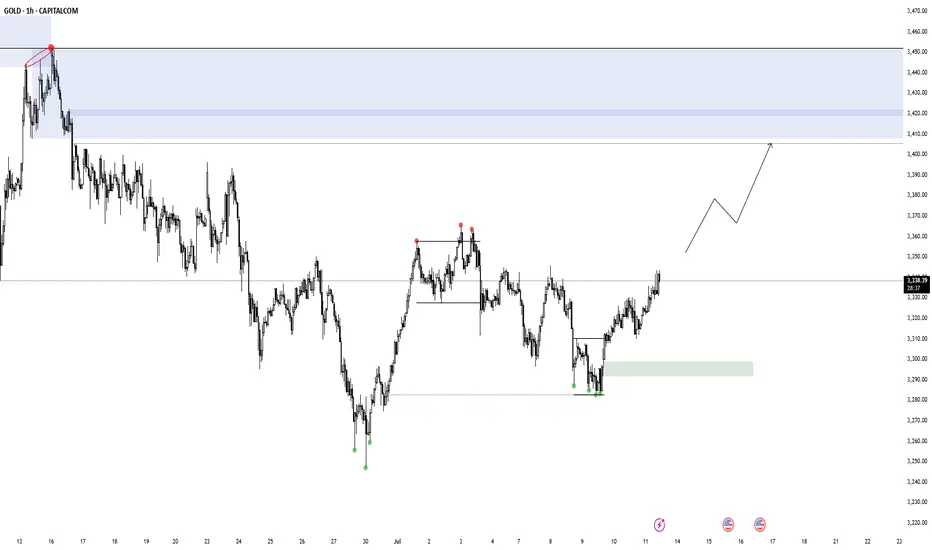
XAUUSD Bullish Structure Intact: Eyes on the All-Time HighGood day, traders. Taking a look at the Gold (XAUUSD) daily chart, we see a very clean and persistent bullish structure that has been developing since the start of the year. The primary driver of this analysis is the well-defined ascending trendline that has served as foundational support for the entire uptrend.
The Bullish Thesis:
Price action has consistently printed higher lows, bouncing cleanly off the ascending trendline multiple times. Each test of this support has been met with strong buying pressure, propelling the price to new highs. This pattern establishes a clear path of least resistance to the upside.
Currently, the price is challenging the immediate resistance zone around the 3,365 level. A decisive daily close above this area would be the first signal that the next leg up is underway.
First Target: A break of current resistance opens the door to test the Next Resistance at approximately 3,450. This level aligns with the previous significant high from early June.
Ultimate Target: The main prize for the bulls is the All-Time High sitting just above at 3,500. This is a major psychological and technical level. A break and hold above this zone would signal a new phase of price discovery.
The Bearish Invalidation:
For this bullish outlook to be invalidated, we would need to see a convincing break and daily close below the primary ascending trendline. Such a move would indicate a significant shift in market structure. Should this occur, key support zones to watch on the downside are:
The horizontal support area around 3,150.
The major structural support zone around 3,000.
Conclusion:
The technical picture for Gold remains firmly bullish. The structure is clear, and the trend is your friend. As long as the price continues to respect the ascending trendline support, the bias is to look for buying opportunities on dips or breakouts. The immediate focus is on clearing the 3,365 resistance to unlock the path towards the 3,450 and 3,500 targets.
Disclaimer:
The information provided in this chart is for educational and informational purposes only and should not be considered as investment advice. Trading and investing involve substantial risk and are not suitable for every investor. You should carefully consider your financial situation and consult with a financial advisor before making any investment decisions. The creator of this chart does not guarantee any specific outcome or profit and is not responsible for any losses incurred as a result of using this information. Past performance is not indicative of future results. Use this information at your own risk. This chart has been created for my own improvement in Trading and Investment Analysis. Please do your own analysis before any investments.
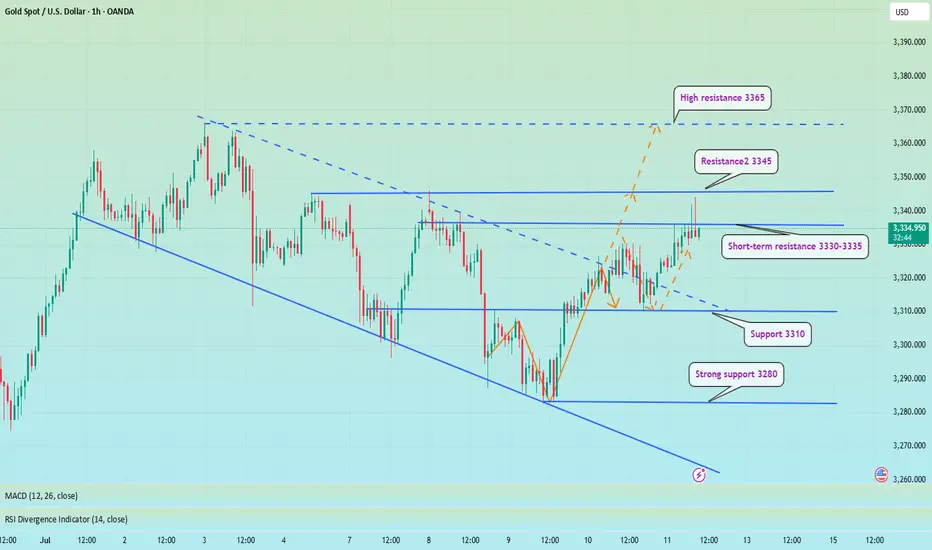
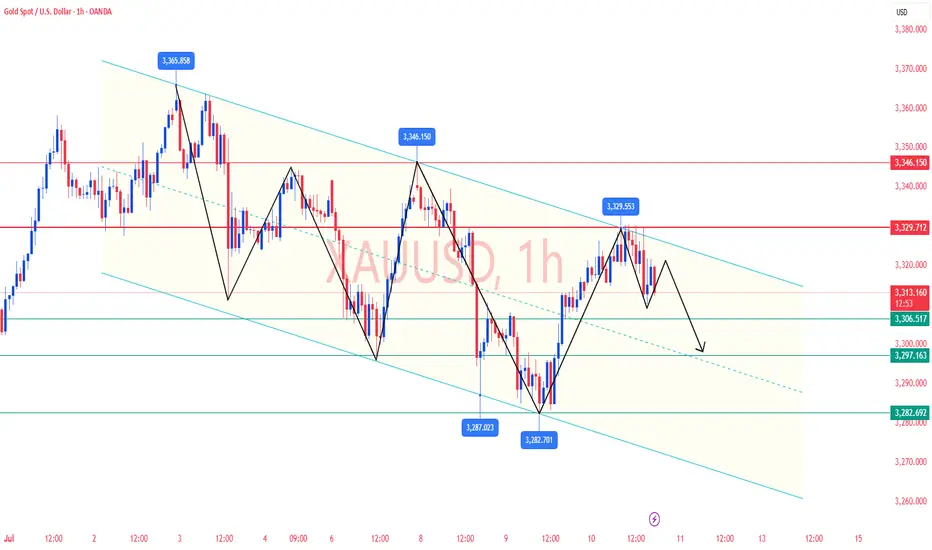
The rebound is under pressure and the retracement is furtherFrom the 4-hour analysis, the support below today is around 3309-16.
The short-term bullish strong dividing line is around 3295-3301. The overall bullish rhythm of high-altitude and low-multiple continues to remain unchanged.
Before the daily level falls below the 3300 mark, any retracement is a long opportunity, and short positions against the trend should be cautious.
Gold resumes its rally
From the 4-hour analysis, the upper side focuses on the short-term suppression of 3345-50. Today's lower support focuses on the vicinity of 3309-16. The short-term bullish strong dividing line is near 3295-3301. The overall bullish rhythm of high-altitude and low-multiple continues to remain unchanged. Before the daily level falls below the 3300 mark, any retracement is a long opportunity. Short orders against the trend should be cautious.
Gold operation strategy:
1. Go long on gold when it falls back to 3316-25, stop loss at 3307, target at 3340-45, and continue to hold if it breaks;
2. Go short on gold when it rebounds to 3345-50, stop loss at 3357, target at 3320-3326, and continue to hold if it breaks;
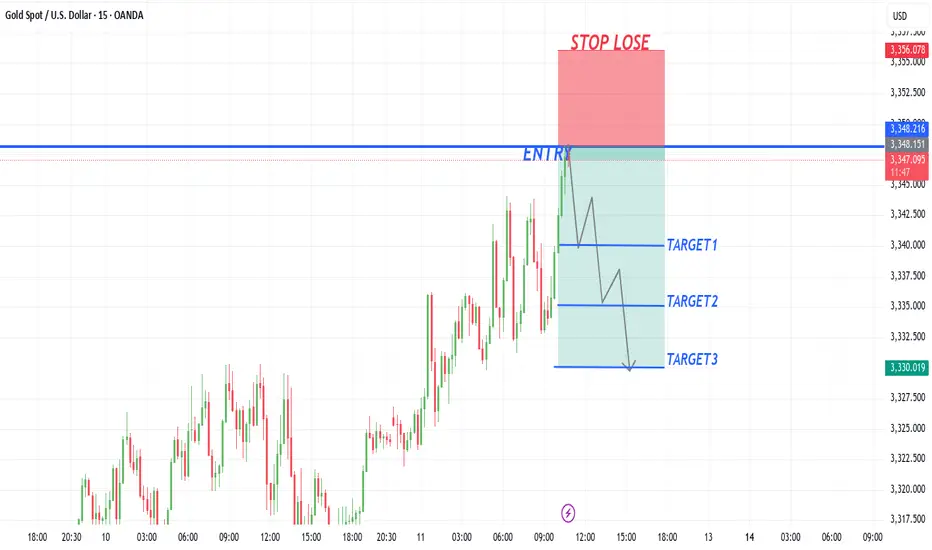
XAUUSD NEW LOOKXauusd sell from 3348
take profit1 3340
take profit2 3335
take profit3 3330
Stop lose 3356
Trade at your own risk
XAUUSD on spike needs to flip 3345Gold is currently holding Rangebound 3330-3345.
What's possible scanarios we have?
▪️looking for Buying if candle flips Above 3345 then keep buy set targets at 3365 then 3375.
Additional TIP:
Below 3330 I will Activate my resell and hold till 3315 then 3305.
All the entries should be taken if all the rules are applied
#XAUUSD
Gold Range pt.2Beautiful price action in the past 2 weeks. 3408$ is still my POI for a potential rejection to confirm that internal distribution. Im patiently waiting here for what's to come.
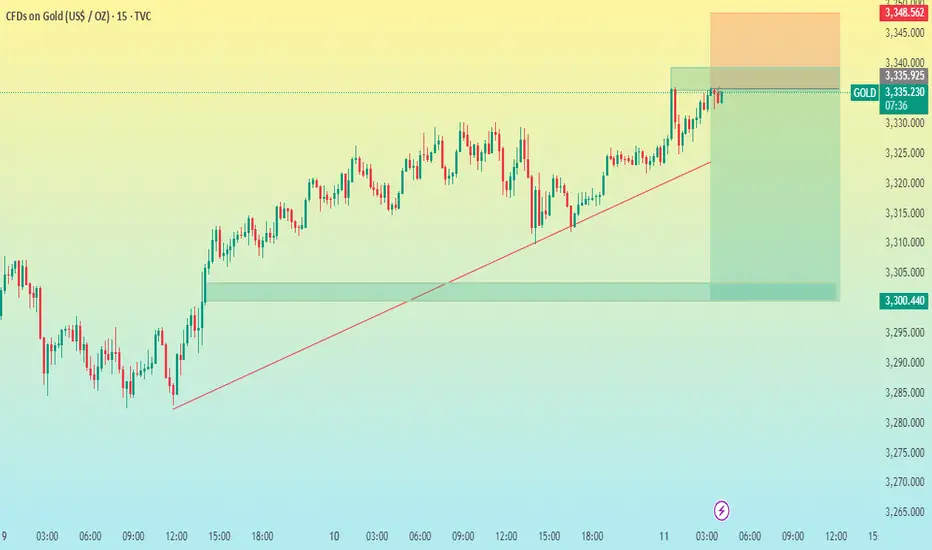
Gold Market Rebounds to 3330 – Eyes on Unemployment ClaimsGold market respawns to the 3330's in reaction to the 3285 mitigation, signaling a potential market correction ahead. With unemployment claims on the radar, traders anticipate more volatility and key sentiment shifts as the data unfolds. follow for more insights , comment and boost idea
XAU/USD 15M CHART PATTERNHere's a clear breakdown of your XAUUSD SELL trade setup:
---
🟠 Trade Type: SELL
Entry: 3334
✅ Take Profits:
1. TP1: 3325
2. TP2: 3315
3. TP3: 3300
❌ Stop Loss: 3348
---
🧮 Risk/Reward Summary:
Target Profit (pips) R:R (approx.)
TP1 9 0.64:1
TP2 19 1.36:1
TP3 34 2.43:1
> Stop loss is 14 pips above entry (3348 - 3334).
---
⚠ Quick Notes:
Make sure this aligns with your risk management strategy.
Entry at 3334 is quite close to a round resistance — monitor for reversals.
Use trailing stops if you'd like to lock in profit after TP1 hits.
Would you like a chart
XAUUSD Elliot waves update: What to expect?Bullish bias is still on. Price made impulsive wave 1 of lower degree and now we should expect price to continue up to test the upper trend line. There is also a possibility that the 4th wave is still in play and a possible triangle is about to be finished, however, this does not change our current bias to the upside. I am expecting price to drop to test the extreme order flow before continuing. To take advantage of the bullish move one need to find the entry around this extreme order flow marked with a rectangle. "Trade responsibly, this is not financial advice"
Gold Trading Strategy | July 10-11✅ Technical Analysis:
🔸 Confirmed Resistance at High Levels:
Gold was rejected around the 3328–3330 area, which aligns with our previous assessment of the upper boundary of the descending trend channel. This zone has acted as a key resistance area during multiple past rebounds and is once again proving to be a valid pressure point.
🔸 Consolidation Between 3310 and 3320 After Pullback:
Although gold has pulled back, it has not broken below 3310 decisively, indicating that while bears hold the advantage, there is still buying interest below. Structurally, the overall movement is still a "pullback–rebound–correction" pattern within a broader downtrend.
🔸 Bearish Alignment in the 1-Hour Moving Averages:
Short-term moving averages (MA10/20/60) are still aligned in a bearish formation, with lower highs in each rebound and no clear reversal signal from the candlesticks. The short-term trend remains tilted to the downside, with a higher probability of further pullback if the price fails to break resistance.
🔴 Key Resistance Levels: 3330 / 3345 / 3365
🟢 Key Support Levels: 3307 / 3300 / 3282
✅ Trading Strategy Reference:
🔰 If gold fails to break above the 3328–3330 resistance area, the strategy remains to sell on rallies.
🔰 First support to watch is 3307 / 3300. If 3300 is broken, downside could extend toward the 3282–3275 zone.
🔰 If gold later breaks and closes firmly above 3330 (with a strong bullish candlestick), then a short-term trend reversal is possible, and the next upside targets would be 3345–3365.
🔥 Reminder: Trading strategies are time-sensitive and should be adjusted in real time based on market conditions, especially after key support or resistance levels are broken. If you need more accurate and timely trading signals, feel free to reach out to me directly!
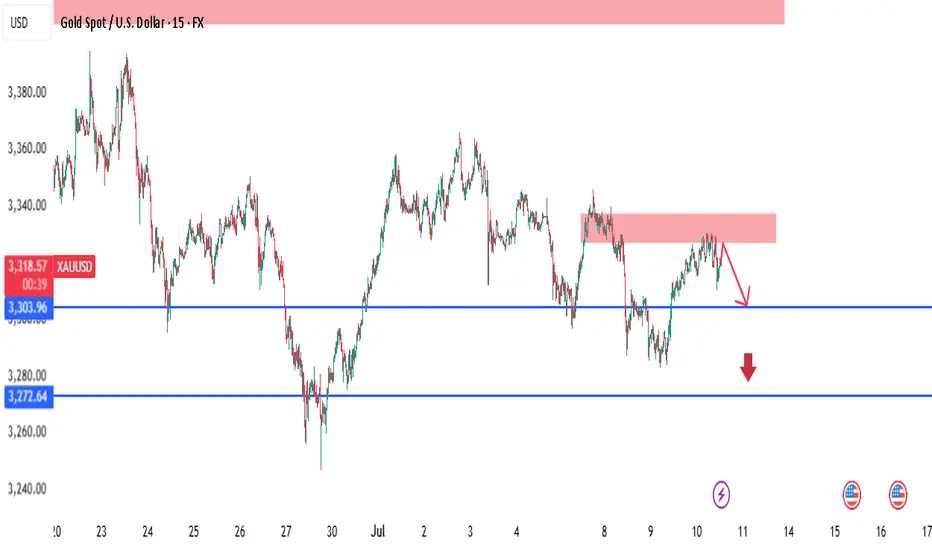
XAUUSD - Intraday SMC Bearish Setup | 15m ChartGold is currently reacting to a visible 15m supply zone after a bullish retracement. Price failed to break above the short-term supply (highlighted in red), showing signs of potential short-term reversal.
🔍 Key SMC Insights:
Supply Zone at 3318.47 – 3320 area is holding firm, with price showing clear rejection and lower highs forming.
Internal CHoCH already confirmed — suggesting short-term bearish order flow is active.
Liquidity Grab and rejection around the supply confirms smart money may be offloading positions.
Imbalance Below near 3303.96, with further inefficiency down to 3272.64.
📍Trade Idea:
Sell Entry: After a retest or failure to break above the 3318.47 zone.
Target 1: 3303.96 (near-term support and minor liquidity)
Target 2: 3272.64 (major liquidity zone + possible demand area)
Invalidation: Bullish break and close above 3320 would shift intraday bias.
⚠️ Monitor lower timeframes (1m–5m) for confirmation before executing trades. This setup aligns with the 4H bearish structure, enhancing confluence.
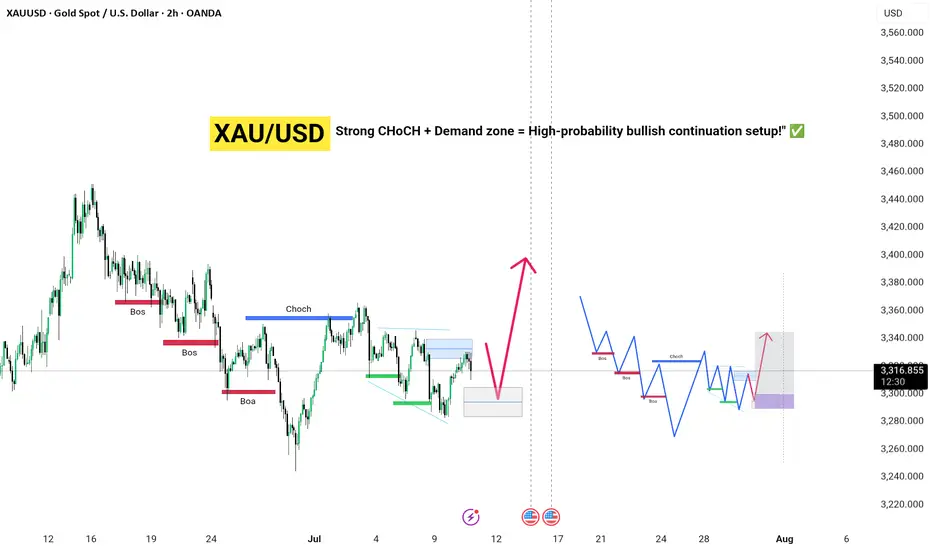
Bullish move , gold money Strong CHoCH + Demand zone = High-probability bullish continuation setup!" ✅
Key Highlights:
🔴 Multiple BOS confirm bearish trend continuation up to late June.
🔵 CHoCH on early July marks a potential bullish reversal zone.
📉 Price currently retracing into a demand zone (highlighted blue box) for potential long entries.
🔮 Expected bullish leg targeting the 3,350–3,400 zone before another possible correction.
🧠 Projected schematic aligns with Wyckoff accumulation + SMC concepts—anticipating further BOS and CHoCH as price unfolds.
📅 Watch for upcoming U.S. economic events that may influence volatility (shown with news icons).
📌 Bias: Bullish above demand zone | Invalidation: Clean break below demand and failure to hold above recent BOS.
Perfect prediction, pay attention to the high short entry pointTrump extended the tariff agreement to August 1 and began to collect tariffs again. Although it eased market tensions, his remarks will not be extended after the expiration, and he issued a tariff threat, which increased global trade uncertainty and pushed up risk aversion. There was no clear direction coming out of the Fed's meeting minutes last night, but the potential bias was bullish.
At the beginning of the Asian session this morning, I also indicated that gold would rise and then fall. At present, it has reached the highest point near 3325 and then began to retreat, but the 4H golden cross has just been formed. There is still a certain pressure above 3333. If the gold price repeatedly competes for this position, we can continue to short without hesitation. The second short position today is near 3340-3345. There is potential momentum for the bulls in the short term. If the European session continues to fluctuate below 3333, then the entry of short positions will be slightly more stable. Yesterday, short orders were given at the key points of 3321 and 3333, and TP looked at 3310. If the bulls re-emerge below 3310-3305, you can consider short-term long positions and target 3330-3335.
The decline in gold prices has not stopped. Do you know what to
Gold did not provide a better position to go long during the day, but continued to fluctuate, and was under pressure at 3330 many times. The short-term suppression was obvious, and the increase was limited. It is expected to usher in a decline today. Consider short-term short operations, pay attention to shorts near 3326, stop loss at 3334, and take profit at 3300. Pay attention to risks.
Short-term trading of gold in the evening of July 10: shorts near 3326, stop loss at 3334, take profit at 3306
Gold Bounces Strongly from the Bottom XAUUSD: Gold Bounces Strongly from the Bottom – Is This the Start of a Breakout?
🌍 Macro Overview – Gold’s Movement and Market Sentiment
Gold recently experienced a strong bounce from the 3.282 USD/oz low, reaching 3.317 USD/oz. This movement has sparked some optimism, but let’s take a look at the key macroeconomic factors that might be influencing gold:
📉 US bond yields have decreased, signaling that market risk aversion is returning
💵 The USD remains strong, but buying interest in gold in Asia is increasing as confidence in fiat currencies begins to wane
🇪🇺 The EU is accelerating negotiations with the US on tariffs ahead of the August 1st deadline. If these talks fail, gold could benefit
🏦 The Fed continues to maintain interest rates, but the market is betting on a potential rate cut in September if inflation remains controlled
📊 US unemployment data and the Fed's speech tonight will be key, as the market is anxiously waiting for clues on the Fed’s next move
📊 Technical Analysis – Gold Approaching Key Resistance Levels
Gold is trading within a descending channel, but there are clear signs of a potential breakout after testing the lows.
Key resistance levels are found around 3330 – 3340, which will be crucial for determining if gold can continue its upward movement.
The Fair Value Gap (FVG) has appeared between 3310 – 3320, suggesting that if buying pressure continues, a breakout above these levels is likely.
🎯 Trading Strategy for Today – Focused on Clear Entry Points
🟢 BUY SCALP:
Entry: 3310 – 3308
SL: 3304
TP: 3314 → 3318 → 3322 → 3326 → 3330
🔵 BUY ZONE (safer entry points):
Entry: 3290 – 3288
SL: 3284
TP: 3294 → 3298 → 3302 → 3306 → 3310 → 3320 → 3330
🔴 SELL SCALP (if price hits resistance levels):
Entry: 3335 – 3337
SL: 3342
TP: 3330 → 3325 → 3320 → 3315 → 3310 → 3300
⚫ SELL ZONE (strong resistance at 3360-3362):
Entry: 3360 – 3362
SL: 3366
TP: 3356 → 3352 → 3348 → 3344 → 3340 → 3336 → 3330
📌 Note:
Always set SL and TP appropriately to protect your account, especially in a market that might experience significant volatility today.
Watch volume during London and New York sessions to gain clearer insights into market direction. If gold breaks above resistance, a strong breakout could follow.
💬 Gold has bounced back strongly, but is this the start of a larger rally, or just a temporary correction? What’s your take on today’s trend? Share your thoughts in the comments below!
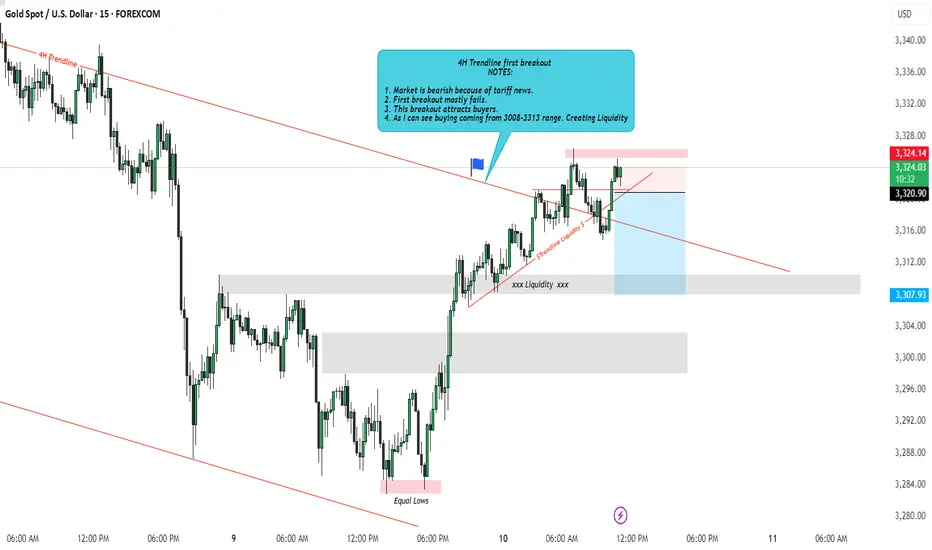
XAUUSD Idea: 4H Trendline First Breakout - Liquidity PlayFOREXCOM:XAUUSD
🔍 Analysis Overview:
Price has just broken above a 4H descending trendline for the first time. However, I remain cautious due to the following key observations:
📌 NOTES:
The broader market sentiment is still bearish due to recent tariff-related news, which often fuels risk-off behavior.
Historically, the first breakout of a strong trendline often fails, trapping early buyers.
This breakout is likely attracting buy-side liquidity, giving institutions an opportunity to hunt stops.
My observation shows buying interest started around the 3308–3313 range, suggesting smart money accumulation and a possible trap.
📉 I'm watching for a fake breakout and potential reversal targeting the liquidity zones marked below around 3307 and possibly lower.
The liquidity sweep below equal lows could offer a better risk-reward setup.
💡 Conclusion:
If price fails to hold above this breakout and shows signs of rejection, I will be anticipating a return towards the previous demand zone for a liquidity grab.
#XAUUSD #GoldAnalysis #SmartMoneyConcepts #LiquidityGrab #ForexTrading #TrendlineBreak #MarketPsychology #TradingSetup #SMC #PriceAction
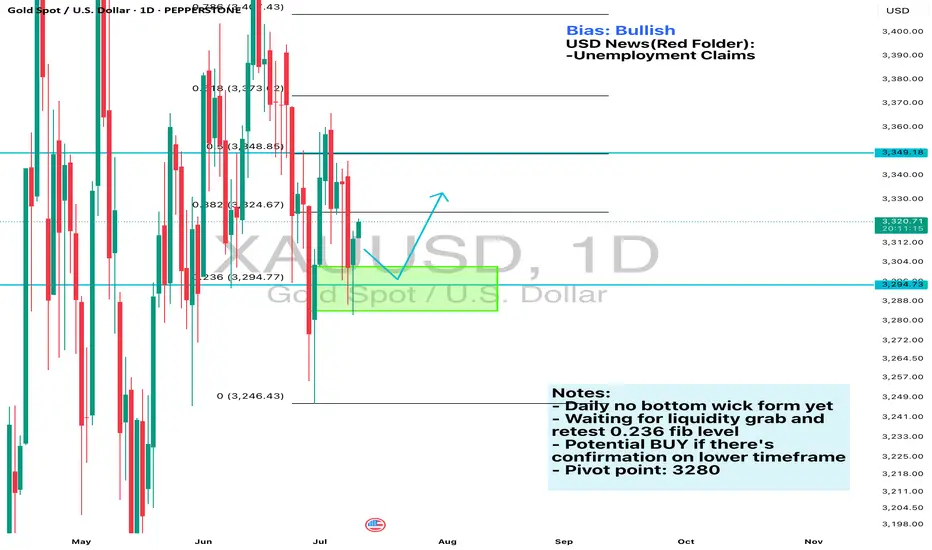
Daily Analysis- XAUUSD (Wednesday, 9th July 2024)Bias: Bullish
USD News(Red Folder):
-Unemployment Claims
Notes:
- Daily no bottom wick form yet
- Waiting for liquidity grab and
retest 0.236 fib level
- Potential BUY if there's
confirmation on lower timeframe
- Pivot point: 3280
Disclaimer:
This analysis is from a personal point of view, always conduct on your own research before making any trading decisions as the analysis do not guarantee complete accuracy.
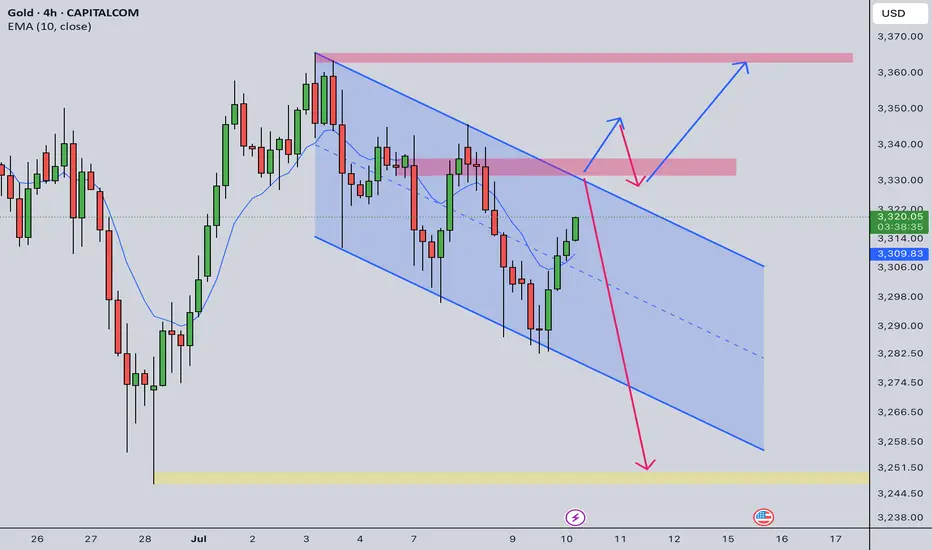
Gold Intraday Trading Plan 7/10/2025Gold has been very choppy recently. It seems not having any clear direction. Although in weekly post I am bearish in short term, there is lack of momentum for it to go down. Currently it is traded within a channel indicated in the chart. I am going to trade on the channel top.
If the channel holds, I will sell around 3330, towards 3250. If the channel top is broken, I will buy upon retest, towards 3365.