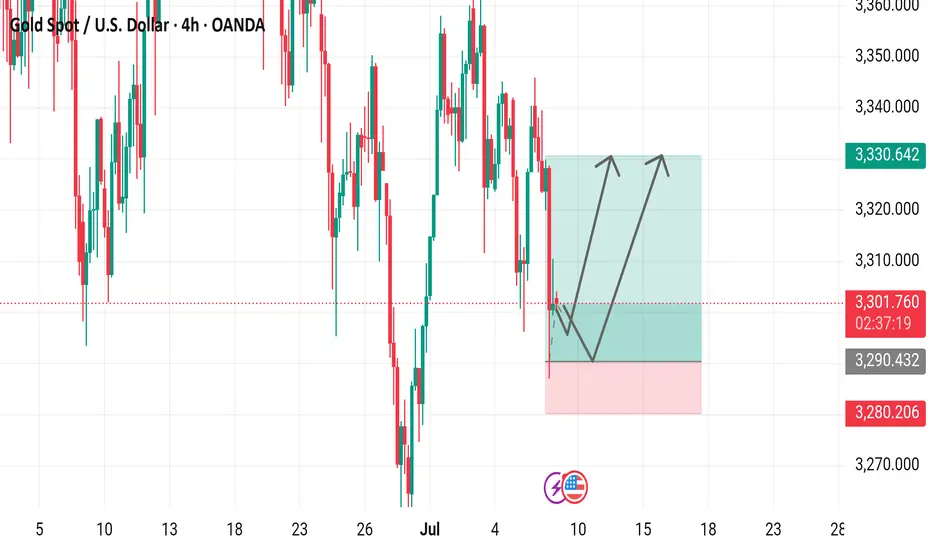
XAUUSDHello traders,
The Gold trade I shared last week has just hit TP. Based on current market conditions, I believe gold may continue its downward movement for a while. Therefore, I’m still holding a bearish bias and have just activated a new sell trade, which I’d like to share with you as well.
🔍 Trade Details
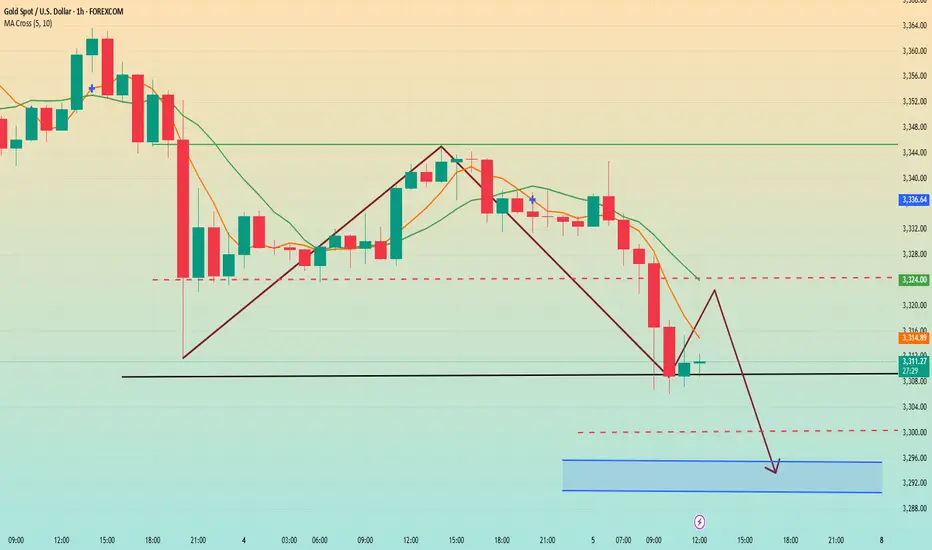
✔️ Timeframe: 1-Hour (H1)
✔️ Risk-to-Reward Ratio: 1:3
✔️ Trade Direction: Sell
✔️ Entry Price: 3310.11
✔️ Take Profit: 3266.76
✔️ Stop Loss: 3324.51
🔔 Disclaimer: This is not financial advice. I’m simply sharing a trade I’ve taken based on my personal trading system, strictly for educational and illustrative purposes.
📌 Interested in a systematic, data-driven trading approach?
💡 Follow the page and turn on notifications to stay updated on future trade setups and advanced market insights.
XAUUSDG trade ideas
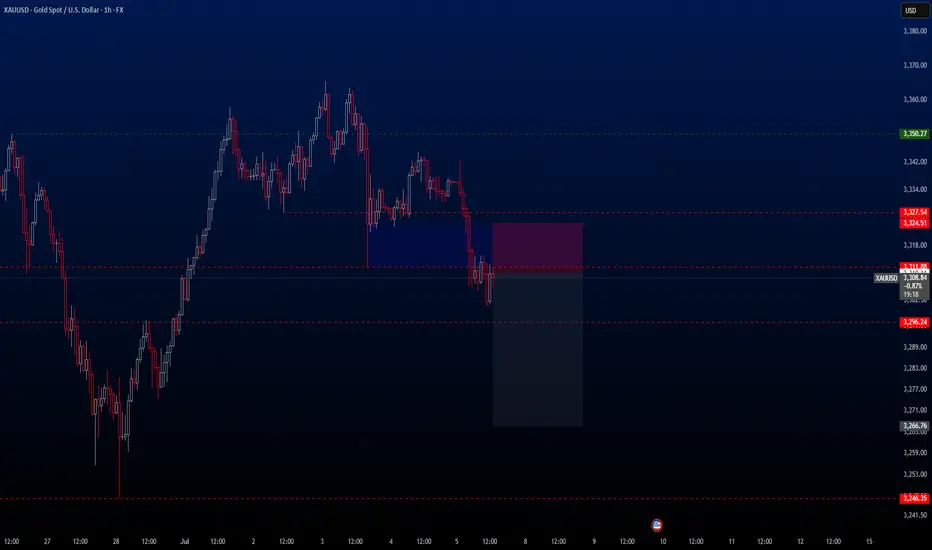
Technically is Bearish the chart that I shared on Sunday that prediction was according to fundamentals but now technically we are bearish ... if the until TRUMP announce the terriff may be in NY open... so our PRICE ACTION is right now bearish that sunday's chart is invalid for now
Gold Trading Strategy for next Monday✅From the current short-term structure, gold is exhibiting a typical bearish continuation pattern, indicating that the primary trend remains downward. If gold fails to effectively break above the key resistance level at 3350 next week, it suggests that the prevailing downtrend is likely to continue. The probability of a short-term rebound being capped in this area is relatively high.
✅On the downside, attention should first be given to the 3310 level, which serves as a critical short-term support. A break below this level could open the door for a further decline toward the 3280–3250 zone, where traders should watch for potential bottoming signals or signs of strong support.
✅From the 1-hour chart perspective, short-term moving averages are beginning to turn lower, indicating weakening bullish momentum. Technically, a double top formation has developed, and the price has broken below the neckline, showing a lack of rebound strength. Despite a minor rebound to around 3345 yesterday, the price once again faced resistance and moved lower, reflecting a weak consolidation phase.
✅As such, the 3345–3350 area will be a critical short-term resistance next week. If the market opens higher due to bullish news over the weekend and breaks above this region, gold could regain upward momentum. Conversely, if the price remains suppressed under 3345–3350 and only shows weak rebounds, short-selling opportunities may arise near this zone.
✅Short-Term Trading Strategy:
Main strategy: Sell on rallies, buy on dips
🔴 Resistance level: 3345–3350
🟢Support level: 3310–3315
🔰If 3310 is broken, the next support area is 3280–3250.
✅Overall, unless gold breaks above key resistance, the outlook remains moderately bearish with a consolidation bias. Traders are advised to remain flexible and adjust their strategies in response to market news and developments.
✅If your recent trading results haven’t been ideal, feel free to reach out. I’d be happy to help you avoid common pitfalls and improve your performance. I will provide real-time strategy updates during market hours based on price action — stay tuned.
XAU/USD: Today's Strategy AnalysisVerification of Support Level Effectiveness
- $3306: As the 0.5 retracement level of the 3247-3365 band Fibonacci, it rebounded slightly after being first touched today. It is necessary to monitor whether a bullish candlestick stabilization signal forms at this level. If broken, the next target is $3290.
- $3290: Overlapping with the lower Bollinger Band support of the 4-hour chart, if a pullback signal with shrinking trading volume appears here, it can be regarded as a short-term long opportunity.
Suppression Effect of Resistance Level
- $3320-$3325: The suppression zone of the 5-day moving average at the 1-hour level, which is also near the early session rebound high. If the price is resisted and closes bearish when rebounding to this range, it confirms a short entry opportunity.
-
Operation Tips
Strictly set stop-loss orders to avoid capital drawdown caused by false breakouts of support/resistance levels.
XAUUSD
buy@3285-3295
tp:3310-3320
sell@3315-3325
tp:3305-3295
I am committed to sharing trading signals every day. Among them, real-time signals will be flexibly pushed according to market dynamics. All the signals sent out last week accurately matched the market trends, helping numerous traders achieve substantial profits. Regardless of your previous investment performance, I believe that with the support of my professional strategies and timely signals, I will surely be able to assist you in breaking through investment bottlenecks and achieving new breakthroughs in the trading field.
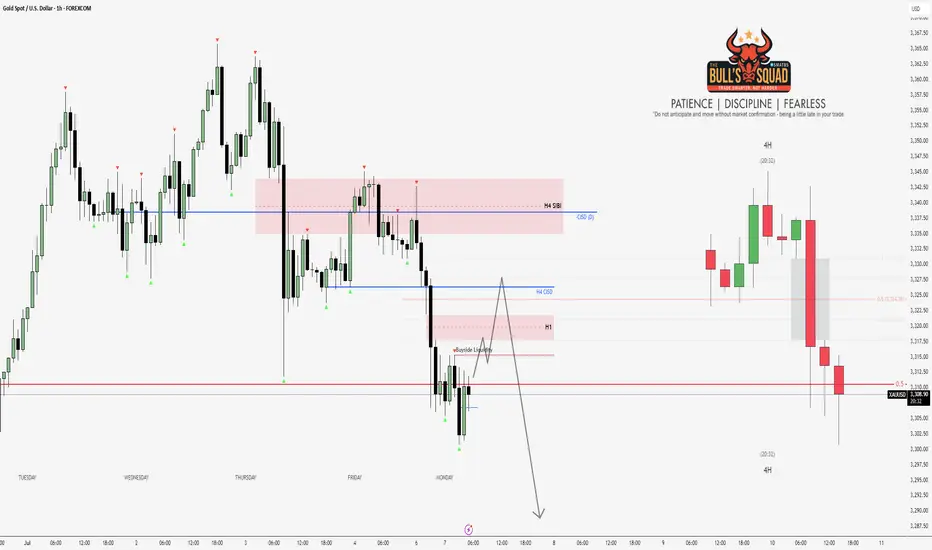
The bill was introduced; the price did not rise but fell.Due to the implementation of the US bill, most traders in the market are bullish on gold and believe that gold will soar on Monday. As a result, it jumped up and fell sharply this morning. This is the uncertainty of the market. Although the short position given near 3340 last Friday was late, it fell to the low point of 3306 at the opening of the Asian market today.
In addition, the key to this sharp drop is the high point before the rebound, that is, the starting point or the position of the top and bottom conversion. Once it is broken, you have to change your mindset. The volatile market is like this, just get used to it. The turmoil caused by Trump's bill will not appear for a while. It takes a process and cannot be unilaterally considered as bullish or bearish.
In the early Asian market, the price fell all the way from 3342 US dollars to 3306. How to judge the end of the decline? It is to stare at the high point of the rebound before the last decline of 3320 US dollars. The loss of 3300 US dollars in the early trading indicates that the gap-up opening is a lure for more.
Today, I think that 3325 above 3320 can be used as the dividing point between long and short positions. You can short with a light position near 3315, and pay attention to the 3295-3290 line below. After the upward breakthrough is confirmed, consider adjusting the position and making other arrangements. For the time being, we will look at the weak adjustment during the day.
Gold showing early sign of Consolidation?
Gold not respecting both Bullish and Bearish FVG (PD arrays). Both Bearish and Bullish Rejection taken out (ranging between 3300-70). Wait before execution price action to be clear .
XAUUSD Elliotwaves update: Is wave 4 complete?The view we had in past three weeks was a possibility of complex 4th wave and our short term bias was bearish. But price reacted and closed above 61.8 Fibonacci retracement level and therefore changed our bias to bullish(Technically 4th wave is complete). Another confluence was a clear 5 waves after the reaction on the 61.8 fib. Now two possibilities, either wave 2 is complete and we should expect price to continue up from current price level or a possibility of double 3 to push price down to atleast 61.8 Fib before continuation to the upside. To take advantage of this anticipated move a trader should either wait for price to drop to the golden zone or wait for price to breach the immediate high and retest.
my major look outs on GOLD,.....WEEKLY AND DAILY TREND is on a strong uptrend....which prices has tested so i'm looking for the macro fundamentals to align with my technical before i look forward to going extra bullish on gold
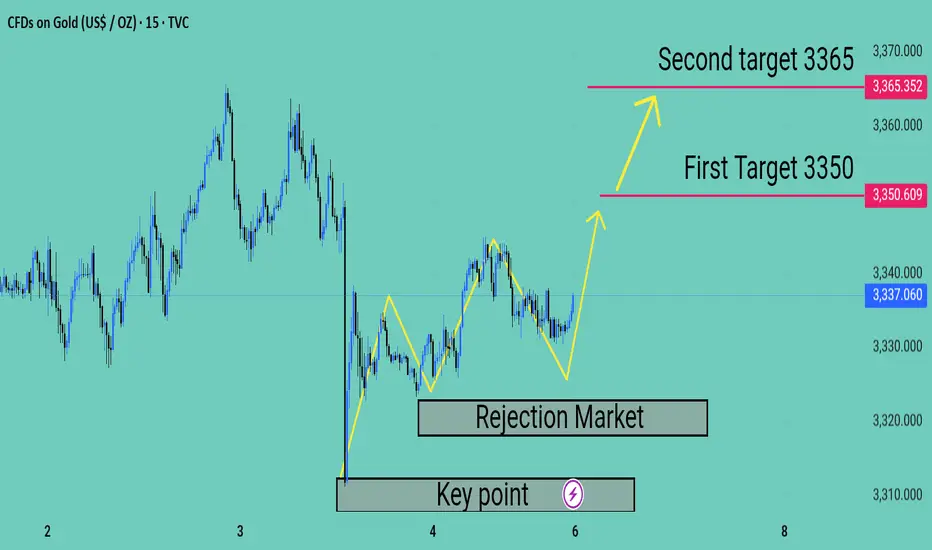
Xauusd Expecting bullish Movement Market I have identified a potential bullish setup based on key rejection zones and target levels
First Rejection Area 3325
Second Rejection Area 3310
First Target 3350
Second Target 3365
Price has shown strong support around the 3310–3325 zone, indicating possible buyer interest. If the market holds above this support range, we could see a move toward the 3350 and 3365 resistance levels
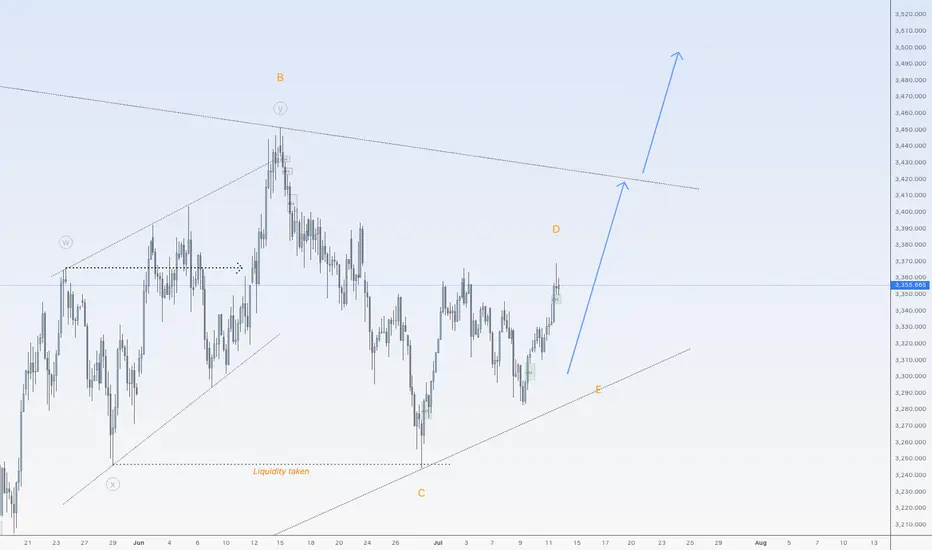
Gold is ready to go up againHi traders,
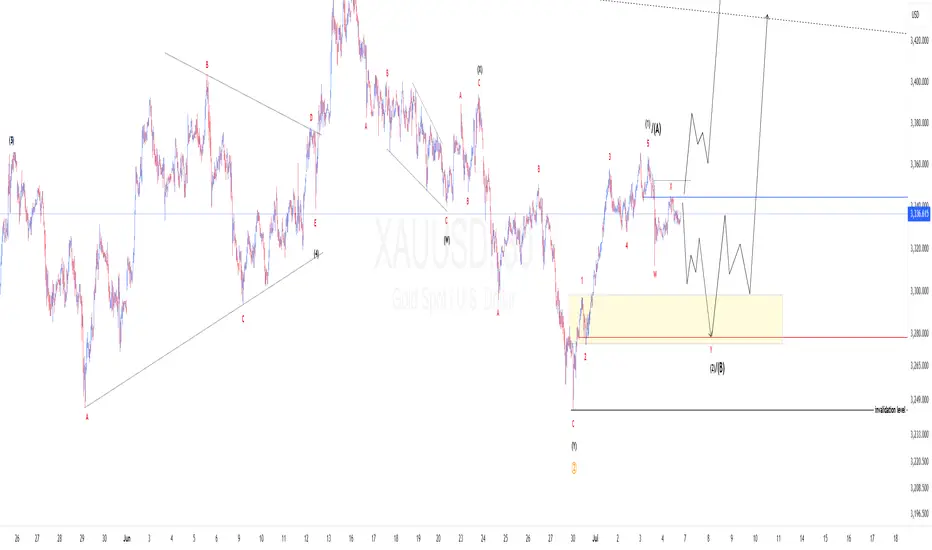
Last week gold went up again after a correction to finish (orange) Wave D just as I've said in my outlook.
Next week we could see another move down for Wave E and after that the next impulsive wave 5 up.
Or the last correction down was already wave E and gold started the next impulsive wave up.
In both cases gold will shoot up after a correction down.
Let's see what price does and react.
Trade idea: Wait for a small correction down on a lower timeframe and a change in orderflow to bullish to trade longs.
If you want to learn more about trading FVG's & liquidity sweeps with wave analysis, please make sure to follow me.
This shared post is only my point of view on what could be the next move in this pair based on my technical analysis.
Don't be emotional, just trade your plan!
Eduwave
Gold Weekly Report Conclusion: Continue to be bullishGold Weekly Report Conclusion: Continue to be bullish
I. Market Review This Week
Under pressure in the first half of the week: Affected by the strengthening of the US dollar, the gold price once fell below 3,300 points.
Rebound in the second half of the week: As the Trump administration announced new tariffs on Canada, market risk aversion increased, and the gold price rebounded to above 3,350 points and finally closed at 3,355 points.
Review of key influencing factors:
Federal Reserve policy expectations: The market still expects a possible rate cut in September, but some officials expressed hawkish views, resulting in short-term fluctuations in gold prices.
Geopolitical risks: US-Canada trade frictions and tensions in the Middle East support safe-haven demand.
Central bank gold purchases: The People's Bank of China has increased its gold holdings for eight consecutive months, and the global central bank's gold purchase trend has not changed.
II. Analysis of gold trend next week
1. Fundamental outlook
(1) Federal Reserve policy and US dollar trend
Next week, focus on the speech of Federal Reserve Chairman Powell (July 16) and US June retail sales data (July 17).
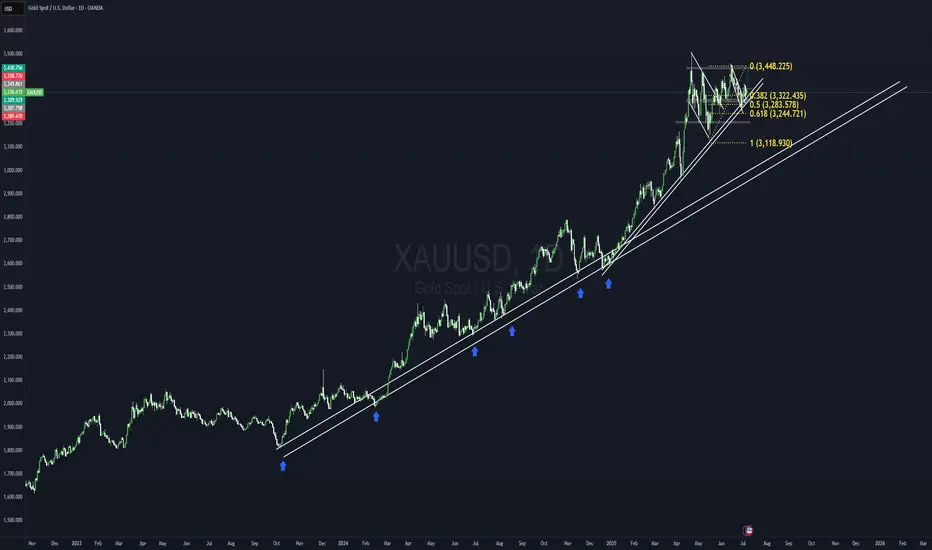
If retail data is weak, it may strengthen expectations of a rate cut in September, which is good for gold. On the contrary, if the data is strong, the US dollar may rebound, suppressing gold prices. The US dollar index (DXY) is currently around 104.5. If it falls below 104, gold may rise further. (2) Geopolitical risks: US-Canada trade friction: If the conflict escalates, safe-haven buying may continue to support gold prices. Middle East situation: Progress in Iran nuclear negotiations and Red Sea shipping safety are still potential catalysts. (3) Central bank gold purchases and institutional holdings: The global central bank's gold purchase trend has not changed. China, Poland and other countries are still increasing their holdings, which will support gold prices in the long term. ETF holdings: SPDR Gold ETF holdings increased by 5.3 tons last week, indicating that market sentiment has warmed up. Technical analysis: (1) Short-term trend (daily chart) Key support levels: 3300 (psychological support level), 3277 (trend line support level). Key resistance levels: 3373 (61.8% Fibonacci retracement level), 3400 (psychological barrier).
Moving average system: 50-day moving average (3330) provides support.
If it stands at 3350 points, it may challenge 3400 points.
MACD indicator: The fast and slow lines form a golden cross, the momentum column turns strong, and the short-term trend is bullish.
(2) Medium-term trend (weekly chart)
The rising channel is maintained, and the long-term trend is still bullish.
Key resistance: 3452 (previous high point), which may open up upward space after breaking through.
Key support: 3247 (61.8% retracement level), if it falls below, it may enter a macro adjustment.
III. Trading strategy for next week
1. Bullish scenario (breakthrough 3373 points)
Entry conditions: Stand firm at 3373 points, and the US dollar weakens.
Target: 3400→3452.
Stop loss: below 3340.
2. Bearish scenario (falling below 3300)
Entry conditions: falling below 3300 and the US dollar rebounding.
Target: 3277→3247.
Stop loss: above 3320.
3. Oscillating strategy (3300-3373 range)
Buy low and sell high, pay attention to the competition around 3350.
Conclusion
Short term (next week): Gold prices may fluctuate in the range of 3300-3373, pay attention to the speech of the Federal Reserve and retail data.
Breakout direction: If it stands at 3350, it is expected to test 3400; if it falls below 3300, it may fall to 3277.
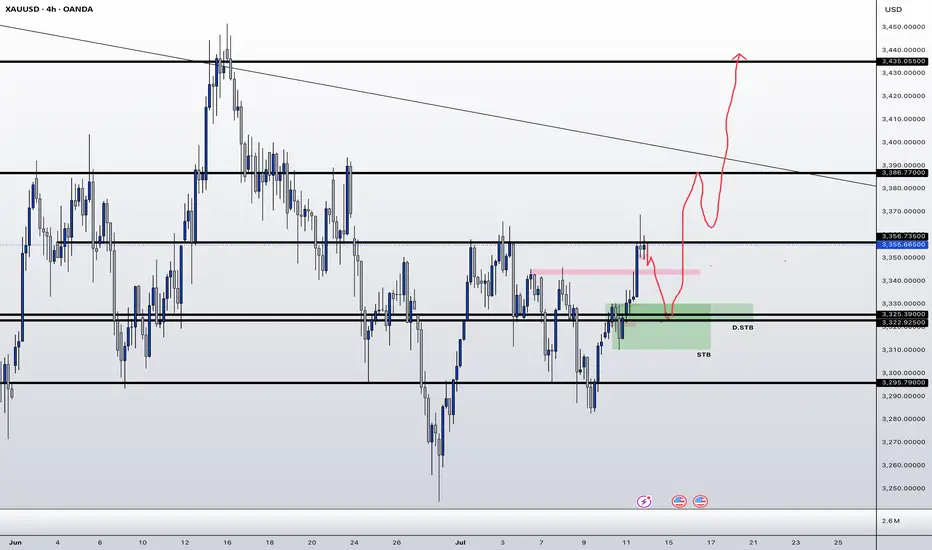
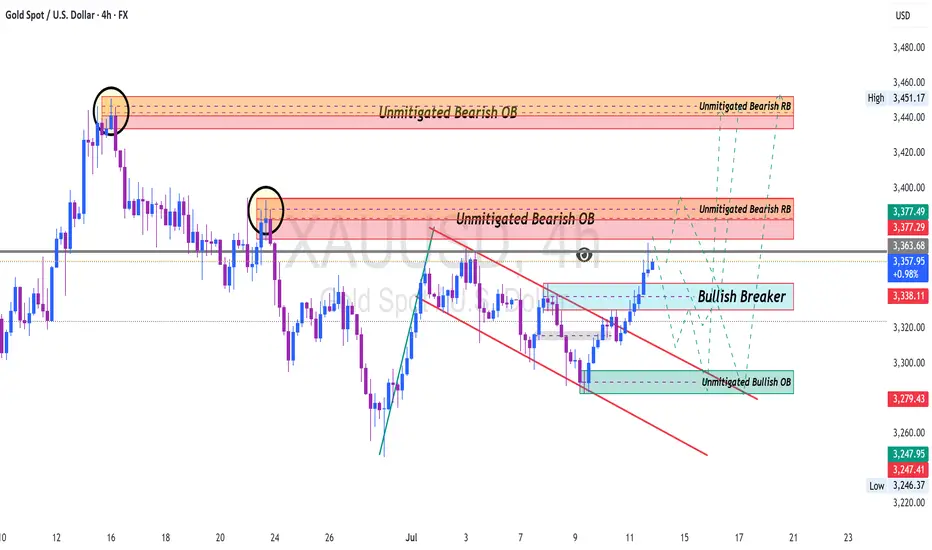
Gold will retest $3,451 in the coming week I my opinion that based on my 4H analysis, Gold will retest $3,451 in the coming week but we need to pay attention to those daily key support zones. Gold usually does deep retracement and that makes the unmitigated Bullish OB a good zone for patient buyers/ Play safe.
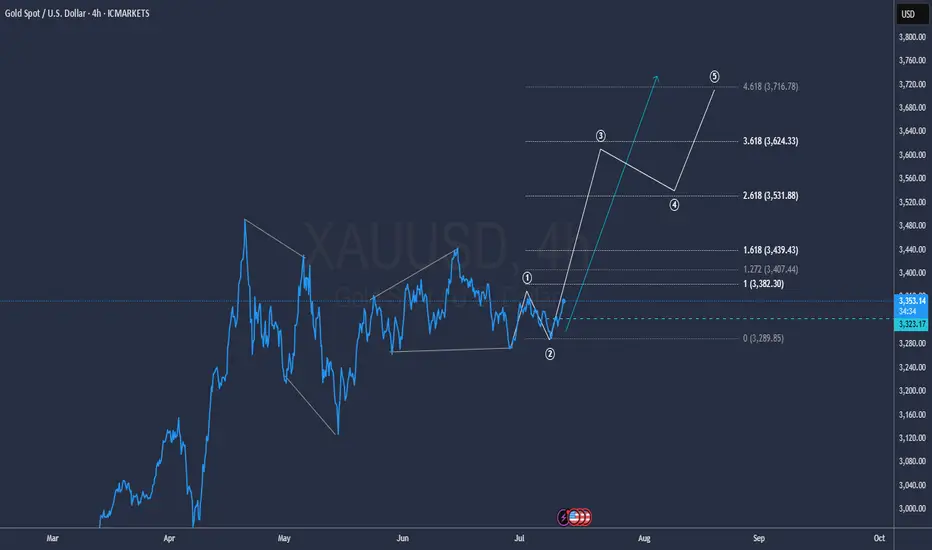
GOLD to the MoonHiper Clear Structure and the beginning of a new impulse towards 3.600 and 3.700
Hope everybody had a chance to got in
gg
Elliott Wave Analysis – XAUUSD July 11, 2025
🔍 Momentum:
D1 timeframe: Momentum is currently rising, suggesting that the bullish trend is likely to continue for the next few days.
H4 timeframe: Momentum is also bullish, indicating that the uptrend is likely to dominate today.
🌀 Elliott Wave Pattern:
On the H4 chart, price action is in the final stage of a contracting triangle correction.
Price is now approaching the upper boundary of the triangle. With both D1 and H4 momentum in alignment, the probability of a breakout to the upside is high.
If this breakout occurs, we can expect a move toward the 3393 area, which is a key level to confirm whether the corrective phase has truly ended.
🎯 Price Targets:
Current area (3330–3332): A potential opportunity for a scalp BUY, supported by bullish momentum on H4.
Next support zone: 3315–3317 – a solid area for a mid-term BUY entry if there’s a pullback.
⚠️ If price breaks below 3279, the current wave count becomes invalid and a new analysis will be provided.
✅ Trade Plan:
🔹 SCALP BUY
Entry: 3332 – 3330
SL: 3327
TP1: 3363
TP2: 3390
🔹 MID-TERM BUY ZONE
Entry: 3317 – 3315
SL: 3307
TP1: 3342
TP2: 3363
TP3: 3390
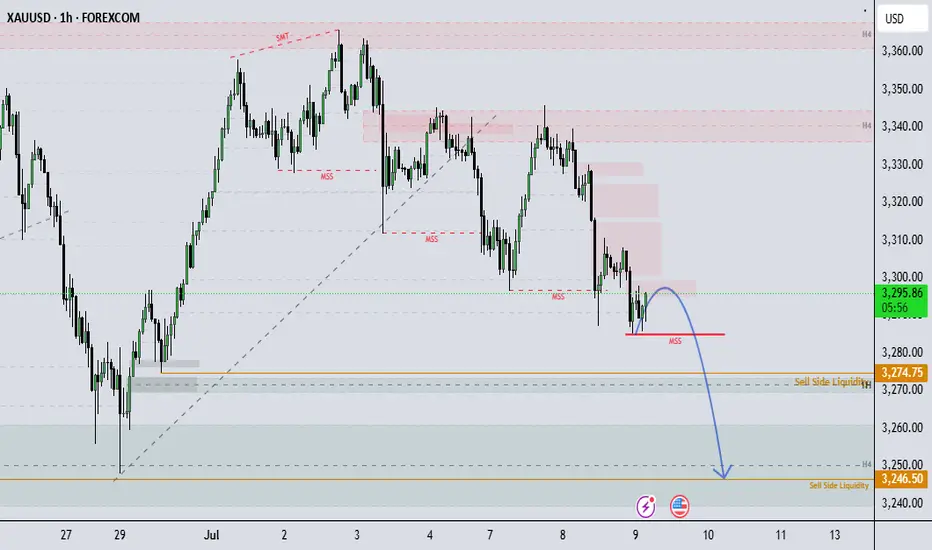
"Gold (XAUUSD) is moving down to grab liquidity."Looking for Impulse Down.
Gold/XauUsd: This chart shows a clear Market Structure Shift (MSS) following a liquidity sweep (SMT) near the highs. Price is now respecting a bearish order block and forming lower highs, indicating smart money distribution.
Targeting sell-side liquidity at 3274.75 and 3246.50. Until price reclaims the most recent supply (above 3,300), the bearish bias remains intact.
Educational Use Only: This breakdown is for study and informational purposes and is not financial advice.
Learn & Earn!
Wave Trader Pro
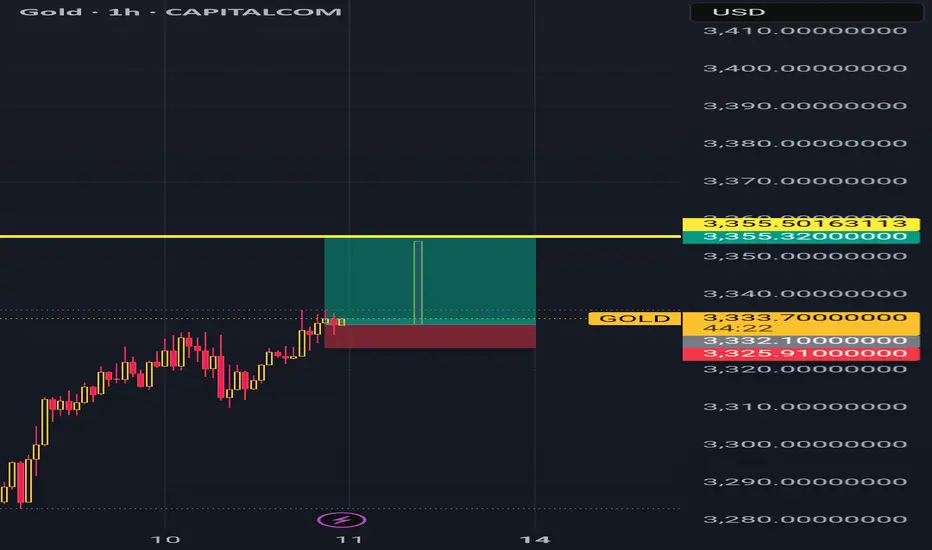
Do you think we are in a long position?According to the chart you can see, I am in a long position up to the $3355 range.
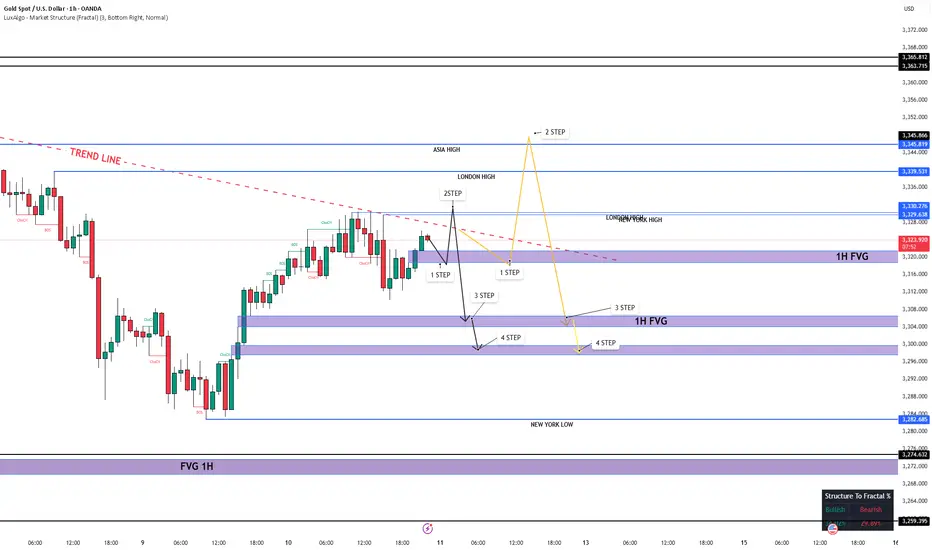
XAU/USD 1H Outlook
FVG Fill (3320–3318)
Price is expected to drop into the unfilled Fair Value Gap between 3320 and 3318.
London/NY Liquidity Hunt
After filling the FVG, look for a swift bullish impulse during the London and New York sessions to trigger stop-runs and collect liquidity.
Downward Correction to 3305 & 3298
Once the liquidity grab completes, expect a retracement:
First target: 3305
On a break below 3305, next target is the unfilled FVG at 3298
Summary:
Drop → FVG fill (3320–3318) → Bullish liquidity hunt (London/NY) → Retracement toward 3305 (then 3298)
short gold week The market is at a point where we must sell, it's at a maximum of Elliott Waves, wave 5 is already extremely extended, so prepare for a mega drop of several weeks while everyone continues to buy at the lows, it will continue to go down. In summary, we have a bullish market on H4, now there will be a correction on H1, that is, a bearish trend on H1 for several weeks; it is not an ABC, but 5 bearish waves.
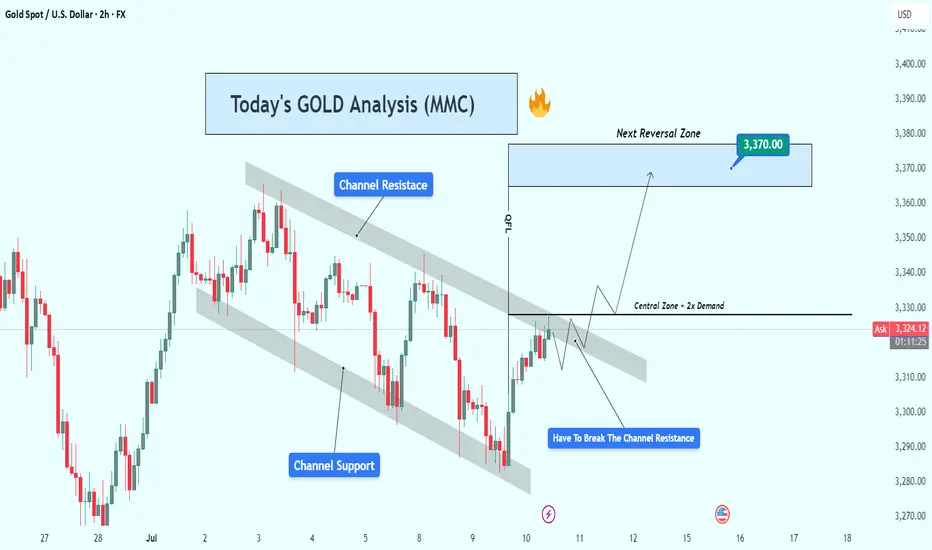
Gold (XAUUSD) Analysis : Bullish Structure Setup + Target🧠 Gold (XAUUSD) Technical Analysis
Gold has recently been trading within a clearly defined descending channel, which has governed price action over the past several sessions. This structure is characterized by a series of lower highs and lower lows, forming well-established channel resistance and channel support levels. However, recent bullish pressure has led price to aggressively test the upper boundary of this channel, signaling the potential for a structural breakout.
We are now at a technical inflection point, where a successful breakout and retest could mark the beginning of a significant trend reversal and short-to-medium term bullish move.
🔍 Key Technical Levels & Zones
🔷 Channel Resistance (~3,325)
The price is currently testing the descending trendline acting as channel resistance.
This area has previously rejected price several times, increasing its significance.
A confirmed break and close above this level may shift the market bias from bearish to bullish.
🔷 Central Zone – Dual Demand (~3,325–3,330)
This horizontal zone intersects with the channel resistance and aligns with two previous demand zones, now acting as a key decision area.
The market must validate this zone as new support before any sustained upward movement can occur.
🔷 Next Reversal Zone – Target (~3,370)
The next major area of interest lies around 3,370, a zone identified by previous swing highs and visible liquidity pools.
This level is likely to act as a magnet for price if bullish structure is confirmed.
📈 Price Structure Outlook
The potential breakout is supported by a strong bullish impulse off the channel support, followed by a series of higher lows suggesting growing bullish momentum. The projected movement scenario is as follows:
Break above the channel resistance
Retest and confirm the central zone as support
Continuation toward the 3,370 reversal zone
This would complete a classic break–retest–continuation pattern.
✅ Trade Considerations (Not Financial Advice)
Entry Type Entry Condition Target Stop Loss
Aggressive Break & 2H close above 3,330 3,370 Below 3,320
Conservative Retest & bullish confirmation above 3,325 3,370 Below 3,310
Risk Management:
Use position sizing aligned with your risk tolerance (max 1–2% per trade).
Monitor volume closely during breakout and retest for confirmation.
⚠️ Invalidation Scenario
If price fails to break above the channel and is rejected strongly, especially with a bearish engulfing or long upper wick, the downside could resume. In such a case, price may revisit the channel midline or even the lower boundary around 3,290.
📝 Summary
Gold is at a critical juncture, testing long-standing channel resistance.
A break above and successful retest of the 3,325–3,330 zone could lead to a rally toward 3,370.
This setup reflects a potential shift in structure from bearish to bullish on the 2H timeframe.
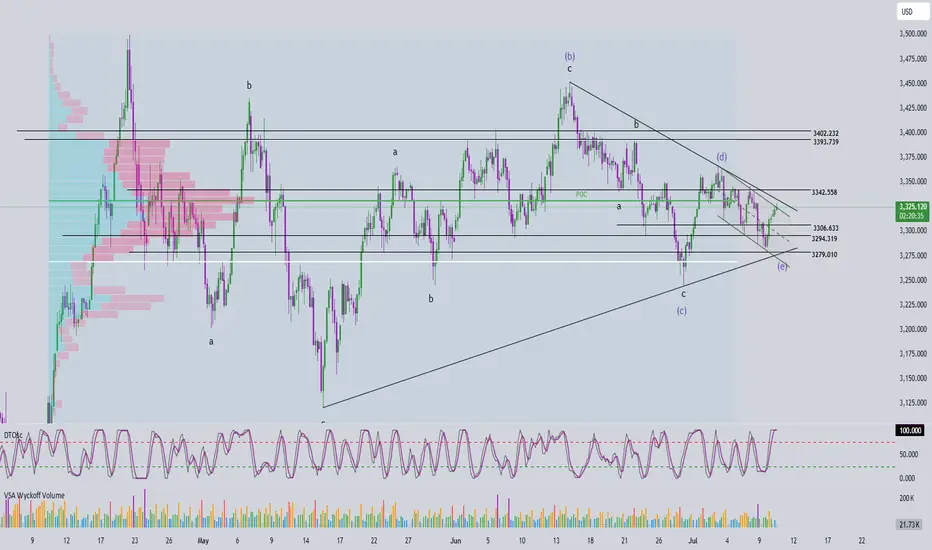
Elliott Wave Analysis – XAUUSD July 10, 2025
🌀 Elliott Wave Structure
On the H4 timeframe, price has returned to test the upper boundary of the converging triangle – currently acting as dynamic resistance. Based on the current wave count, wave e (purple) may have completed at the 3279 low, and price is potentially starting a breakout move.
👉 A confirmed breakout above the triangle would validate the end of the abcde correction and mark the beginning of a new upward trend.
🔋 Momentum Analysis
D1 timeframe: As forecasted yesterday, momentum is entering oversold territory and showing early signs of a reversal. This suggests that an upward trend could dominate over the next 5 days.
H4 timeframe: The two momentum lines are sticking together, indicating a weakening upward drive. A minor pullback may be needed before the next leg up. Key nearby resistance levels to watch are 3330 and 3342.
🎯 Key Price Levels & Validation Zones
The following support zones are crucial for identifying potential entries:
Support Zone 1: 3306 – 3308
Support Zone 2: 3294 – 3297
‼️ Important: A break below 3294 would invalidate the current wave structure, and a new count would be required.
📌 Trade Plan
Scenario 1 – Buy at higher support:
Buy Zone: 3308 – 3306
SL: 3303
TP1: 3342
TP2: 3366
TP3: 3390
Scenario 2 – Buy at deeper support (if stronger correction occurs):
Buy Zone: 3297 – 3294
SL: 3287
TP1: 3342
TP2: 3366
TP3: 3390
Scenario 3 – Safer option (breakout confirmation):
Wait for a breakout above the triangle, then enter on the retest (around 3325–3330)
SL: Based on structure formed during the retest
TP range: 3366 – 3390
📌 Preferred strategy: Wait for H4 to reach oversold or wait for a confirmed breakout and retest to enter safely in alignment with the new uptrend.
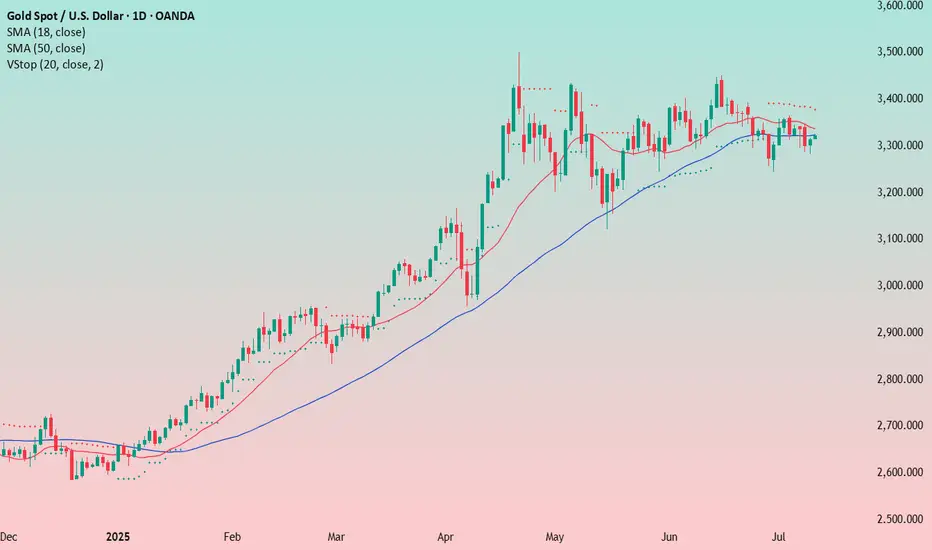
Gold on Hold: Consolidation Without a SignalGold is holding up well for now and consolidating at the current level. But there’s no clear opportunity to buy or sell. It’s just guesswork at this point. And why would I need that? I want to make money, not to be "right."
On a global, long-term horizon (up to a year), I believe the metal will go higher. On the daily and weekly charts, the trend is still upward, and both geopolitical factors and the Fed’s rate policy support the continuation of the trend. But when exactly will it happen? That’s unclear. For now, there are no setups for a trade.
Interestingly, gold and other precious metals might move in different directions. Gold could start a correction while other metals could rise, as they are undervalued. But undervaluation isn’t a direct reason to buy. It’s always better to follow this rule: the market knows better than all of us what the fair price should be right now. Still, when it comes to entering a position, my opinion that the metal is undervalued can be taken into account—and if there’s a proper setup, the entry can be made. It’s like a puzzle. One factor is one piece, then another, and another—and once the full picture comes together, that’s when we enter the position.
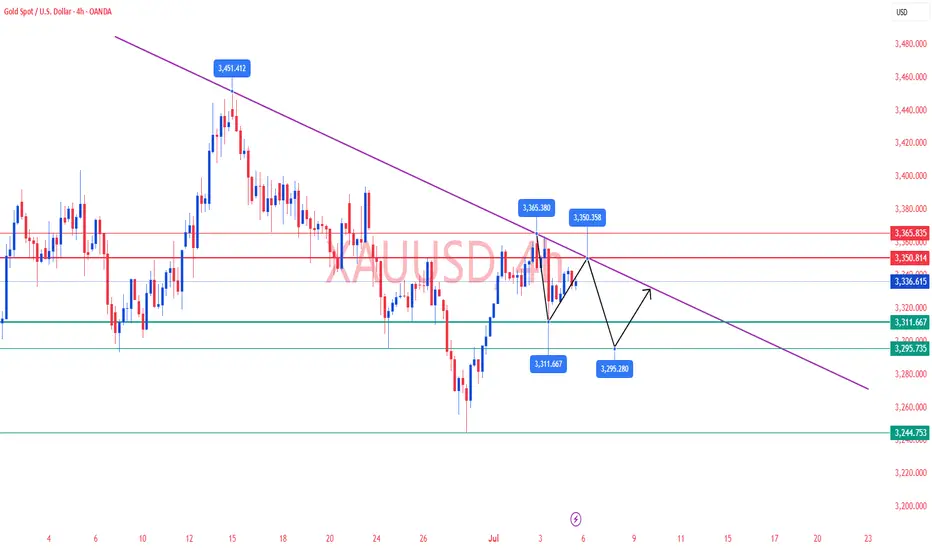
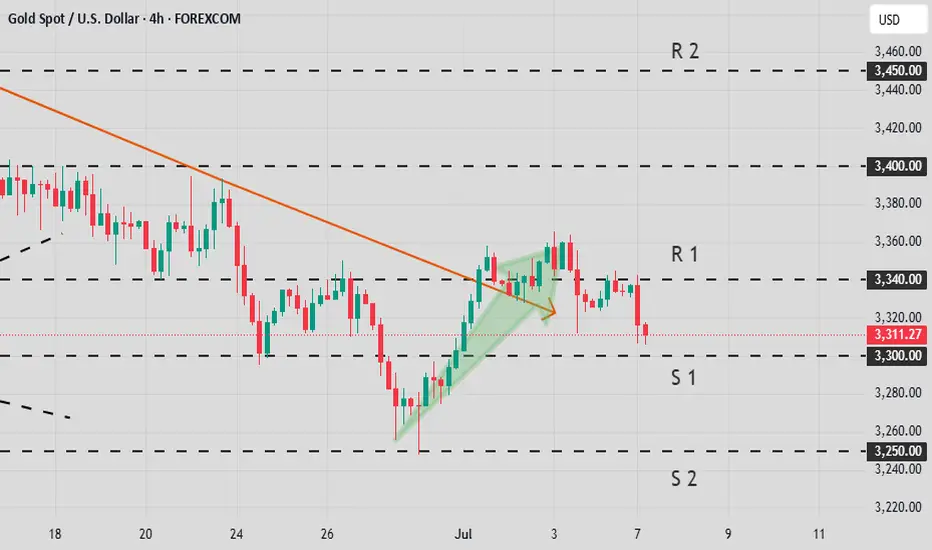
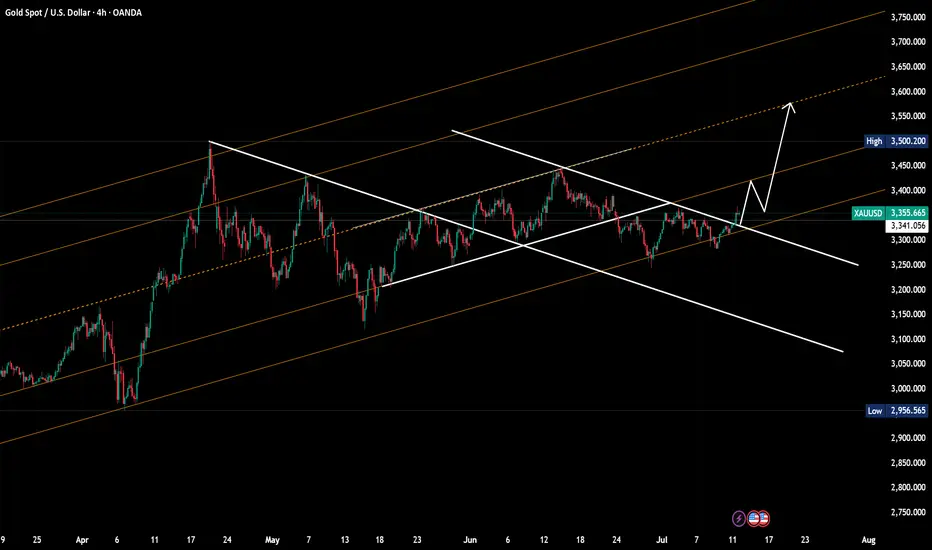
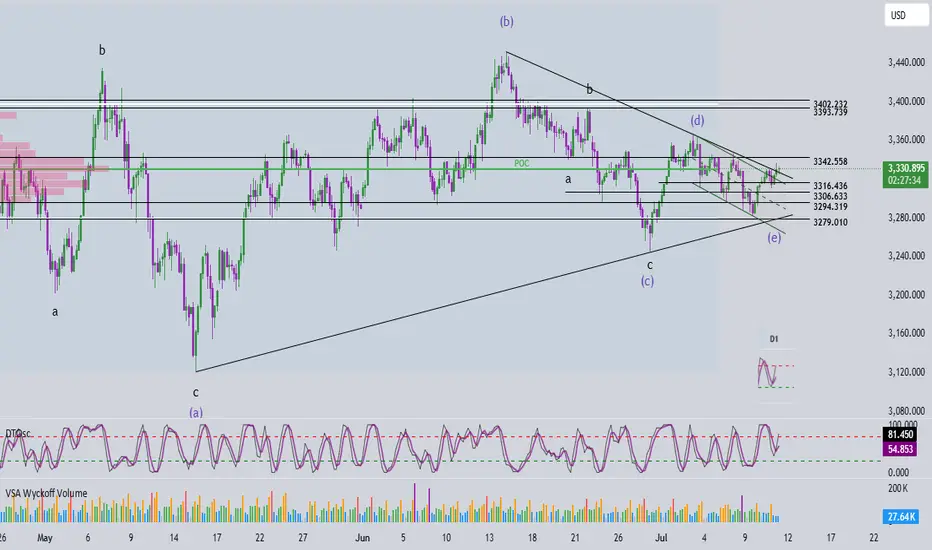
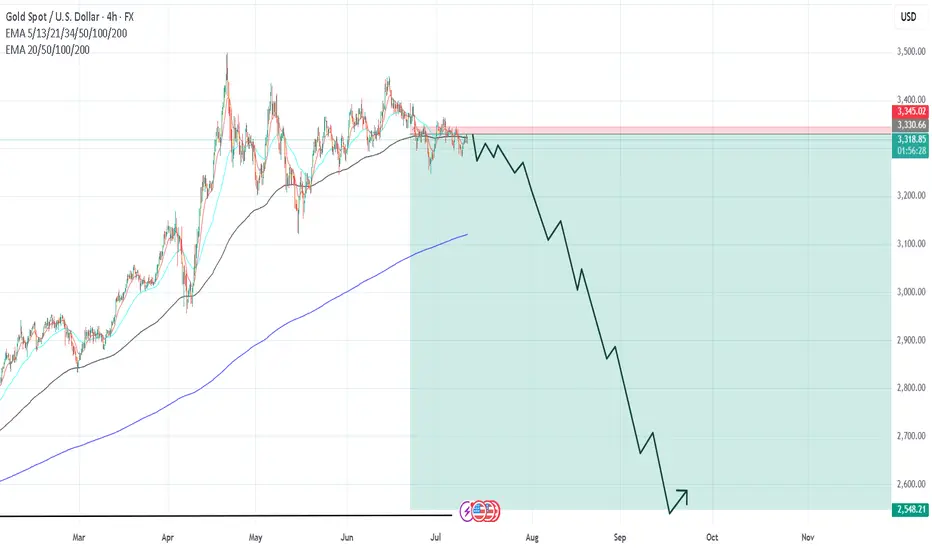
Gold Price Analysis - 4-Hour Chart4-hour candlestick chart for the Gold Spot price in U.S. Dollars (XAUUSD), sourced from OANDA. The chart displays the price movement over time, with green candles indicating an increase in price and red candles indicating a decrease. The chart also features various technical indicators and annotations, including a trend line and a support level.