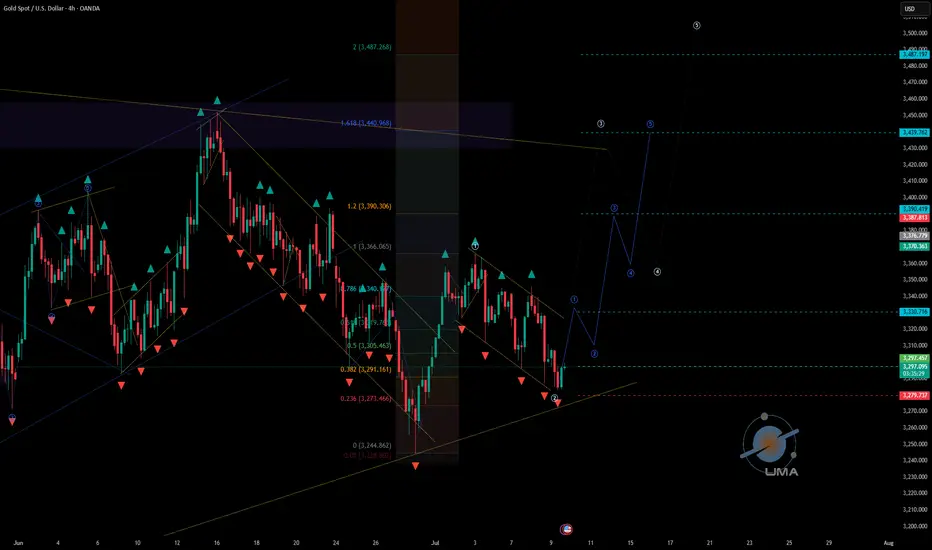
XAUUSD - UniverseMetta - Signal#XAUUSD - UniverseMetta - Signal
H4 - Rebound from the channel border towards the formation of a potential 3rd wave on D1. Stop behind the local minimum.
Entry: 3297.457
TP: 3330.716 - 3390.419 - 3439.762 - 3487.197
Stop: 3279.737
XAUUSDG trade ideas
Gold is in a tug-of-war again
The oscillating pattern under the tug-of-war between gold risk aversion and the dollar
News: The interweaving of long and short factors has caused gold to fall into a tug-of-war
Positive factors:
Trump's new tariff policy: The United States will impose a 25% tariff on Japanese and Korean goods from August 1, and US stocks fell in response. The market's risk aversion sentiment has increased, and the price of gold has rebounded from a low of 3296 points to 3345 points.
The central bank continues to buy gold: The People's Bank of China continued to increase its gold holdings in June, buying for the eighth consecutive month, which has long supported the price of gold.
The long-term weakness of the US dollar: Although the US dollar index has strengthened in the short term, it has fallen 10% this year, close to a three-and-a-half-year low. Gold is still attractive as an anti-inflation asset.
Negative factors:
The US dollar has strengthened in the short term: Boosted by strong non-agricultural data, the US dollar index rebounded to 97.67, suppressing gold buying (especially non-US currency holders).
Geopolitical risks have cooled: There has been no major conflict in the international situation recently, and the demand for safe havens has declined. The rise in gold prices lacks sustainability.
Personal opinion:
Gold is currently in the game stage of "safe-haven support level vs. US dollar suppression level", and the short-term trend depends on the market's expectations of the Fed's policies and trade frictions. If the US dollar continues to rebound, gold prices may be under pressure; but if US economic data weakens or geopolitical risks reappear, gold prices may break through the range of fluctuations.
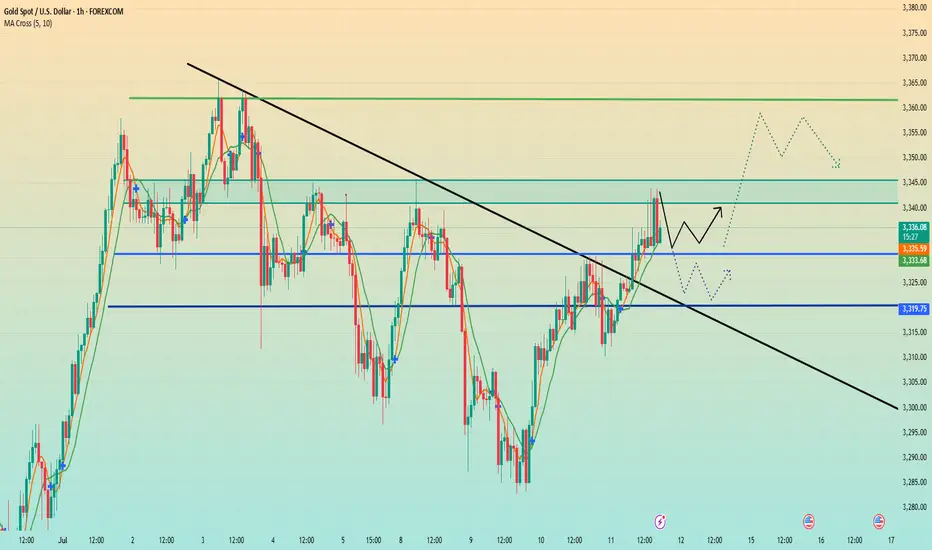
Technical aspect: shock narrowing, direction to be broken
Daily level: range fluctuations (3295-3345), moving average adhesion, unclear trend, need to wait for breakthrough signals.
Key points:
Resistance level: 3345 (multiple highs fall back, break through to see 3400).
Support level: 3295-3300 (break through may fall to 3270-3260).
4-hour chart: MACD golden cross is fragile. If the price falls below 3320, it may turn into a dead cross, exacerbating the risk of a pullback.
Weakness of hourly chart: K-line is under pressure from the short-term moving average. If the rebound in the early trading is weak, it may continue to fluctuate downward.
Personal strategy:
Short-term bearish: Before the effective breakthrough of 3345, you can lightly hold short orders, and wait for the price to rebound to 3320-3330 before testing short orders, with the target at 3300-3295.
Bull opportunity: It may pull back to the support area of 3290-3295 to stabilize, and you can arrange long orders.
Summary and operation suggestions
Core logic: Gold is stuck in the deadlock of "news disturbance + technical shock", and we need to be wary of false breakthroughs.
Key points: Upward breakthrough: If it stands firm at 3345, it will look to 3400. Downside risk: If it loses 3295, it may test the support of 3270-3260.
Subjective tendency: In the short term, it is more inclined to bearish volatility, because the dollar is strong and the sustainability of risk aversion is questionable. However, if the Fed releases dovish signals or US stocks fall sharply, gold may reverse quickly.
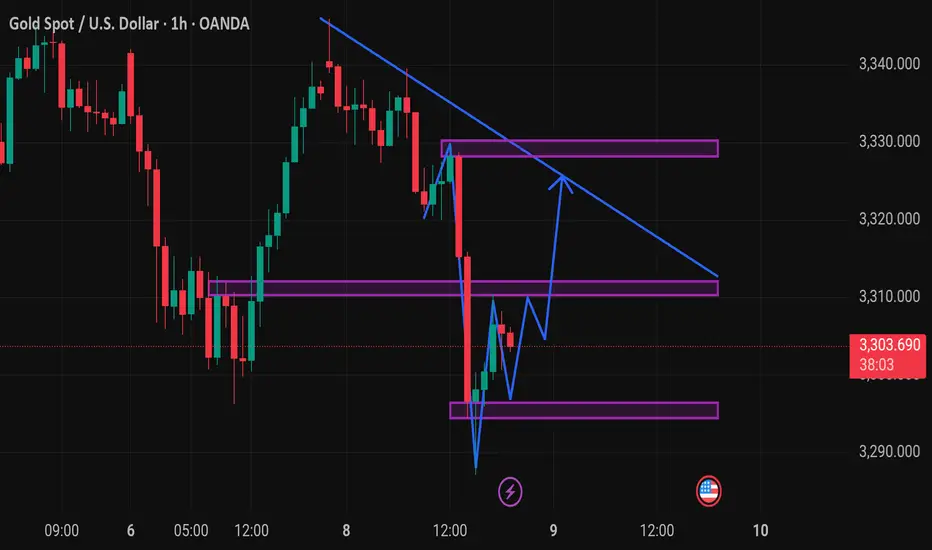
Xausd techinical analysis.Xausd techinical analysis next move posibale at h1 time frame.not finchinal advice.
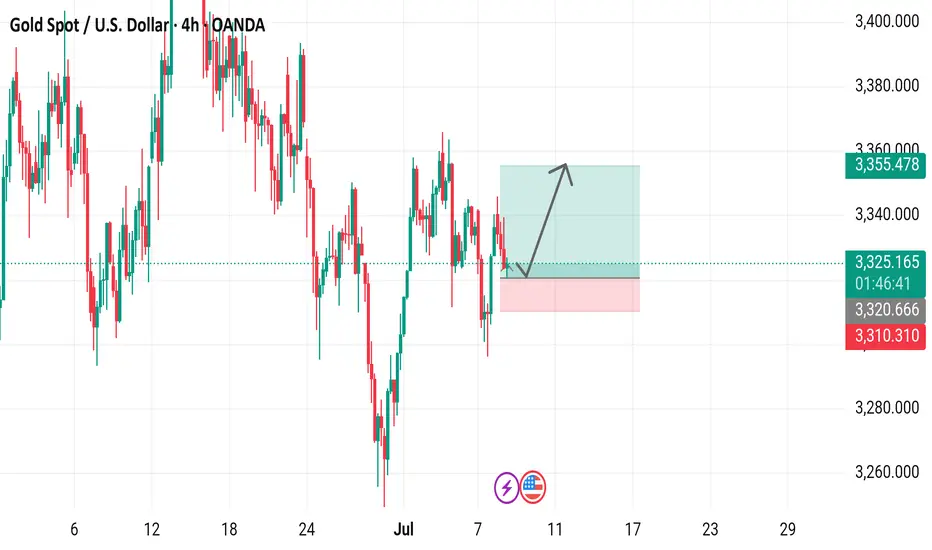
Gold Spot / U.S. Dollar (XAU/USD) 4-Hour Chart4-hour chart from OANDA displays the recent price movement of Gold Spot (XAU/USD) against the U.S. Dollar. The current price is $3,325.120, reflecting a decrease of $11.320 (-0.34%). The chart highlights a recent upward trend with a buy signal at $3,325.410 and a sell signal at $3,324.830, indicating a potential trading range. A shaded area suggests a possible price target or support/resistance zone around $3,355.478, with historical price levels marked on the right side. The timeframe covers the period around July 7-8, 2025.
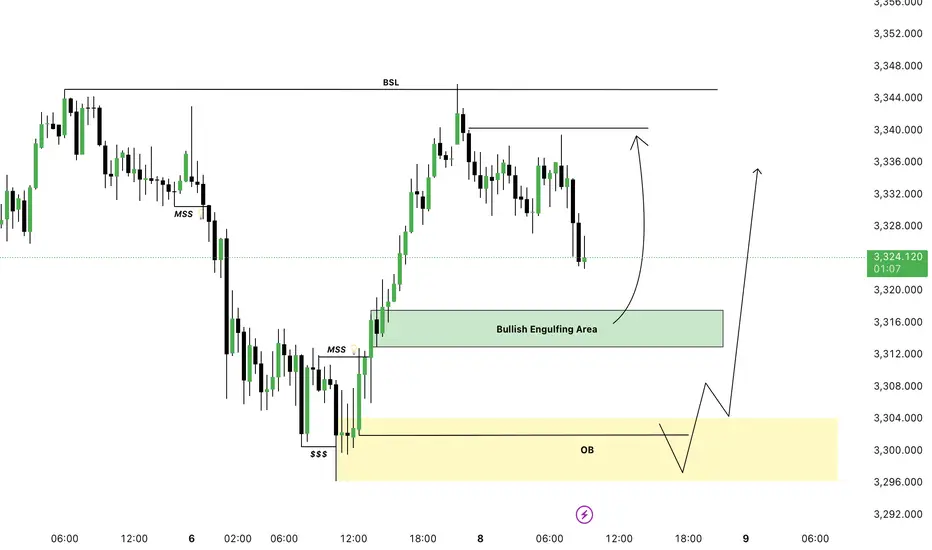
GOLD BUY ZONES Gold Buy Zone We Have
Bullish Engulfing Area ( 3317 - 3311 )
Order Block Area ( 3304 - 3295 )
Target We Are Expect Previous High Lets Gooo
XAUUSD Outlook: How Risk Sentiment Could Shape the Next MoveI’m currently analysing XAUUSD (Gold) 🟡, which has come under bearish pressure 📉, showing signs of downside momentum. In the video 🎥, we also explore the inverse correlation between Gold and risk assets like the NASDAQ 📊.
Keep a close eye on NASDAQ movements—if risk assets break bullish 🚀, we may see further weakness in Gold. On the other hand, if risk sentiment shifts and risk assets break bearish 🛑, Gold could attract safe-haven demand and gain strength 💪.
We also dive into the price action, market structure, and pull up the volume profile 🧩. Gold is currently trading around the Point of Control (POC) ⚖️—a key level where significant volume has accumulated. A clean break above or below this area could act as a technical trigger for the next move 📈📉.
As always, this is not financial advice ⚠️—just my market view.

XAUUSD Hello traders,
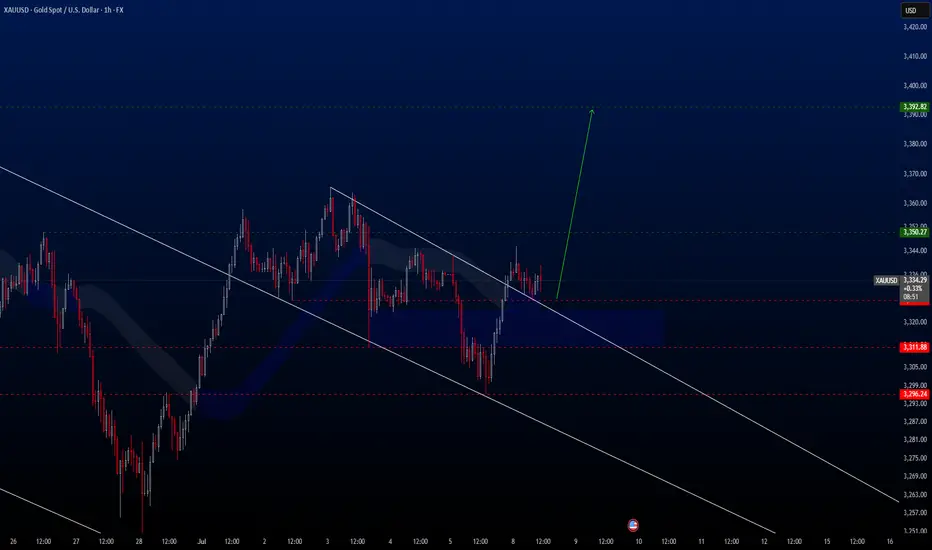
Today we're taking advantage of a great buying opportunity on the XAUUSD pair. This setup is ideal for both medium- and long-term positions. I anticipate that the price will rise toward the 3392.82 USD level in the coming weeks.
That’s why I’ve positioned this trade as a medium-term opportunity.
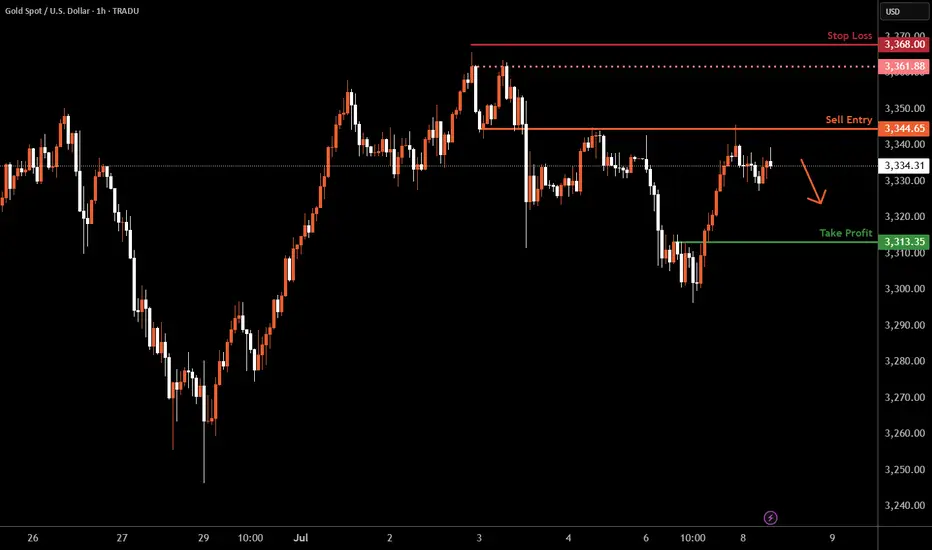
Gold H1 | Approaching an overlap resistanceGold (XAU/USD) is rising towards an overlap resistance and could potentially reverse off this level to drop lower.
Sell entry is at 3,344.65 which is an overlap resistance.
Stop loss is at 3,368.00 which is a level that sits above a swing-high resistance.
Take profit is at 3,313.35 which is a pullback support.
High Risk Investment Warning
Trading Forex/CFDs on margin carries a high level of risk and may not be suitable for all investors. Leverage can work against you.
Stratos Markets Limited (tradu.com ):
CFDs are complex instruments and come with a high risk of losing money rapidly due to leverage. 63% of retail investor accounts lose money when trading CFDs with this provider. You should consider whether you understand how CFDs work and whether you can afford to take the high risk of losing your money.
Stratos Europe Ltd (tradu.com ):
CFDs are complex instruments and come with a high risk of losing money rapidly due to leverage. 63% of retail investor accounts lose money when trading CFDs with this provider. You should consider whether you understand how CFDs work and whether you can afford to take the high risk of losing your money.
Stratos Global LLC (tradu.com ):
Losses can exceed deposits.
Please be advised that the information presented on TradingView is provided to Tradu (‘Company’, ‘we’) by a third-party provider (‘TFA Global Pte Ltd’). Please be reminded that you are solely responsible for the trading decisions on your account. There is a very high degree of risk involved in trading. Any information and/or content is intended entirely for research, educational and informational purposes only and does not constitute investment or consultation advice or investment strategy. The information is not tailored to the investment needs of any specific person and therefore does not involve a consideration of any of the investment objectives, financial situation or needs of any viewer that may receive it. Kindly also note that past performance is not a reliable indicator of future results. Actual results may differ materially from those anticipated in forward-looking or past performance statements. We assume no liability as to the accuracy or completeness of any of the information and/or content provided herein and the Company cannot be held responsible for any omission, mistake nor for any loss or damage including without limitation to any loss of profit which may arise from reliance on any information supplied by TFA Global Pte Ltd.
The speaker(s) is neither an employee, agent nor representative of Tradu and is therefore acting independently. The opinions given are their own, constitute general market commentary, and do not constitute the opinion or advice of Tradu or any form of personal or investment advice. Tradu neither endorses nor guarantees offerings of third-party speakers, nor is Tradu responsible for the content, veracity or opinions of third-party speakers, presenters or participants.
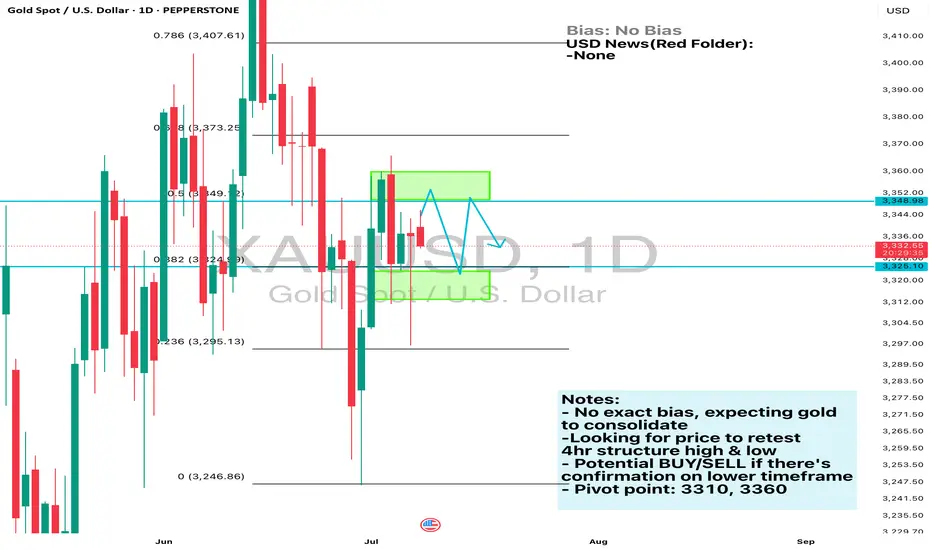
Daily Analysis- XAUUSD (Tuesday, 8th July 2024)Bias: No Bias
USD News(Red Folder):
-None
Notes:
- No exact bias, expecting gold
to consolidate
-Looking for price to retest
4hr structure high & low
- Potential BUY/SELL if there's
confirmation on lower timeframe
- Pivot point: 3310, 3360
Disclaimer:
This analysis is from a personal point of view, always conduct on your own research before making any trading decisions as the analysis do not guarantee complete accuracy.
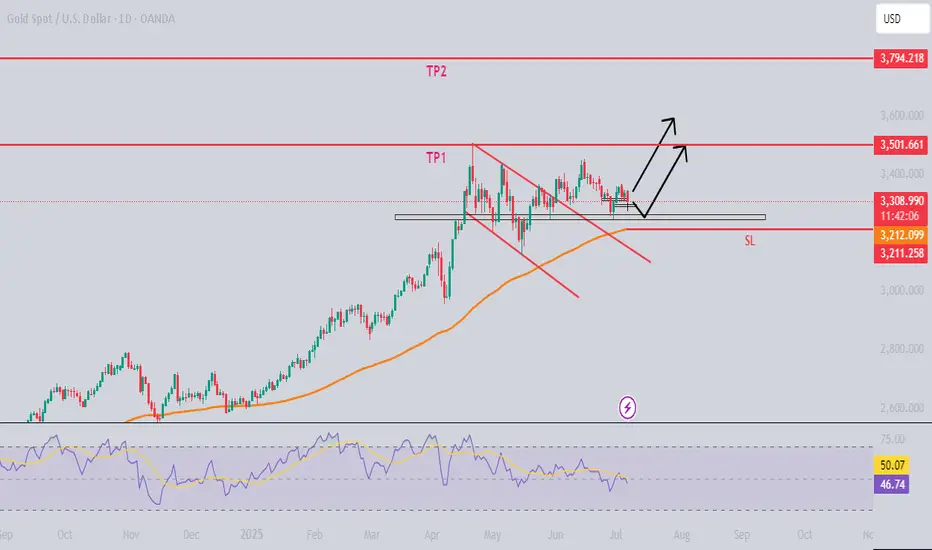
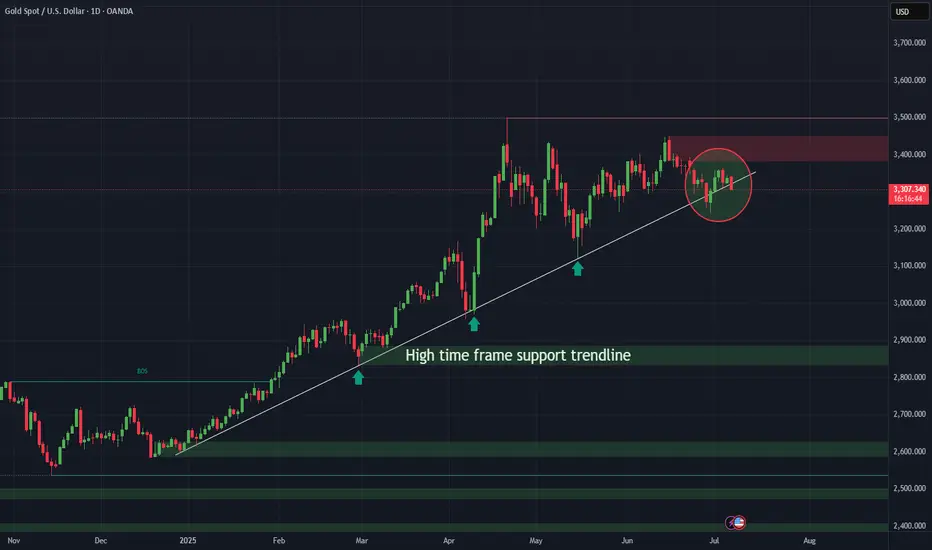
GOLDAlthough there is a bearish divergence visible on the weekly timeframe (which often signals a possible slowdown or reversal in the trend) the daily timeframe shows that gold has broken out of a bullish flag pattern a continuation pattern that usually leads to further upside.
This breakout suggests that, despite the divergence gold still has room to move higher in the short term. Based on this pattern it could rise up to around 38000 before it begins a retracement (a temporary pullback). After the retracement the overall upward trend may resume, especially if strong support levels hold.
$XAU mau breakdown besarDisclaimer:
THIS IS NOT A SELL INSTRUCTION
BUT SERVES AS A REFERENCE FOR THE BIG MAJOR TREND IF IT TURNS OUT TO BE VALID
From the retest to the nearest resistance, I suspect that gold may fail to break through the red resistance area.
And from the chart, there’s already a slight hint of a breakdown.
Will gold plunge and break its major daily trendline support?
July 5, 2025 - XAUUSD GOLD Analysis and Potential OpportunityAnalysis:
After market liquidity returned today, price failed to hold above 3345, and once 3324 key support broke, it retraced to the previous bullish cost zone.
Now, price is testing the 3300 psychological level — if it breaks, watch for shorts targeting 3290, then 3275.
Short-term resistance is around 3320 — as long as it holds, bearish momentum remains strong.
If price breaks below 3306, I plan to add to shorts, with focus on the 3300 level.
For longs, I will wait for a clear reversal candle before considering entry.
🔍 Key Levels to Watch:
• 3362 – Resistance
• 3350 – Resistance
• 3345 – Intraday resistance zone
• 3330 – Resistance zone
• 3322 – Short-term resistance zone
• 3315 – Short-term resistance
• 3306 – Short-term support
• 3300 – Critical support / Psychological level
• 3290 – Key support
• 3283 – Key support
👉 If you want to learn how I time entries and set stop-losses, hit the like button so I know there’s interest — I may publish a detailed post by the weekend if support continues!
Disclaimer: This is my personal opinion, not financial advice. Always trade with caution and manage your risk.
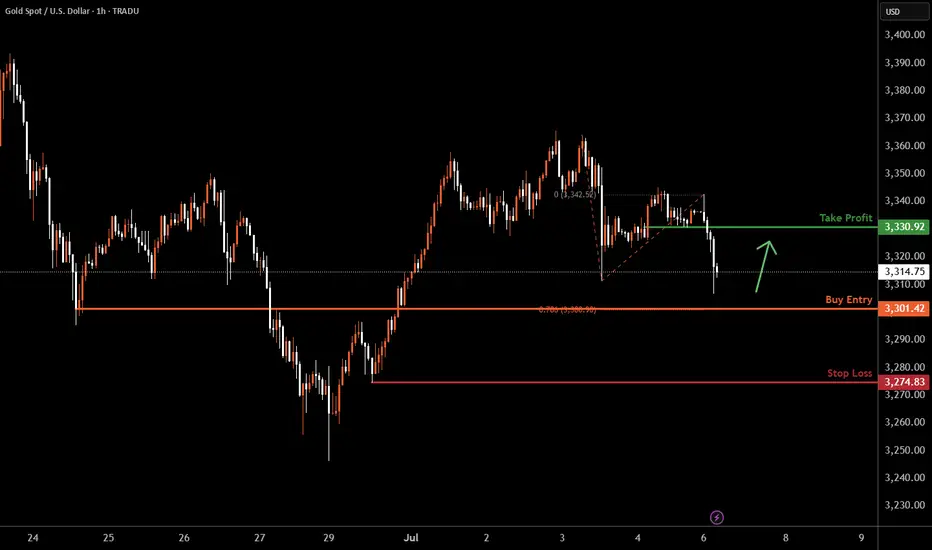
XAUUSD H1 I Bullish Bounce Off Based on the H1 chart analysis, the price is falling toward our buy entry level at 3301.42, a pullback support that aligns with the 78.6% Fib projection.
Our take profit is set at 3330.92, a pullback resistance.
The stop loss is placed at 3274.83, a swing low support.
High Risk Investment Warning
Trading Forex/CFDs on margin carries a high level of risk and may not be suitable for all investors. Leverage can work against you.
Stratos Markets Limited (tradu.com ):
CFDs are complex instruments and come with a high risk of losing money rapidly due to leverage. 63% of retail investor accounts lose money when trading CFDs with this provider. You should consider whether you understand how CFDs work and whether you can afford to take the high risk of losing your money.
Stratos Europe Ltd (tradu.com ):
CFDs are complex instruments and come with a high risk of losing money rapidly due to leverage. 63% of retail investor accounts lose money when trading CFDs with this provider. You should consider whether you understand how CFDs work and whether you can afford to take the high risk of losing your money.
Stratos Global LLC (tradu.com ):
Losses can exceed deposits.
Please be advised that the information presented on TradingView is provided to Tradu (‘Company’, ‘we’) by a third-party provider (‘TFA Global Pte Ltd’). Please be reminded that you are solely responsible for the trading decisions on your account. There is a very high degree of risk involved in trading. Any information and/or content is intended entirely for research, educational and informational purposes only and does not constitute investment or consultation advice or investment strategy. The information is not tailored to the investment needs of any specific person and therefore does not involve a consideration of any of the investment objectives, financial situation or needs of any viewer that may receive it. Kindly also note that past performance is not a reliable indicator of future results. Actual results may differ materially from those anticipated in forward-looking or past performance statements. We assume no liability as to the accuracy or completeness of any of the information and/or content provided herein and the Company cannot be held responsible for any omission, mistake nor for any loss or damage including without limitation to any loss of profit which may arise from reliance on any information supplied by TFA Global Pte Ltd.
The speaker(s) is neither an employee, agent nor representative of Tradu and is therefore acting independently. The opinions given are their own, constitute general market commentary, and do not constitute the opinion or advice of Tradu or any form of personal or investment advice. Tradu neither endorses nor guarantees offerings of third-party speakers, nor is Tradu responsible for the content, veracity or opinions of third-party speakers, presenters or participants.
XAUUSD : Clear weakeningWhat about XAU?
Many would be asking.
From a harmonic point of view, I can see price is weakening. Even with a push by BUYERS, it would only reach the banana, which is BELOW the previous high at the blue line.
So, the plan is that when it reaches banana, a SELL is possible with SL just above the blue line. In this way, we have a higher probability of success, plus a fantastic R/R.
Looking at the DXY, the $ is also at an inflection point.
Good luck.
XAUUSD to continue bearishingI expect XAUUSD to spike up and reversed to continue bearishing this coming week.
gold is still bearishgold is still bearish
in the higher timeframe gold is still bearish after a strong bull run week gold settled below the weekly neckline.
which is an indication of the bearish is still present. a few support and resistance.
during NFP a strong bearish enter from 3351 to 3312.
3351 is a goo retest area of bear.
bull stop at 3312 now as key level.
break 3312 next destination is 3289 and 3248.
break above 3352 and 3363 next destination is 3400.
Gold #gold god currency
Doesn't restore to earthly realm default i.e safe heaven (haven)🌠
RALLY & correction
🪽Trade wars
✒️ Tariffs threat's stocks
🪽Geopolitics war's i.e rising lion
✒️ Loose confidence fiat & bond
🪽 Inflation concern i.eFed talk
🪽 central banks buying gold i.e french bank
✒️ Institution money invested in gold
Technical analysis
☄️
H/H $3500
L/L $2828
#intergalactic
💌Trend line Support
$3285
$3245
$3120 @gold_pullback
$2958
$2828
Rally I $2536
Rally base $2958
Rally II. $2958 to $3500
🔗Swings
A trend is over if recent swing is beyond/below previous swing
Bullish continuation patterns
🌻$3360 swing high
🌻$3245 swing low
🍁 #Bullish flag 🏁support $3285
🌻$3450 swing high
🌻$3245 swing low
🦸 bullish falling 🌠 wedge
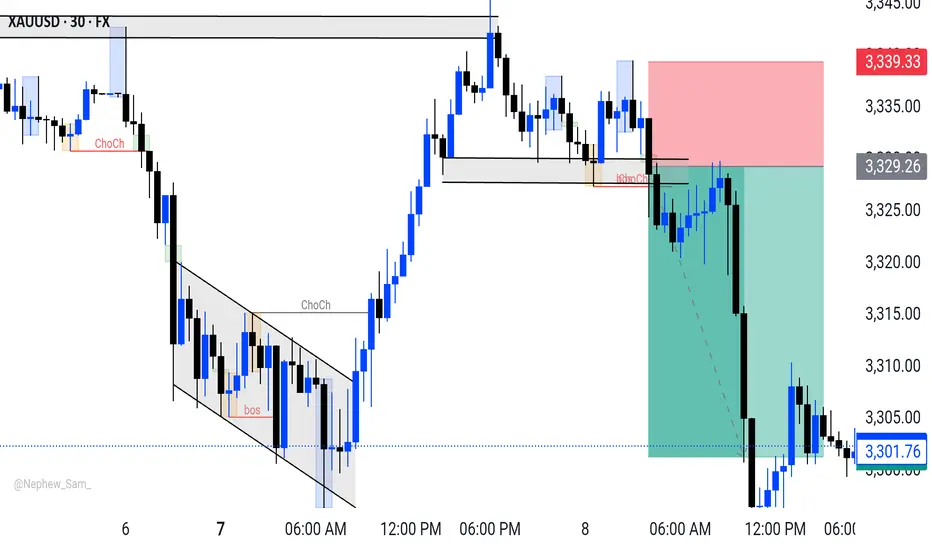
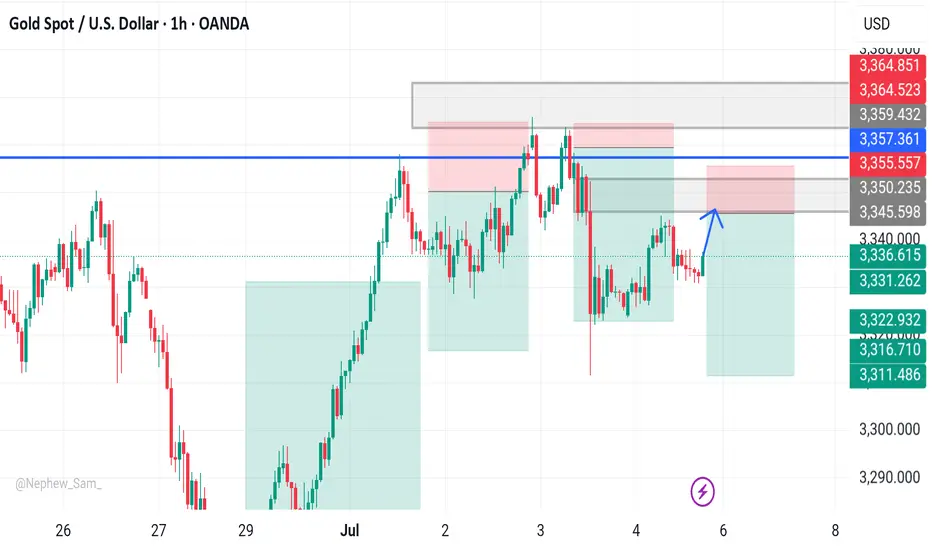
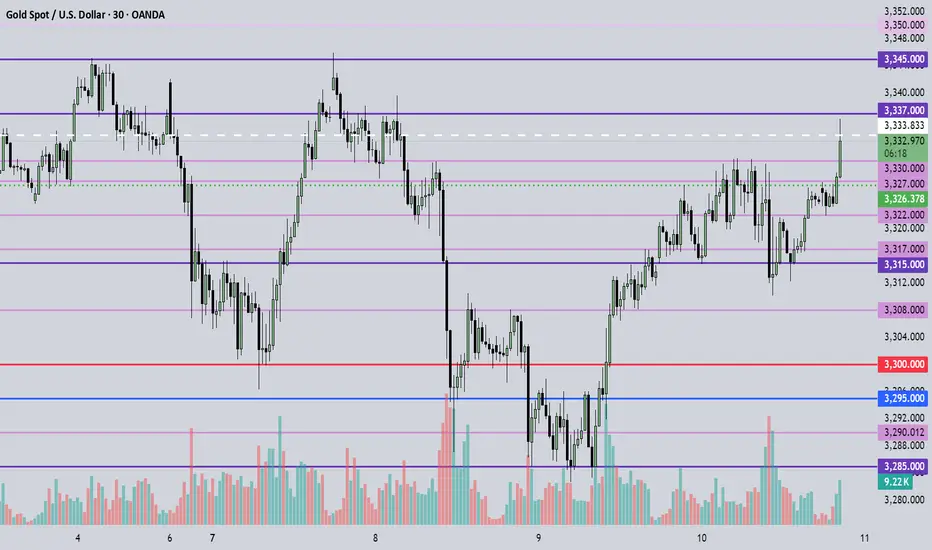
The price fell back. Watch out for a breakthrough.After reaching the resistance position near 3345 predicted by Quaid, the price fell back slightly, and the price fluctuated around 3335 so far.
From the hourly chart, before the price stabilizes at 3345, it is likely to maintain a range of 3330-3345. 3330-3345 is a temporary range. If it stands firm and breaks above 3345 again, the fluctuation range will become 3345-3360.
On the contrary, if it falls below 3330, the range may drop to 3320-3330. However, as long as the downward trend does not fall below 3320, gold will still maintain a bullish trend. If the price breaks down below 3320, today’s trend will be reversed.
As long as it is above 3320, gold will maintain a bullish trend today.
On the last trading day of this week, I wish all traders a good harvest.
Gold Breaks Free, Ready to Ride the WindGold may ride the wind upward after breaking out of its consolidation structure, opening a path of potential upside.
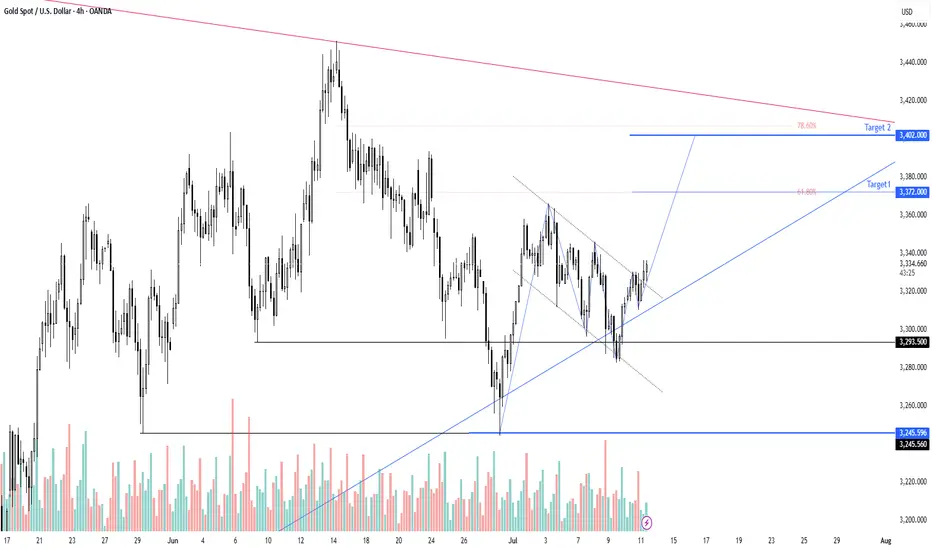
July 11, 2025 - XAUUSD GOLD Analysis and Potential Opportunity📝 Analysis:
Strong bullish momentum continues. During the Asian session, the plan is to buy on pullbacks to support.
Key resistance at 3345 — if it holds, short setups may offer good risk-reward.
🔍 Key Levels to Watch:
• 3375 – Resistance
• 3365 – Resistance
• 3350 – Midpoint resistance
• 3345 – Intraday key resistance
• 3330 – Key support
• 3322 – Support
• 3315 – Support
• 3307 – Intraday key support
• 3300 – Psychological level
📈 Intraday Strategy:
• SELL if price breaks below 3330 → watch 3327, then 3322, 3315, 3308
• BUY if price holds above 3330 → watch 3337, then 3345, 3350, 3355
👉 If you want to know how I time entries and set stop-losses, hit the like button so I know there’s interest — I may publish a detailed post by the weekend if support continues!
Disclaimer: This is my personal opinion, not financial advice. Always trade with caution and manage your risk.
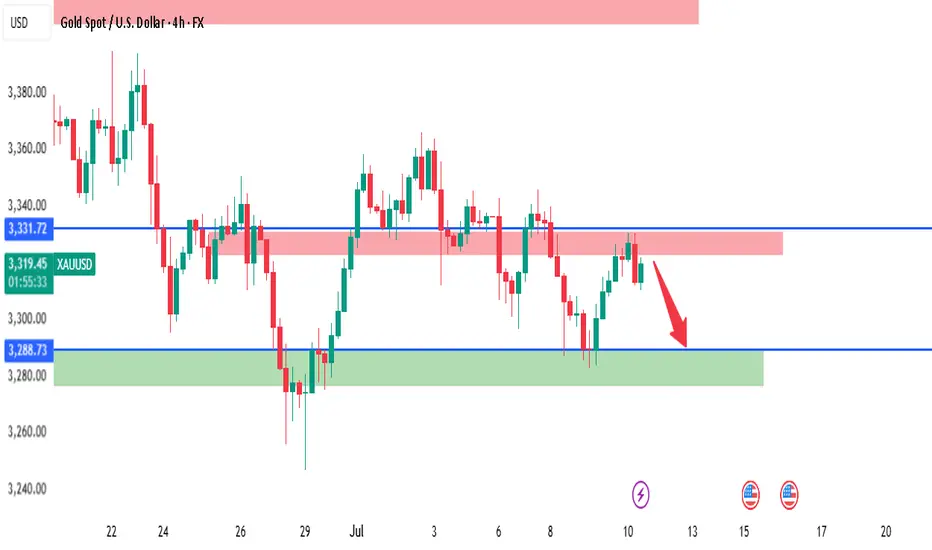
XAUUSD - 4H Bearish Rejection from Supply Zone | SMC AnalysisGold is showing signs of weakness after reacting strongly from a 4H Supply Zone around the 3331.72 level. Price tapped into the red supply zone, failed to break above, and is now forming lower highs — suggesting bearish momentum is building.
🔍 Key SMC Observations:
Supply Zone: Price rejected the 3331.72 level, which acted as a clear supply area based on past liquidity grabs and bearish institutional moves.
Change of Character (CHoCH): We saw a CHoCH around July 5th–6th, indicating a shift from bullish to bearish order flow.
Lower High Formation: Price failed to make a new high after tapping supply, showing signs of distribution.
Imbalance + Target Zone: Clean imbalance exists down to 3288.73 and potentially to the green demand zone around 3260–3270.
📍Trade Setup Idea:
Sell Opportunity: If price continues to reject the supply zone, look for bearish confirmation on the lower timeframes (e.g., 1H) to enter.
Target 1 (TP1): 3288.73 (near-term liquidity level)
Target 2 (TP2): 3260–3270 demand zone
Invalidation: A break and close above 3331.72 would invalidate the short-term bearish bias.
🔴 Watch for reaction around 3288.73 – if it holds, expect a possible bounce. If broken, further downside is likely.