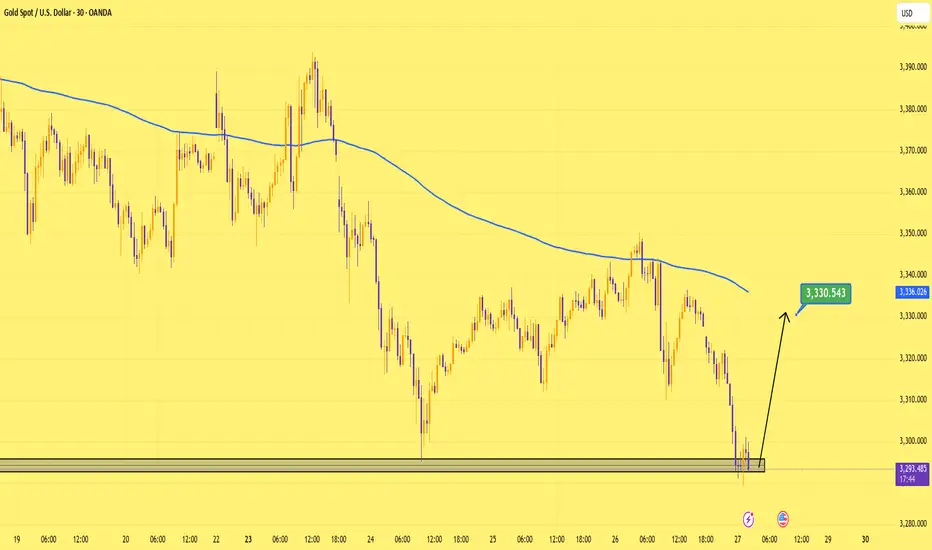
Gold at 3330… I’ll take that bet.Price tapped into demand with multiple rejections.
Targeting 3,330. Clean setup, clear risk. Let’s see if the bulls got something left.
XAUUSDG trade ideas
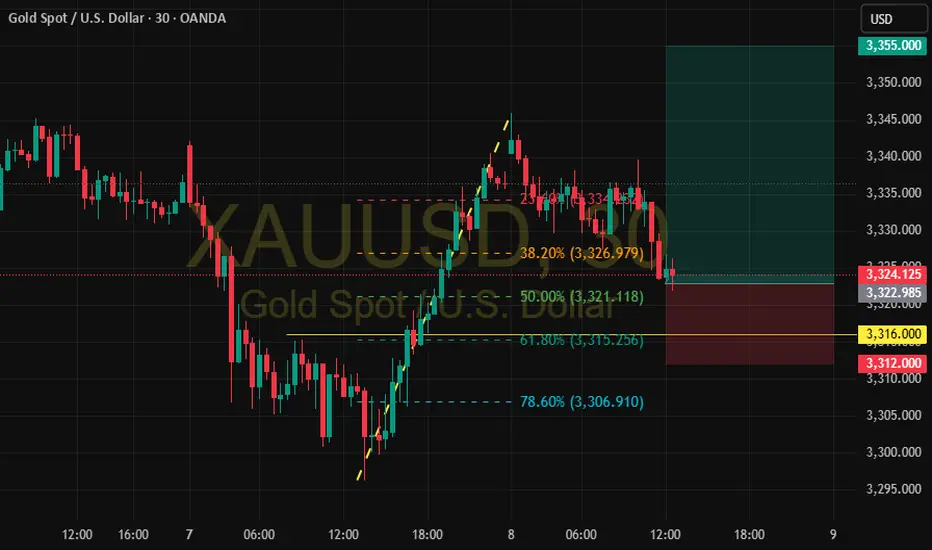
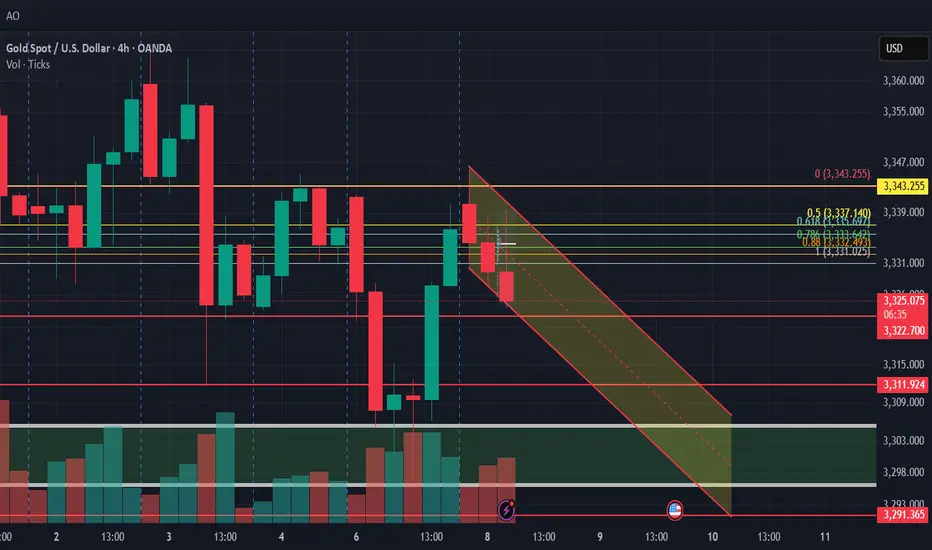
XAU/USD – Watching Fibonacci Retracement Levels for Potential LoAfter a strong bullish impulse from the 3,297 zone to the 3,347 high, gold is currently undergoing a technical pullback.
🔍 **Key Levels to Watch:**
* 📉 38.2% Fib: **3,327**
* ⚖️ 50% Fib: **3,321** (Current area of interest)
* 🛡️ 61.8% Fib: **3,315** – strong potential support zone
The price is now testing the 50% level. If bullish confirmation (e.g. bullish engulfing or breakout candle) appears around the **3,321–3,315** zone, this may present a **high-probability long opportunity**.
🎯 **Trade Idea:**
* **Entry Zone:** 3,321 – 3,315
* **Stop Loss:** Below 3,312
* **Target 1:** Retest of 3,347
* **Target 2:** Extension toward 3,355
⚠️ **Invalidation:** A clear break below 3,312 could open the door for deeper retracement toward the 78.6% level at 3,306.
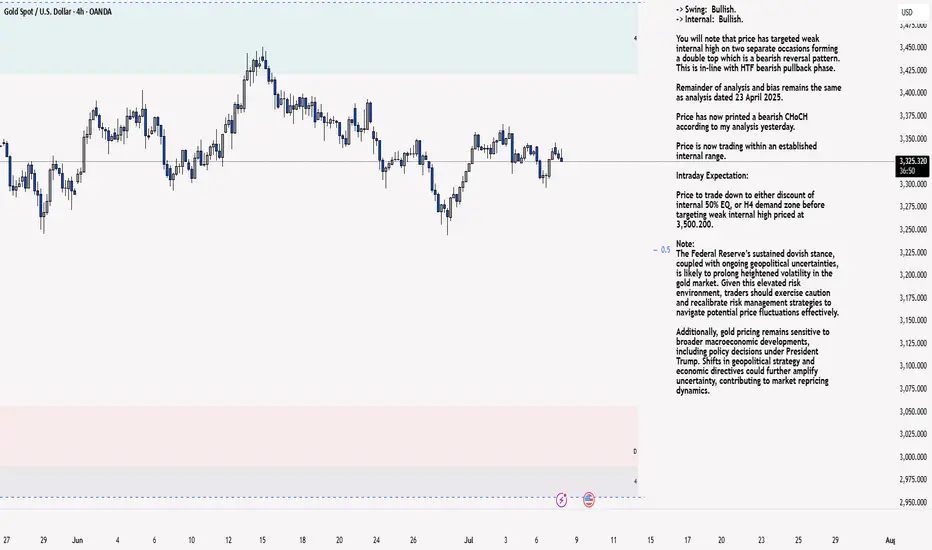
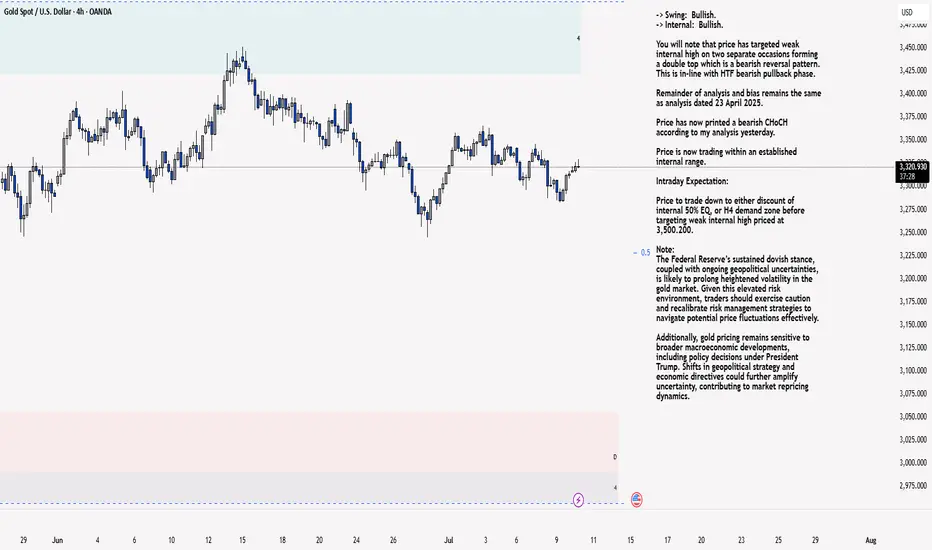
XAU/USD 08 June 2025 Intraday AnalysisH4 Analysis:
-> Swing: Bullish.
-> Internal: Bullish.
You will note that price has targeted weak internal high on two separate occasions forming a double top which is a bearish reversal pattern. This is in-line with HTF bearish pullback phase.
Remainder of analysis and bias remains the same as analysis dated 23 April 2025.
Price has now printed a bearish CHoCH according to my analysis yesterday.
Price is now trading within an established internal range.
Intraday Expectation:
Price to trade down to either discount of internal 50% EQ, or H4 demand zone before targeting weak internal high priced at 3,500.200.
Note:
The Federal Reserve’s sustained dovish stance, coupled with ongoing geopolitical uncertainties, is likely to prolong heightened volatility in the gold market. Given this elevated risk environment, traders should exercise caution and recalibrate risk management strategies to navigate potential price fluctuations effectively.
Additionally, gold pricing remains sensitive to broader macroeconomic developments, including policy decisions under President Trump. Shifts in geopolitical strategy and economic directives could further amplify uncertainty, contributing to market repricing dynamics.
H4 Chart:
M15 Analysis:
-> Swing: Bullish.
-> Internal: Bullish.
H4 Timeframe - Price has failed to target weak internal high, therefore, it would not be unrealistic if price printed a bearish iBOS.
The remainder of my analysis shall remain the same as analysis dated 13 June 2025, apart from target price.
As per my analysis dated 22 May 2025 whereby I mentioned price can be seen to be reacting at discount of 50% EQ on H4 timeframe, therefore, it is a viable alternative that price could potentially print a bullish iBOS on M15 timeframe despite internal structure being bearish.
Price has printed a bullish iBOS followed by a bearish CHoCH, which indicates, but does not confirm, bearish pullback phase initiation. I will however continue to monitor, with respect to depth of pullback.
Intraday Expectation:
Price to continue bearish, react at either M15 supply zone, or discount of 50% internal EQ before targeting weak internal high priced at 3,451.375.
Note:
Gold remains highly volatile amid the Federal Reserve's continued dovish stance, persistent and escalating geopolitical uncertainties. Traders should implement robust risk management strategies and remain vigilant, as price swings may become more pronounced in this elevated volatility environment.
Additionally, President Trump’s recent tariff announcements are expected to further amplify market turbulence, potentially triggering sharp price fluctuations and whipsaws.
M15 Chart:
Demand Zones | Break of Structure | Targeting Liquidity Above
✅ Bullish Structure:
Price is forming higher lows, confirming a bullish internal structure after sweeping the lower demand zone.
🟦 Key Demand Zones:
First Demand Zone: 3,320 – 3,330 (short-term mitigation zone)
Second Demand Zone: 3,260 – 3,280 (HTF imbalance + liquidity sweep)
📌 Internal Break of Structure (iBOS):
Recent bullish reaction from 3,260 demand created an iBOS above minor highs.
Signals accumulation and smart money re-entry.
🔵 Target:
3,447.97 – buy-side liquidity resting above swing highs.
---
🎯 Trade Setup:
Buy Entry (Confirmed): 3,325–3,330
Stop Loss: 3,315
Take Profit: 3,447
Report - 7 jully, 2025China’s Export Rerouting: A Strategic Response to US Tariffs
China has aggressively shifted its export strategy to circumvent the steep tariff wall erected by President Trump as part of his ongoing trade war. Recent data from the US Census Bureau shows that Chinese exports directly to the US dropped by 43% year-on-year in May, equivalent to a $15 billion decline.
However, China’s overall exports still rose by 4.8% in the same period, indicating successful reallocation of trade flows. This was achieved through a 15% increase in exports to the ASEAN bloc and a 12% increase to the EU. By rerouting products through Southeast Asia, China is effectively sidestepping US tariffs, echoing tactics seen during the initial phase of the US-China trade war under Trump's first term.
Southeast Asia as a Transshipment Hub
Vietnam and Indonesia have emerged as key transit hubs. According to Capital Economics, an estimated $3.4 billion worth of Chinese goods were rerouted via Vietnam in May — a 30% increase from the previous year. Indirect trade through Indonesia also rose sharply to $800 million, up 25% year-on-year.
Chinese exports of electronic components to Vietnam surged, including printed circuits, telephone set parts, and display modules, which alone rose by $2.6 billion, or 54% compared to May 2024. This strategic pivot underlines China’s adaptability and Southeast Asia's growing role in global supply chain realignments.
US Policy Response and Warnings
US Treasury Secretary Scott Bessent has warned that unless trade partners finalize deals with Washington, tariffs will "boomerang" back to their steep April levels starting August 1. The 90-day tariff pause, which initially calmed markets, is set to end imminently.
So far, Trump has secured only three trade agreements — with the UK, China, and Vietnam. Vietnam’s deal notably includes a punitive 40% levy on goods transshipped through its territory, specifically targeting Chinese re-exports. This demonstrates the US administration's determination to close loopholes and deter indirect circumvention of tariffs.
Implications for Trade Partners and Global Markets
Other major US trading partners, including the EU, Japan, and South Korea, remain in limbo, facing potential tariff hikes. The uncertainty has reintroduced volatility into trade-dependent markets. US officials anticipate a flurry of last-minute negotiations, but the threat of broad tariff reimposition looms large.
Trump’s approach, characterized by abrupt policy swings and negotiation brinkmanship, has already forced US allies and adversaries alike to reconsider supply chain configurations. The potential return of high tariffs risks reigniting concerns over inflation and global growth that initially triggered financial market sell-offs earlier in the year.
Financial Market Dynamics
Trump’s tariff pause had stabilized US equities and bond markets after an initial sharp downturn. However, the risk of renewed tariffs could reverse these gains, particularly if trade tensions escalate further. Investors are watching closely for any last-minute deals that might avert additional supply chain disruptions and support risk sentiment.
Meanwhile, China’s ability to maintain overall export growth despite US measures signals resilience and reinforces the importance of diversified trade relationships. For global investors, this suggests continued strength in ASEAN manufacturing and logistics sectors, as well as ongoing demand for regional infrastructure development to handle redirected trade flows.
Broader Geopolitical and Strategic Context
The rerouting highlights China’s tactical approach to trade pressure while deepening its economic ties with neighboring Southeast Asian nations. This strategy aligns with Beijing’s broader goal of strengthening its influence in ASEAN and hedging against Western economic decoupling efforts.
In parallel, the US is doubling down on "economic nationalism," threatening high tariffs unless trade partners make concessions. This could push more countries toward regional trade alliances, bypassing direct US channels and potentially undermining American market leverage over time.
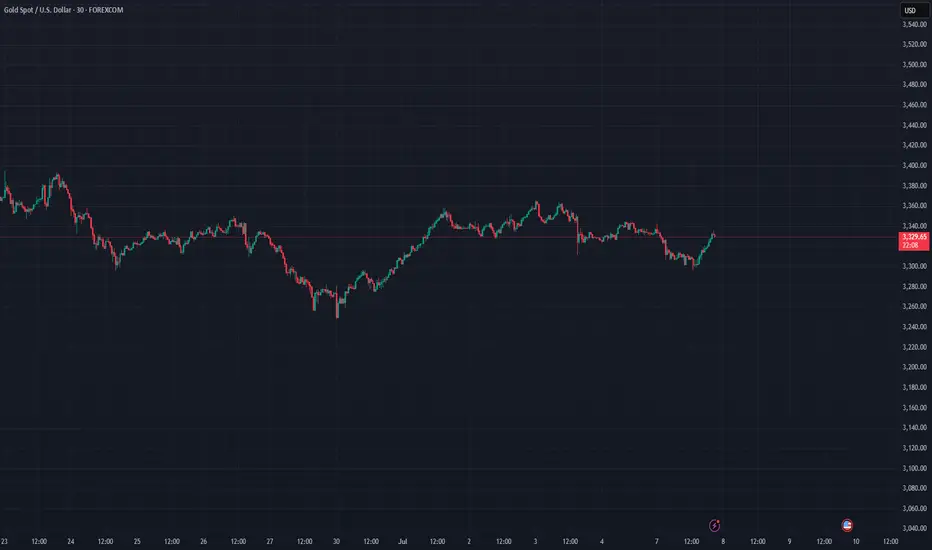
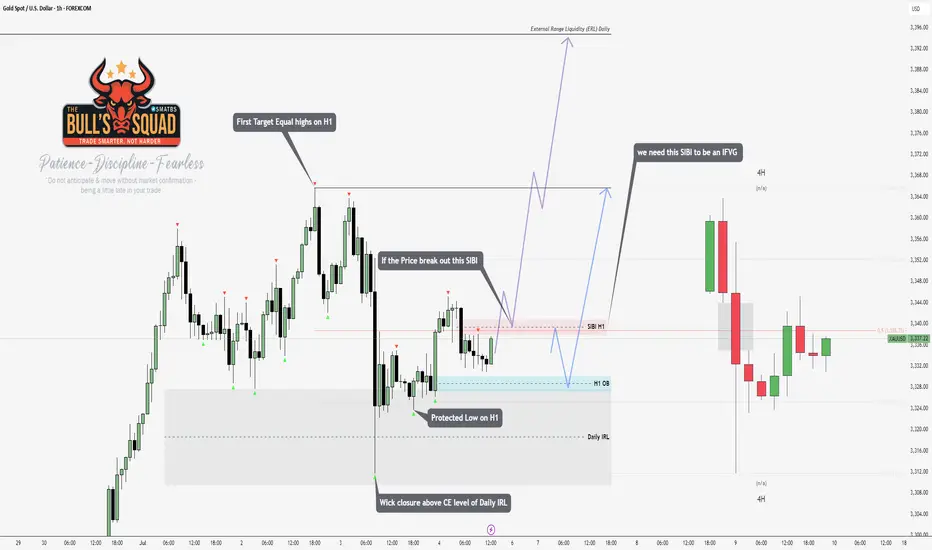
GOLD H2 Intraday Chart Update For 7 July 2025Welcome to the new week traders
as we have FOMC meeting minutes report due this week so firs market is fell down from 3350 Psychological level now is testing 3300 psychological level
all eyes on breakout of 3300 level for now if market breaks 3300 level then it will move towards 3280 then 3350
only clear breakout of 3335 will clear path for towards 3368 level
Disclaimer: Forex is Risky
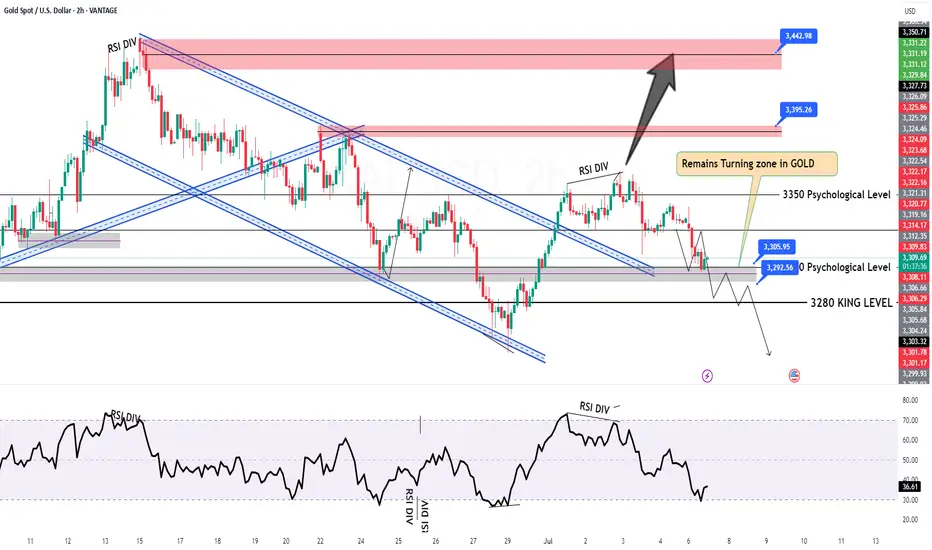
Gold Trading Strategy for next Monday✅From the current short-term structure, gold is exhibiting a typical bearish continuation pattern, indicating that the primary trend remains downward. If gold fails to effectively break above the key resistance level at 3350 next week, it suggests that the prevailing downtrend is likely to continue. The probability of a short-term rebound being capped in this area is relatively high.
✅On the downside, attention should first be given to the 3310 level, which serves as a critical short-term support. A break below this level could open the door for a further decline toward the 3280–3250 zone, where traders should watch for potential bottoming signals or signs of strong support.
✅From the 1-hour chart perspective, short-term moving averages are beginning to turn lower, indicating weakening bullish momentum. Technically, a double top formation has developed, and the price has broken below the neckline, showing a lack of rebound strength. Despite a minor rebound to around 3345 yesterday, the price once again faced resistance and moved lower, reflecting a weak consolidation phase.
✅As such, the 3345–3350 area will be a critical short-term resistance next week. If the market opens higher due to bullish news over the weekend and breaks above this region, gold could regain upward momentum. Conversely, if the price remains suppressed under 3345–3350 and only shows weak rebounds, short-selling opportunities may arise near this zone.
✅Short-Term Trading Strategy:
Main strategy: Sell on rallies, buy on dips
🔴 Resistance level: 3345–3350
🟢Support level: 3310–3315
🔰If 3310 is broken, the next support area is 3280–3250.
✅Overall, unless gold breaks above key resistance, the outlook remains moderately bearish with a consolidation bias. Traders are advised to remain flexible and adjust their strategies in response to market news and developments.
✅If your recent trading results haven’t been ideal, feel free to reach out. I’d be happy to help you avoid common pitfalls and improve your performance. I will provide real-time strategy updates during market hours based on price action — stay tuned.
GOLD CONFIRM TRADE🔍 Chart Analysis Summary:
Current Price: ~3,336
Key Resistance (Supply Zone): 3,340 – 3,353
Major Resistance Above: 3,388 – 3,395
Key Support (Demand Zone): 3,320 – 3,330
Major Support Below: 3,294 – 3,305
⚔️ Trade Setup Ideas:
📉 Sell Setup (High Probability Intraday Short)
Scenario: Price is near the lower supply zone (3,340–3,353), showing rejection.
Entry: 3,340 – 3,345 (on bearish candle confirmation or rejection wick)
Stop Loss: Above 3,353 (zone high or recent swing high)
Take Profit Targets:
TP1: 3,330 (first minor support)
TP2: 3,320 (demand zone)
TP3: 3,295 (major support)
📌 Confirmation Tips:
Look for bearish engulfing / rejection candles
RSI divergence or weakness
Break of 3,330 support confirms continuation
📈 Buy Setup (If Price Drops to Demand)
Scenario: Price drops back into demand zone 3,320–3,330 with bullish reaction.
Entry: 3,322 – 3,328 (bullish wick or engulfing candle)
Stop Loss: Below 3,320
Take Profit Targets:
TP1: 3,340
TP2: 3,353 (supply)
TP3: 3,388 (major resistance)
📌 Confirmation Tips:
Bullish price action near 3,322 zone
Momentum buildup from demand
Use M15/M30 for refined entry
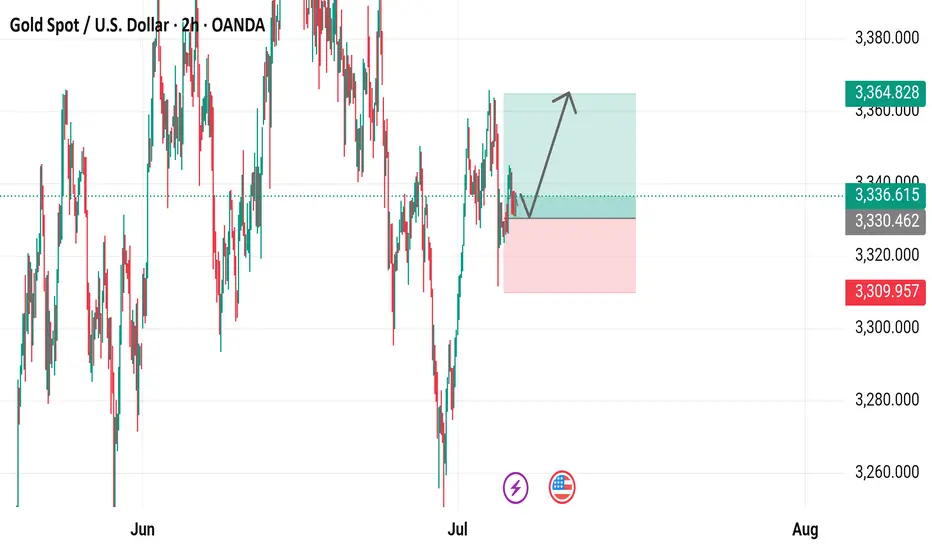
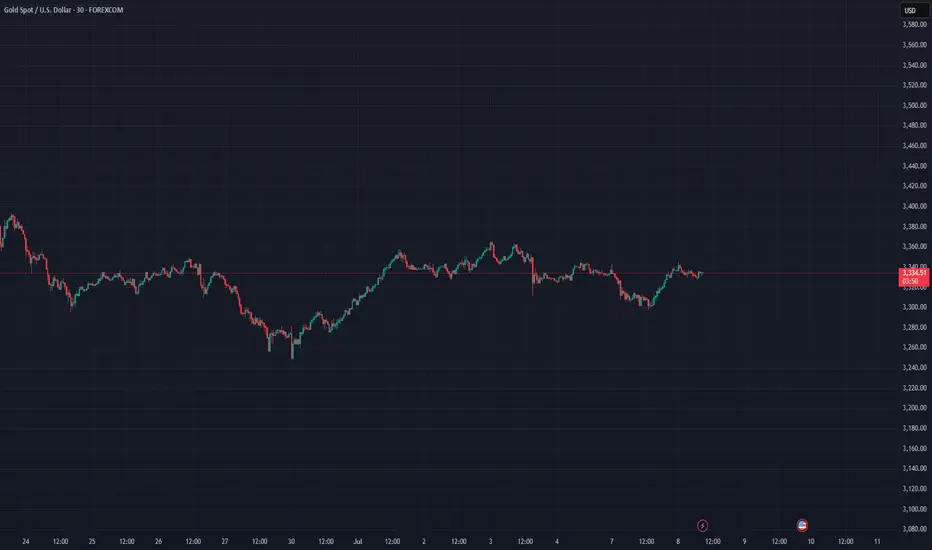
Gold Spot / U.S. Dollar (XAUUSD) 2-Hour Chart2-hour chart from OANDA displays the recent price movement of Gold Spot (XAUUSD) against the U.S. Dollar. The current price is $3,336.615, up by $10.585 (+0.32%). The chart highlights a recent upward trend with a buy signal at $3,336.970 and a sell signal at $3,336.260. Key price levels include a resistance zone around $3,364.828 and a support zone near $3,309.957, with the price showing a potential breakout above the recent consolidation range.
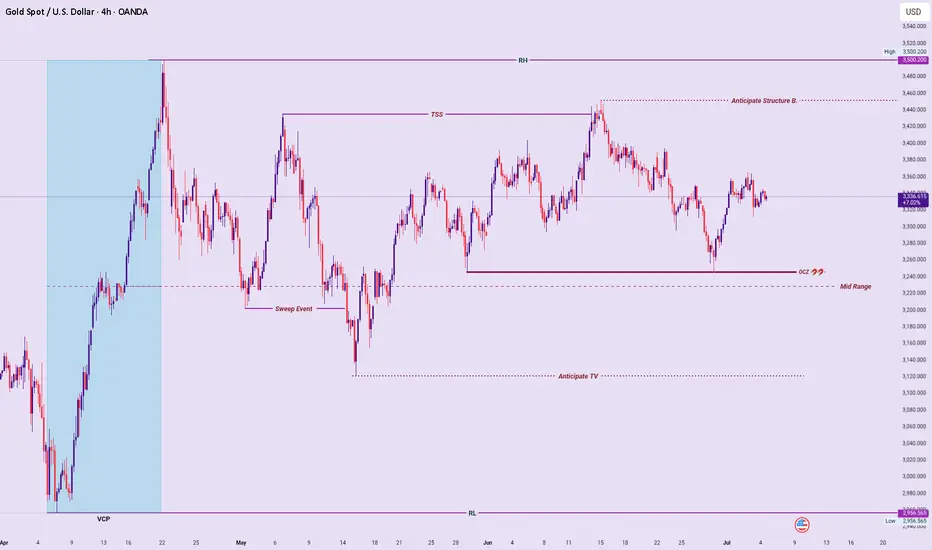
XAUUSD: New-Week Technical Bias (Market Open)Multi-Timeframe Structural Outlook:
Higher Timeframes (Monthly, Weekly, Daily):
Broad structure remains bullish within an Ascend Sequence, though notable Monthly Price Cap Rejections indicate overhead resistance slowing momentum.
Daily & 4H Technical Picture:
Value Compression Phase (VCP):
Price compresses within 3500 – 2956, with consolidation occurring above mid-range, favoring upside continuation probability.
4H Internal Structure:
Aligns with daily compression, showing structural respect of higher lows, maintaining bullish pressure. Above mid-range VCP compression typically signals a breakout potential above 3500.
Liquidity Mechanics & Risk Zones:
Upside:
Early-week bullish lean remains valid, targeting a break and sustained acceptance above 3500, confirming continuation of the Ascend Sequence.
Downside Invalidations:
A decisive breakdown below Order Clustering Zones (OCZ) and anticipated Trap Vectors (TV), leading price into/below the VCP range low (2956), would signal bearish vulnerability and invalidate bullish continuation.
Summary:
Early-week bullish bias preferred while price holds above mid-range compression. Breakdown below OCZ & VCP range low triggers trend deterioration signals.
XAUUSD TRADE SETUPWait for retest the entry level then take a trade for BUY otherwise skip this setup
GOLD Breakout or Fakeout? Thief’s Guide to Safely Rob the Move!🏆 XAU/USD Master Plan: Loot the Bullish Rally Before the Bearish Trap!💨💰
🌟 Hola! Bonjour! Hallo! Marhaba! 🌟
Attention Money Makers & Market Robbers! 🤑💸
🔥 Thief Trading Strategy Alert 🔥
Time to execute our gold heist on XAU/USD! Based on technical + fundamental looting tactics, here’s the play:
📈 ENTRY ZONES (4H TIMEFRAME)
BUY: Sneak in at Market Maker’s Buy Zone (Pullback Entries Only!).
SELL: "The vault’s wide open!"—Ambush bearish traps at risky highs (Red Zone).
🛑 STOP-LOSS (THIEF RULES)
Hide your SL at:
Past key lows OR nearest swing low (4H).
Adjust based on your risk, lot size, & robbery multiplier.
🎯 TARGET: 3525.00 (OR ESCAPE EARTHER!)
Scalpers: Long-side only! Trail your SL to lock loot.
Swing Thieves: Join forces—big pockets or small, execute the plan!
⚠️ WARNING: NEWS = VOLATILITY TRAPS!
Avoid new trades during news.
Use trailing SL to protect stolen profits.
📰 FUNDAMENTAL LOOT LIST (READ BEFORE HEIST!)
COT Report, Macro Data, Sentiment Outlook—Link in bi0! 🔗🤙🏻👉🏻👉🏻
Gold’s bullish now… but robbers adapt fast!
💥 BOOST THIS PLAN = STRONGER GANG!
Hit 👍 & Share—More boosts = More gold stolen daily!
Stay tuned… Next heist drops soon! 🚀🐱👤

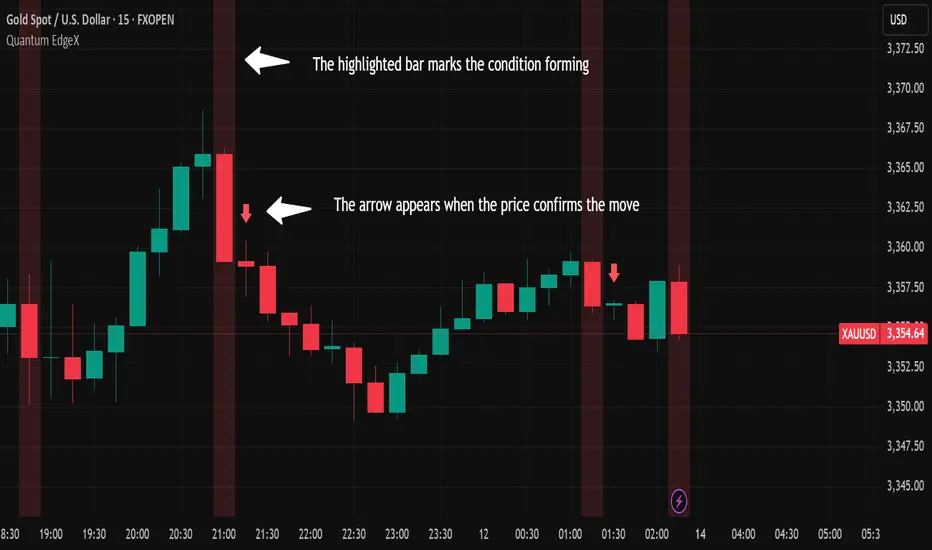
HOW - TO : Use Quantum EdgeX IndicatorQuantum EdgeX is a visual trading tool designed to help identify potential trend reversals to the downside based on RSI and price behavior. It works across different Instruments and timeframes
What It Does:
1.Quantum EdgeX monitors overall price behavior in relation to RSI dynamics and marks potential moments where weakness may be forming.
2.It plots a arrow above the bar when specific conditions are detected and highlights the relevant candle in the background to help you visually track the event.
3.The background highlight remains visible even after a arrow is shown, giving users a visual reference of the condition.
How to Use:
1.Apply Quantum EdgeX to any chart — works for all instruments.
2.Compatible with any timeframe.
3.Best used to support your existing trading analysis.
4. Use the indicator directly as all settings are locked and pre-configured, so there is no need to change anything.
Example Chart:
Access:
This is a Public Invite-Only indicator.
To request access, send a message through my Trading View profile.
⚠️ Disclaimer:
This script is for educational purposes only and is not financial advice. Always use your own analysis and risk management before entering any trade.
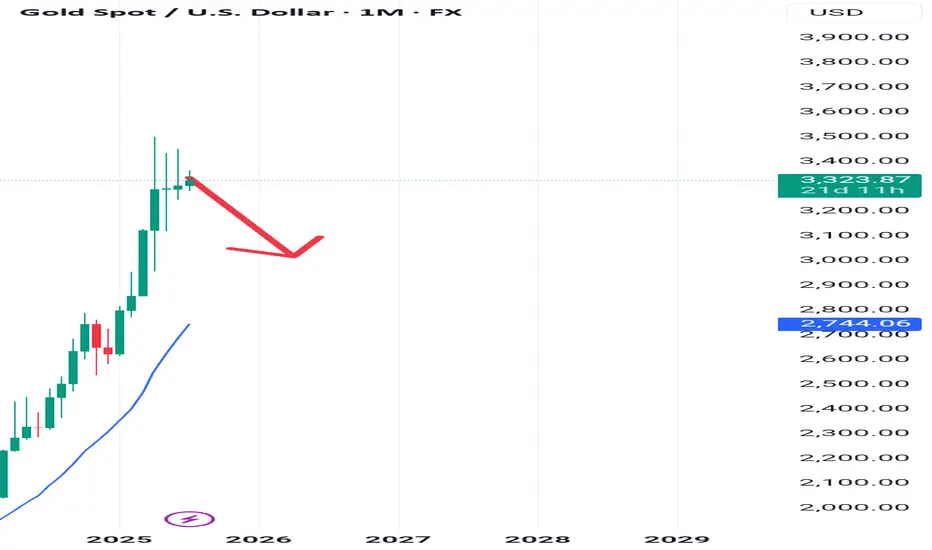
Gold - $3000; on the cards / shortGold has been rising over the years now without any monthly bearish candles.
Now three monthly bearish candles showing immense selling pressure against the rising trend.
Anticipating a bearish move towards $3000 area.
XAU/USD 10 July 2025 Intraday AnalysisH4 Analysis:
-> Swing: Bullish.
-> Internal: Bullish.
You will note that price has targeted weak internal high on two separate occasions forming a double top which is a bearish reversal pattern. This is in-line with HTF bearish pullback phase.
Remainder of analysis and bias remains the same as analysis dated 23 April 2025.
Price has now printed a bearish CHoCH according to my analysis yesterday.
Price is now trading within an established internal range.
Intraday Expectation:
Price to trade down to either discount of internal 50% EQ, or H4 demand zone before targeting weak internal high priced at 3,500.200.
Note:
The Federal Reserve’s sustained dovish stance, coupled with ongoing geopolitical uncertainties, is likely to prolong heightened volatility in the gold market. Given this elevated risk environment, traders should exercise caution and recalibrate risk management strategies to navigate potential price fluctuations effectively.
Additionally, gold pricing remains sensitive to broader macroeconomic developments, including policy decisions under President Trump. Shifts in geopolitical strategy and economic directives could further amplify uncertainty, contributing to market repricing dynamics.
H4 Chart:
M15 Analysis:
-> Swing: Bullish.
-> Internal: Bullish.
H4 Timeframe - Price has failed to target weak internal high, therefore, it would not be unrealistic if price printed a bearish iBOS.
The remainder of my analysis shall remain the same as analysis dated 13 June 2025, apart from target price.
As per my analysis dated 22 May 2025 whereby I mentioned price can be seen to be reacting at discount of 50% EQ on H4 timeframe, therefore, it is a viable alternative that price could potentially print a bullish iBOS on M15 timeframe despite internal structure being bearish.
Price has printed a bullish iBOS followed by a bearish CHoCH, which indicates, but does not confirm, bearish pullback phase initiation. I will however continue to monitor, with respect to depth of pullback.
Intraday Expectation:
Price to continue bearish, react at either M15 supply zone, or discount of 50% internal EQ before targeting weak internal high priced at 3,451.375.
Note:
Gold remains highly volatile amid the Federal Reserve's continued dovish stance, persistent and escalating geopolitical uncertainties. Traders should implement robust risk management strategies and remain vigilant, as price swings may become more pronounced in this elevated volatility environment.
Additionally, President Trump’s recent tariff announcements are expected to further amplify market turbulence, potentially triggering sharp price fluctuations and whipsaws.
M15 Chart:
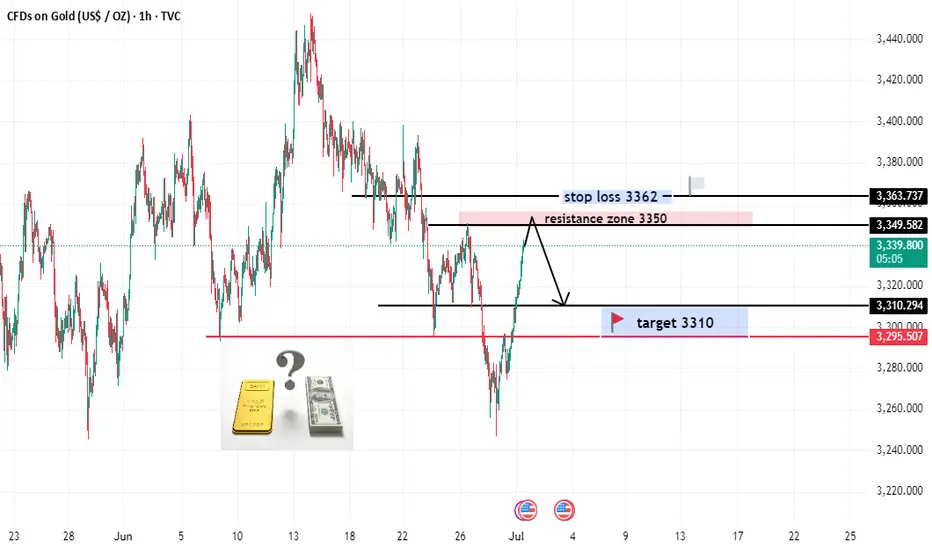
XAUUSD SELL OR BUY (READ CAPTION)Hi trader's what do you think about gold
current price: 3340
gold is rest now in resistance zone i think gold retest down side and giving retrcement
resistance zone 3345_3350
target point :3316_3310
stop loss 3362
please like comment and follow thank you
Report - 8 jully, 2025Trump Grants Three-Week Tariff Reprieve
President Trump has extended the pause on sweeping reciprocal tariffs from July 9 to August 1, providing critical breathing room for US trading partners to negotiate. While this delay briefly steadied sentiment, his renewed threats — specifically a 25% tariff on Japan and South Korea — have reignited global trade fears.
S&P 500 fell 0.9% after the announcement, Nasdaq dropped 0.8%, and the Dow retreated similarly.
Japanese yen and Korean won weakened 1.1% against the USD, underscoring capital flight and potential export growth fears.
Analysts expect continued volatility, but ING suggests the fallout should not match April’s sharp correction when tariffs first roiled markets.
Ukraine Reshuffle: Diplomatic Realignment
Ukrainian President Zelenskyy agreed to replace Ambassador Markarova after criticism from Republicans about her close ties to Democrats. The reshuffle is framed as an effort to "appease" Trump amid paused US arms deliveries.
Zelenskyy also plans to restructure his cabinet next week, emphasizing consolidation of control by his chief of staff, Andriy Yermak.
Potential ambassador candidates include Prime Minister Shmyhal and senior ministers, signaling strategic alignment with US interests.
Russian Transport Minister’s Apparent Suicide
Russia's transport minister, Roman Starovoyt, was found dead in a suspected suicide after his dismissal by President Putin amid a corruption probe.
The case highlights severe internal pressures and the Kremlin’s tightening control.
The Kursk region scandal has drawn public criticism over failed defense construction during Ukraine’s advances.
Germany’s AfD Attempts Image Moderation
The far-right Alternative for Germany (AfD) party introduced a new code of conduct to improve its parliamentary image and broaden voter appeal.
With AfD declared a right-wing extremist group by domestic intelligence, any moderation effort reflects broader attempts to legitimize and normalize extremist platforms before 2029 elections.
China-EU Climate Standoff
The EU declined China’s push for a joint climate declaration ahead of Xi–von der Leyen meetings. Brussels demands firmer emission reduction commitments, reflecting tensions around trade and Russia policy.
The EU proposed a 90% emission reduction by 2040 but faces pushback internally amid fears of economic competitiveness loss.
China remains the world’s largest emitter, and the EU is wary of soft pledges lacking concrete policy changes.
LG Energy Solution Surges on Biden Tax Incentives
LGES posted a 152% YoY surge in Q2 operating profit (₩492bn), defying lower EV demand, largely due to advanced manufacturing tax credits from the US Inflation Reduction Act.
Despite falling sales (-9.7% YoY), early front-loading by automakers helped offset volume risks.
Trump’s new budget plan scraps consumer EV credits but retains production incentives to 2032, which supports battery manufacturers like LGES but may soften downstream demand.
Royal Gold’s $3.7bn Acquisitions Signal Gold M&A Wave
Royal Gold is acquiring Sandstorm Gold and Horizon Copper, expanding its portfolio to 80 producing assets and 266 exploration-stage properties.
Gold’s price strength has fueled an "animal spirits" surge in mining M&A.
Royal Gold’s market cap is projected to rise to ~$15.4bn, reinforcing its position as the only US-based large-cap pure gold streaming and royalty company.
Sibanye-Stillwater Calls for Western Price Support
CEO Neal Froneman advocated for price guarantees on critical minerals to offset Chinese competitive advantages.
He warned that de-globalization trends require Western miners to receive direct support to stay viable.
Sibanye’s expansion into lithium and nickel (Finland and France) reflects the shift to battery metals, but profitability is challenged by higher capital costs and lower platinum/palladium prices.
BP Strengthens Board with Ex-Shell CFO
Simon Henry joins BP’s board to bolster oil & gas expertise amid renewed investor pressure and possible takeover speculation.
BP recently pivoted back to traditional hydrocarbons after Elliott Management took a large stake and pushed for strategic shifts.
BP’s shares have lagged peers, making governance and board composition critical to fend off activist threats.
------------
US Equity Market Sector Trends
From your dashboards:
Utilities (+0.21%) and Staples (+0.07%) were the only positive sectors, highlighting defensive repositioning.
Tech (-0.73%), Discretionary (-1.27%), and Communications (-0.96%) led the declines, reflecting tariff fears and profit-taking in high-beta growth stocks.
Industrials (-0.52%) and Materials (-0.88%) were under pressure, signaling investor concerns over input costs and global demand.
Factors and Style Performance
Low volatility (+0.41%) and momentum (+0.41%) factors outperformed, indicating a flight to stability.
Small caps underperformed sharply (down ~1%), reflecting their greater sensitivity to domestic and policy risks.
Value and high dividend yield factors were slightly negative, reinforcing cautious sentiment.
Currency and Rates Moves
US dollar gained 0.2% against a basket of major currencies, driven by safe haven flows.
EUR/USD slipped 0.5%, and GBP/USD declined 0.3%.
USD/JPY climbed, reflecting yen weakness.
US 10-year Treasury yield rose to 4.39% (+0.05 pp), signaling investor rotation from bonds to cash amid tariff fears.
Global yields mostly edged higher; UK 10-year gilt rose to 4.59%.
Commodities
Gold slipped slightly (-0.1%), despite general risk-off sentiment, reflecting dollar strength and potential profit-taking after recent highs.
Crude oil gained ~1.7% (WTI at $67.97), supported by geopolitical tension and potential supply disruptions.
Industrial metals broadly fell, notably copper (-2.4%), due to China rerouting exports and tariff concerns.
Agricultural commodities showed mixed performance; soybeans and wheat fell (~-2.4%), reflecting improved harvest outlooks.
Global Equity Markets & Country ETFs
European equities showed resilience: DAX +1.2%, CAC 40 +0.4%.
Asia-Pacific mixed: Nikkei -0.8%, China slightly positive, reflecting capital reallocation and local policy adjustments.
Emerging markets underperformed slightly (MSCI EM down ~1.4%), as USD strength pressured flows.
Notably strong YTD performers include Brazil (+16%) and Mexico (+13%), while China and Japan remain subdued.
Fixed Income and Credit Conditions
US fixed income ETFs mostly red; long-duration Treasuries (20+ years) underperformed sharply (-1.0%), reflecting rate sensitivity.
High-yield spreads narrowed slightly, but issuance remains cautious given tariff-related macro risks.
Municipal bonds and short-term corporates showed slight positive performance, reflecting defensive rotation.
Macro Themes & Outlook
Trade Policy Risks Intensify: Extension to August 1 provides temporary relief but does not remove risk. Markets fear escalation with Japan, South Korea, and potentially the EU.
Rotation to Defensives: Investors shifted into utilities, staples, and low-volatility plays, anticipating higher volatility and lower global growth.
Dollar Strength & Rate Adjustments: Strength in USD and higher yields could challenge risk assets, especially in emerging markets.
Commodity Divergence: Energy remains firm on geopolitical concerns; metals weak amid China rerouting and uncertain demand.
Corporate Actions and M&A: Gold sector consolidations continue (e.g., Royal Gold’s $3.7bn acquisitions), indicating bullishness in precious metals, contrasting weakness in industrials and agriculture.
Conclusion & Strategy View
In the near term, we expect continued volatility around August 1 as the tariff deadline nears. Defensive positioning remains prudent, favoring cash, high-quality bonds, and low-volatility equities. For commodities, energy and precious metals are relatively better supported, while industrial metals and agriculture face demand and trade headwinds.
Currency-wise, the USD strength may persist, pressuring EM assets and riskier FX pairs.
We recommend closely monitoring further White House communications and bilateral trade talks, particularly involving Japan and South Korea, to reassess global risk exposure and sector allocations.
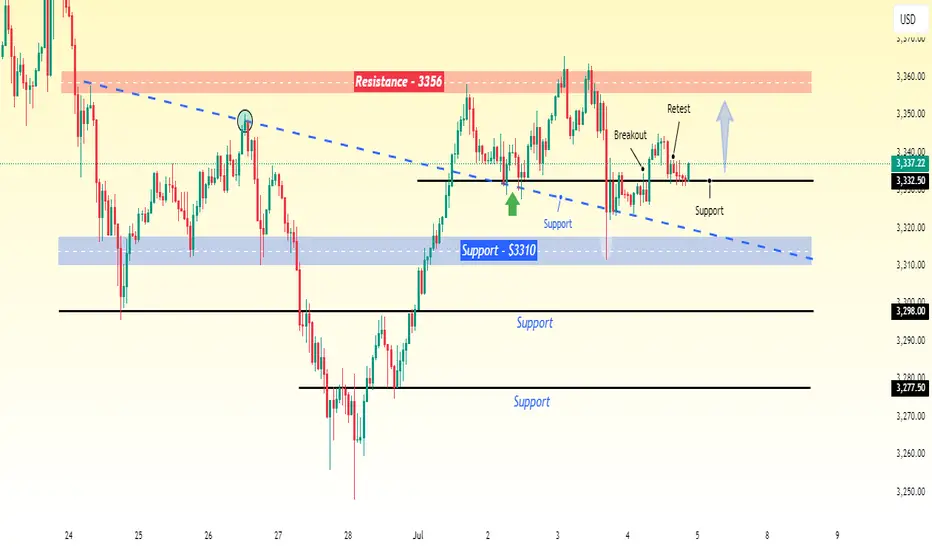
Gold Holding Strong – A Move to $3356 Could Be NextGold is currently trading at $3337, which is an important support level. Earlier, the price dropped to around $3310, but it has since started to recover from that level. This bounce suggests that buyers are stepping in, and the market is showing some strength.
Based on this recovery and the strong support at $3332.50, I expect the price of gold to move higher, possibly reaching around $3356 in the short term.
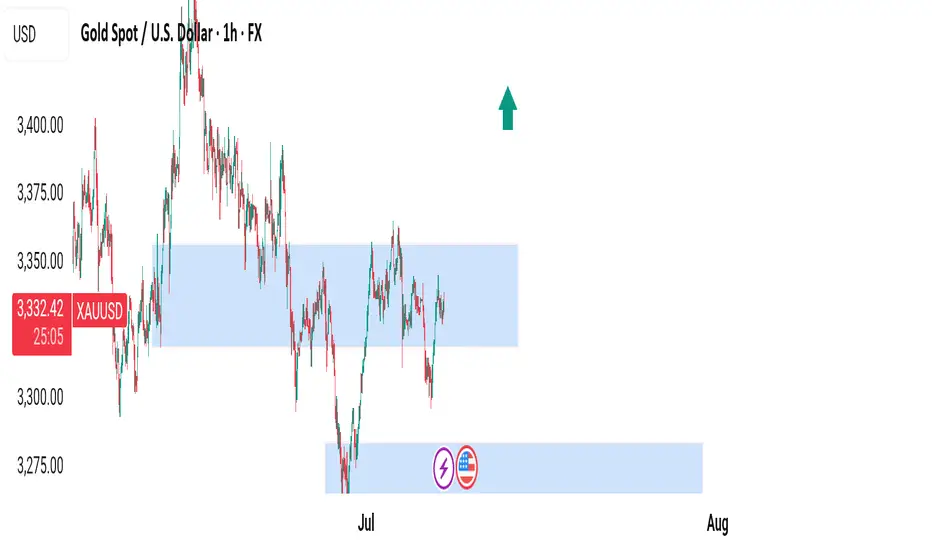
GOLD - POTENTIALLooking at gold. Its still in a bit of limbo after the NFP reaction on Friday. However it is looking like the draw on liquidity is higher. Therefore my bias on gold for the start of the week is bullish so will be looking to get the most optimal entry to take some buys to the upside.
If we can manage to find a decent enough move price really could rally upwards.
XAUUSD (Upcoming Plan with 2 Scenarios) Analysis for the upcoming week (InShaaAllah) (2 Scenarios)
Breaking: Trump says tariff letters to 12 countries signed, going out Monday...
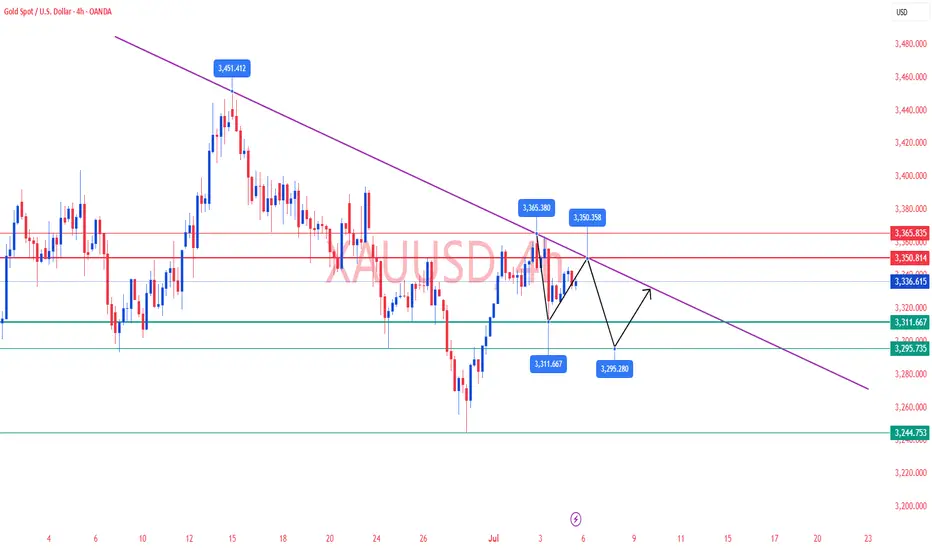
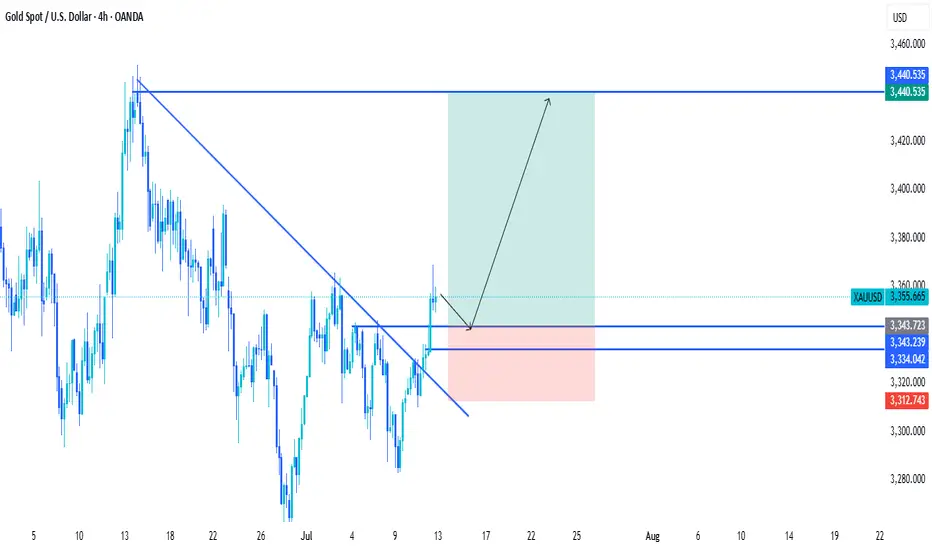
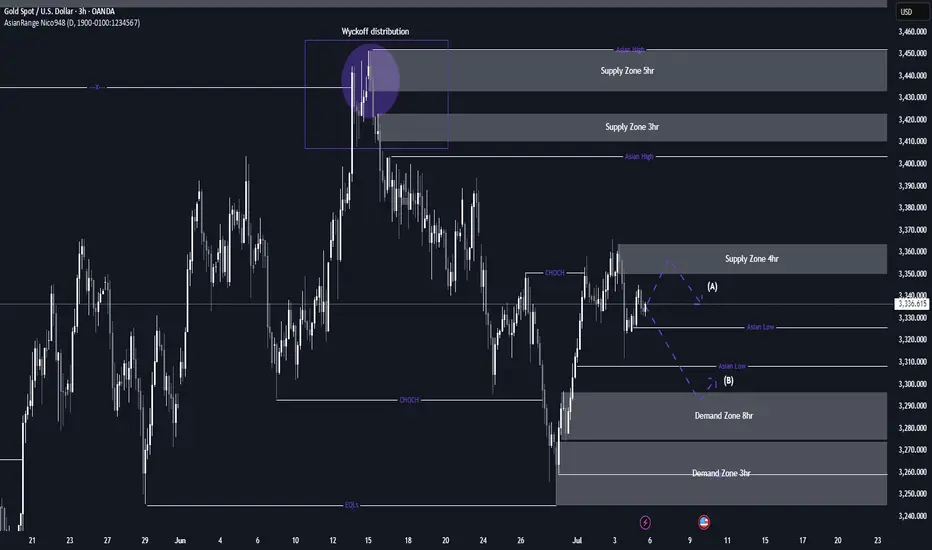
XAU/USD possible shorts from 3,350 towards 3,290 longsThis week, my focus is on a potential sell setup that could form within the 4-hour supply zone, which is currently near price. I’ll be patiently watching for signs of Wyckoff distribution within this point of interest (POI), which could confirm a short opportunity.
Given that price action has been bearish, this would be a pro-trend setup, especially with the visible liquidity resting below that we can look to target. Additionally, there is an 8-hour demand zone further below, which may provide a potential long opportunity once price reaches that level.
Confluences for GOLD Sells:
- Bearish market structure: Gold has been trending downward and has recently left behind a clean, unmitigated 4-hour supply zone, which could prompt a bearish reaction.
- Liquidity targets below: There's significant liquidity under recent lows, including Asia session lows and the 8-hour demand zone, which can be targeted.
- DXY correlation: The dollar has reacted strongly from a notable demand zone, suggesting potential upside for DXY, which may add bearish pressure on gold.
- Higher timeframe Wyckoff: A Wyckoff distribution pattern has also formed on the higher timeframe, which may indicate temporary bearish order flow.
P.S. If price disrespects the current 4-hour supply zone, I will shift focus to an extreme 3-hour supply zone above. Until price reaches that level, I may look for short-term buy setups to trade the move up.
Wishing everyone a great and profitable trading week! Stay disciplined and manage risk accordingly.
current Gold position live gold Break down all targets set looking to day trade and hold over the span of a day
