Gold continues to be weak, but be careful about operations📣Gold prices fell 2% last Friday, hitting a near one-month low. Optimistic trade-related agreements boosted risk appetite and weakened the attractiveness of gold as a safe-haven asset. This week, the market will usher in a group meeting of major central bank governors around the world (Fed Chairman Powell, European Central Bank President Lagarde, Bank of England Governor Bailey, Bank of Japan Governor Kazuo Ueda, and Bank of Korea Governor Lee Chang-yong). The market will also usher in non-agricultural data. In addition, Powell's remarks on whether to resign may ignite the market this week. Gold prices may fluctuate more around the lower track of the Bollinger Band at $3,270/ounce this week.
Technical analysis:
Last Friday, the K-line had a lower shadow, and the Bollinger Band did not diverge. It is not easy to go short directly in operation, but wait for the rebound to confirm 3295 and the key resistance of ma5 to be short.
💰 Operation strategy: Rebound to 3280-3283 to go short, target 3270-3265, stop loss 3288-3290
If you are a beginner, I suggest you first understand what trading is.
XAUUSDG trade ideas
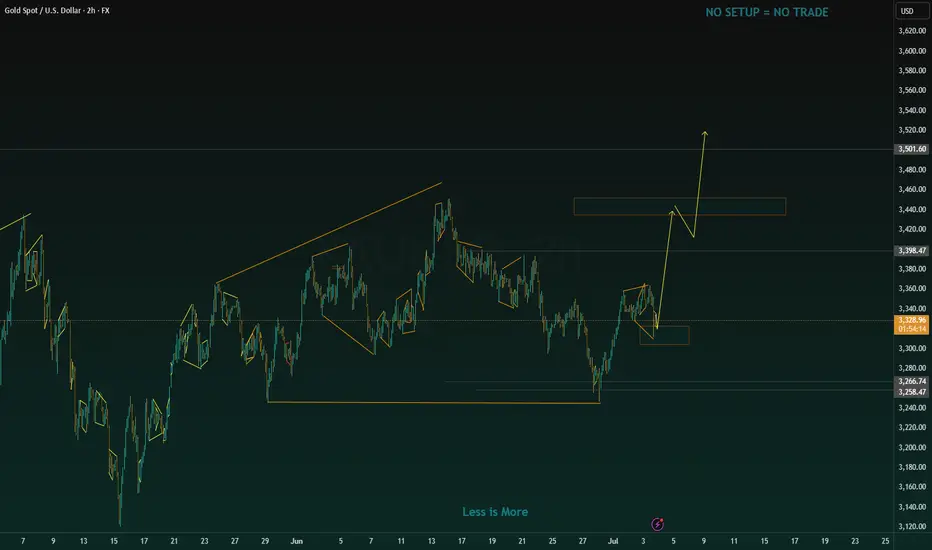
Lingrid | GOLD Weekly Analysis: Risk-Off Trade Unwinds OANDA:XAUUSD endured another challenging week as the Iran-Israel ceasefire continued to diminish safe-haven demand, while robust equity market performance drew capital away from precious metals. The risk-on environment has fundamentally shifted investor priorities, with growth assets overshadowing traditional defensive plays like gold.
The chart reveals gold testing the crucial $3,270 support zone, representing a significant confluence level where the upward trendline intersects with horizontal support. This area has historically provided strong buying interest and serves as a critical inflection point for gold's medium-term direction.
From a broader perspective, the 4H chart shows gold approaching the lower boundary of its established upward channel around $3,250. The pullback from the HH near $3,450 has accelerated through multiple support levels, with the downward trendline acting as dynamic support to any recovery attempts.
A decisive break below the $3,235 - $3,250 support confluence could trigger further selling toward the $3,200 major support zone. However, the long-term upward trendline dating back several months provides substantial technical backing. A successful defense of current levels would likely attract value buyers and could spark a relief rally toward the $3,330-$3,350 resistance area, particularly if geopolitical tensions resurface or equity markets show signs of fatigue.
If this idea resonates with you or you have your own opinion, traders, hit the comments. I’m excited to read your thoughts!

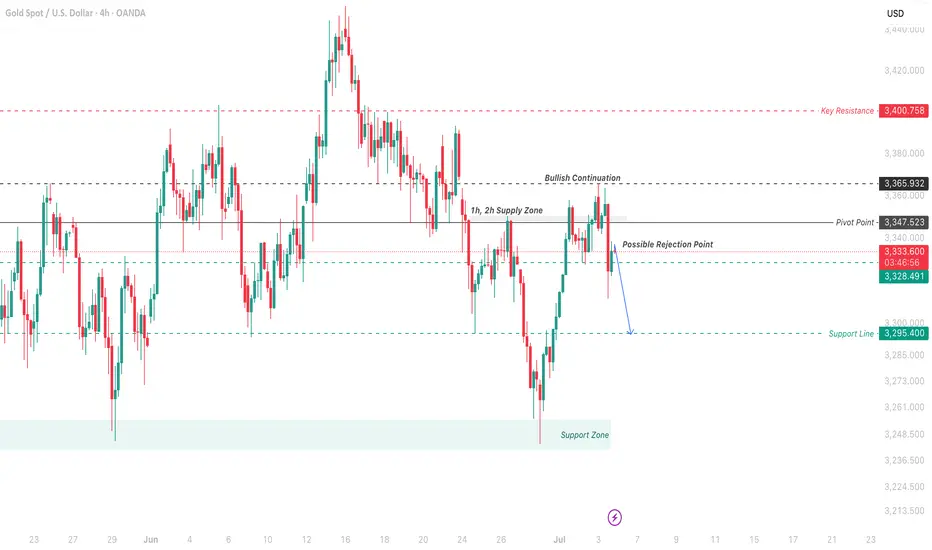
XAU/USD remains subdued beneath 3352, with downward pressure perXAU/USD Below Pivot, Eyes on 3352 for Bullish Clarity
Gold remains pressured under the 3347 pivot and the 3352 resistance, aligning with the 1h–2h supply zone. Despite brief upside attempts, price action still struggles to gain bullish momentum.
A clear 4H close above 3352 is essential to confirm any bullish shift toward 3365. Until then, the sentiment stays bearish, especially with repeated rejections from the pivot and supply zone.
Failure to reclaim 3352-3365 could trigger further downside towards 3320 and 3295, with the support line sitting at 3295.
⸻
Key Levels
Resistance: 3352 · 3365 · 3400
Support: 3320 · 3295 · 3264
Pivot: 3347
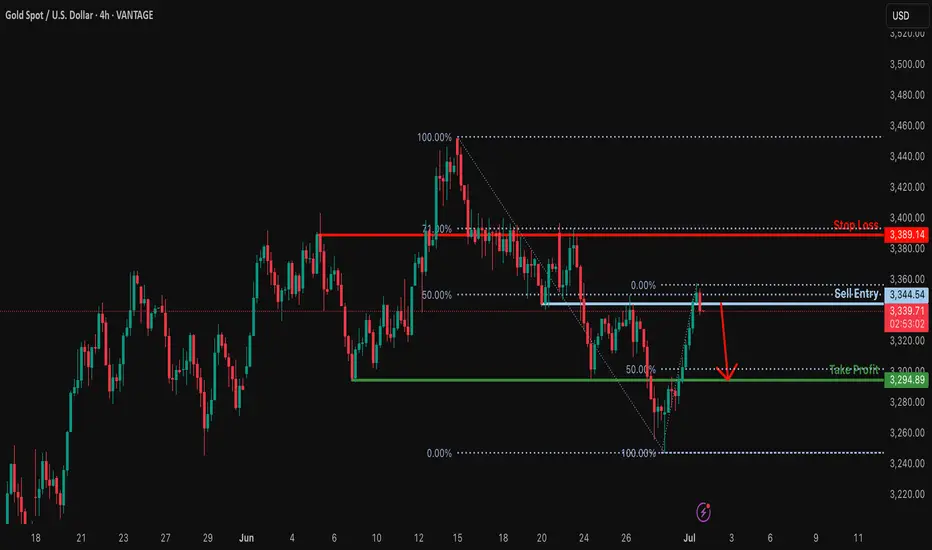
Bearish drop?XAU/USD is reacting off the resistance which is a pullback resistance that lines up with the 50% Fibonacci retracement and could drop from this level to our take profit.
Entry: 3,344.54
Why we like it:
There is a pullback resistance that lines up with the 50% Fibonacci retracement.
Stop loss: 3,389.14
Why we like it:
There is a pullback resistance that lines up with the 71% Fibonacci retracement.
Take prpofit: 3,294.89
Why we like it:
There is a pullback support level that aligns with the 50% Fibonacci retracement.
Enjoying your TradingView experience? Review us!
Please be advised that the information presented on TradingView is provided to Vantage (‘Vantage Global Limited’, ‘we’) by a third-party provider (‘Everest Fortune Group’). Please be reminded that you are solely responsible for the trading decisions on your account. There is a very high degree of risk involved in trading. Any information and/or content is intended entirely for research, educational and informational purposes only and does not constitute investment or consultation advice or investment strategy. The information is not tailored to the investment needs of any specific person and therefore does not involve a consideration of any of the investment objectives, financial situation or needs of any viewer that may receive it. Kindly also note that past performance is not a reliable indicator of future results. Actual results may differ materially from those anticipated in forward-looking or past performance statements. We assume no liability as to the accuracy or completeness of any of the information and/or content provided herein and the Company cannot be held responsible for any omission, mistake nor for any loss or damage including without limitation to any loss of profit which may arise from reliance on any information supplied by Everest Fortune Group.
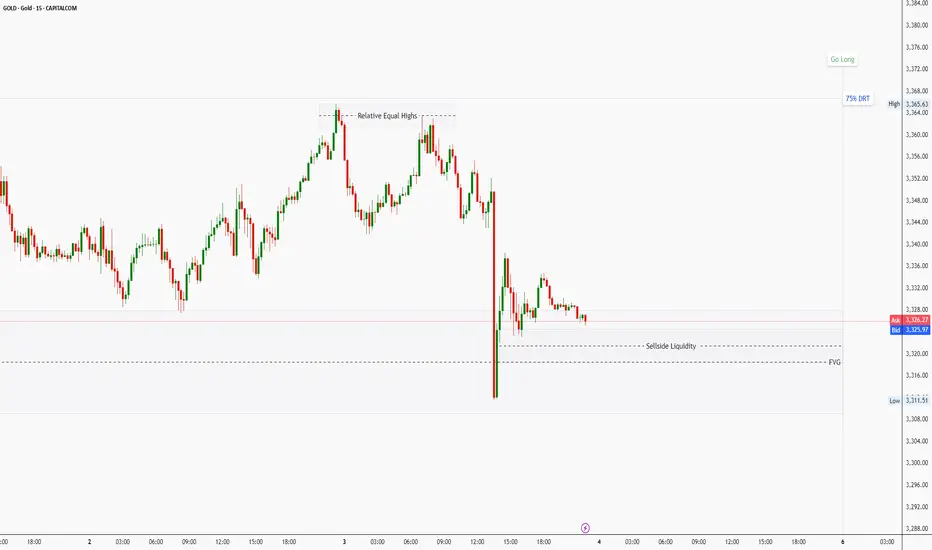
Final Trading Day Outlook for GOLD – Friday Bias and Trade PlanAs we head into the last trading day of the week, here's my outlook for GOLD ( CAPITALCOM:GOLD ):
Bias and Expectation
I was expecting a retracement from the 75% Draw on Liquidity (DRT) level — not just because of the level itself, but also due to its confluence with a Fair Value Gap (FVG) and a Bearish Order Block. And that retracement did occur.
Thursday delivered that deep retracement, courtesy of economic data and news releases. That pullback tapped into a Daily FVG and is now trading above its Consequent Encroachment (CE) at the time of this analysis.
✅ If today’s candle closes above the midpoint of that FVG, it will further confirm my bullish bias.
✅ Even more convincing will be a close above the upper boundary of the FVG, suggesting strength and possible continuation.
Market Structure Across Timeframes
🔸 4H Chart:
Price has raided sell-side liquidity and formed relative equal highs, a sign that the market may seek to attack that zone next — possibly as a liquidity target.
🔸 1H Chart:
The market is currently trading in the premium zone of the FVG, and shows a clear inability to trade lower, further supporting the bullish outlook.
Trade Plan
My trade idea for Friday is as follows:
Wait for a purge (liquidity sweep) on the sell-side, ideally during a Kill Zone (London or NY).
Look for confirmation and confluence based on my model (e.g. displacement, market structure shift).
Enter long positions targeting the next liquidity pool, particularly the equal highs formed on the 4H timeframe.
⚠️ Reminder:
Trade with due diligence. This is not financial advice. Always align entries with your personal model and preferred session.
📌 Final Note
Today may present strong opportunities — but patience, timing, and context are everything. Let the market show its hand, then act.
Thanks for your support!
If you found this idea helpful or insightful, please drop a like 👍 and leave a comment — I’d love to hear your thoughts! 🚀
Follow me for more daily price action insights and trading strategies on XAUUSD and other key markets.
Let’s grow and trade smarter together! 📈
⚠️ Disclaimer
This content is for educational and informational purposes only and does not constitute financial or investment advice.
All trading involves risk. You are solely responsible for your own decisions, so always conduct proper research and due diligence before taking any trades.
Past performance is not indicative of future results. Trade responsibly.
May your final trades of the week be precise and profitable.
BREAK THE HIGHI can see gold getting ready to move upside again. If it's in our favour, check the reaction above the price of 3425. it may give other continuation thee above price 3425 to move more upside
OANDA:XAUUSD FOREXCOM:XAUUSD FXOPEN:XAUUSD FOREXCOM:XAUUSD
As always, market wins! trade with care. be a part of the market
Gold non-agricultural layout strategy
💡Message Strategy
Small non-farm data "big surprise"
The ADP employment report released on Wednesday showed that the number of private employment in the United States decreased by 33,000 in June, the first decline since March 2023. Economists surveyed previously expected the number to increase by 100,000 on average.
The ADP employment report showed that the number of private employment in the United States fell for the first time in more than two years in June, indicating that the Federal Reserve may cut interest rates as early as September.
Spot gold closed up $18.20 on Wednesday at $3,356.90 per ounce.
Bednarik pointed out that gold has gained upward momentum recently, with a gold price target of $3,373.50 per ounce. The "big surprise" of the ADP data suggests a weak non-farm payrolls report in June.
📊Technical aspects
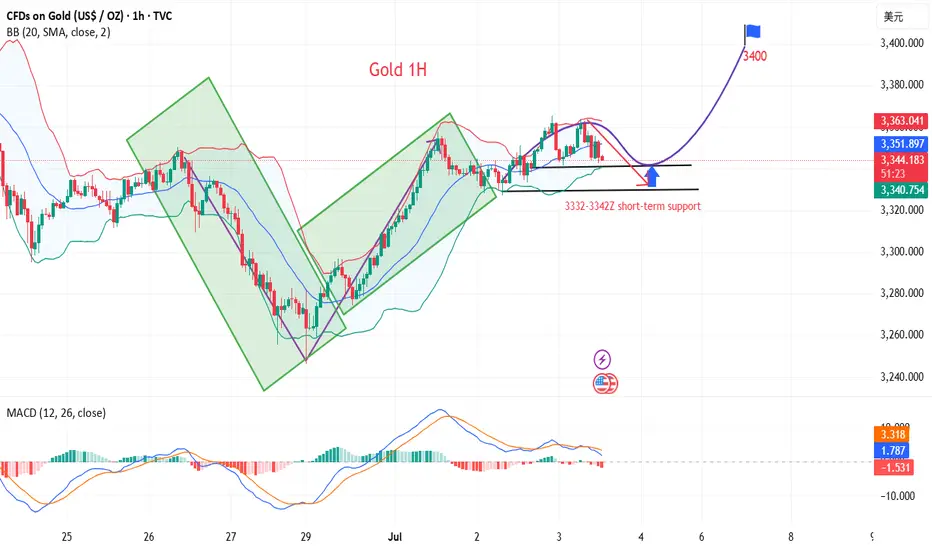
1. The daily line was the support line for the rise in the previous month. It fell back very hard last week and turned into suppression. It was tested repeatedly and finally a big Yin hit the lower track of the pattern. However, it started at a low point this week and rose steadily. Now it has returned to the top of the lifeline again. At this point, the space will consider switching again.
2. The four-hour pattern opens slightly upward, with the lifeline 3330 as the dividing line between strength and weakness. Hold here and climb upward step by step.
3. The double lines on the hourly chart formed a dead cross after breaking through and turning into pressure last week, which helped to further increase the volume and fall by more than 100 US dollars. After breaking through and standing on it this time, it turned into support. The double line range is 3332-3342. This area is used as the boundary to switch between the upper and lower spaces. The support line for the bulls to dominate is the upper rail position of 3332, and the support line for the bulls to sweep is the lower rail position of 3316
💰Strategy Package
Long Position:3332-3340,SL:3316,Target: 3400
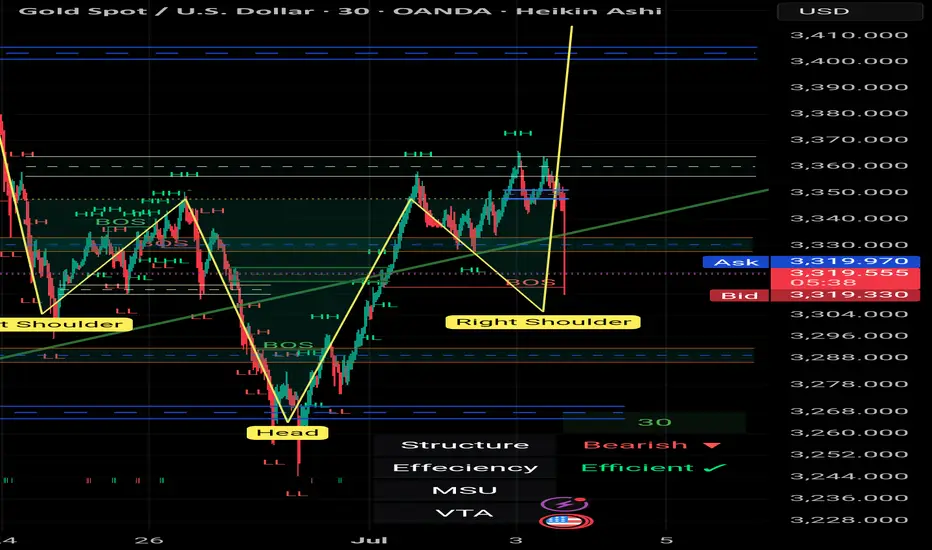
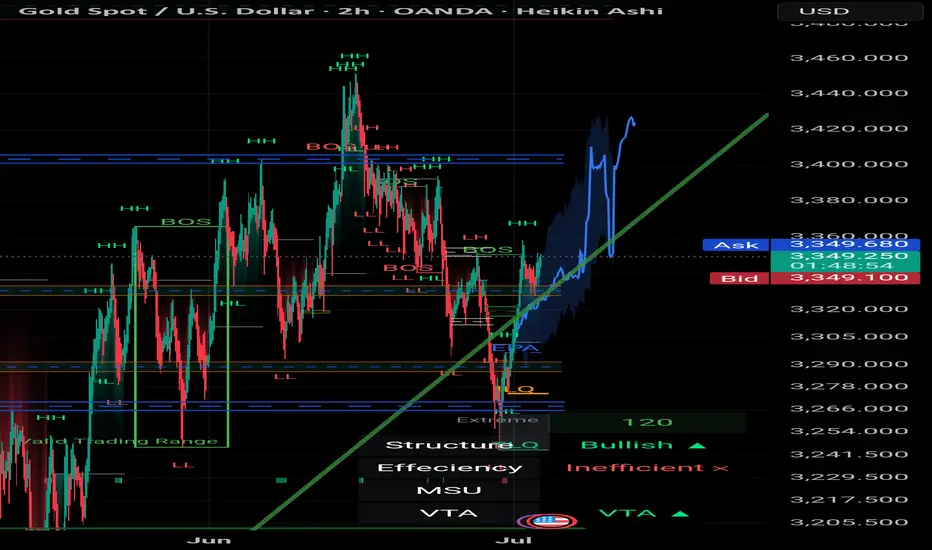
I say nothing , you say me any thing about 📌 **Gold Spot (XAU/USD) – 30m | 2h | Smart Money Perspective**
🔍 After weeks of precision tracking and structural validation, price has now tapped the **Right Shoulder** of a clean *Reverse Head & Shoulders* formation — with absolute respect to structure, liquidity, and OB zones.
💥 This wasn't just a random bounce.
It was:
- A confirmation of **previous BOS & CHoCH**
- A retest of **TLQ/ILQ liquidity zones**
- A reaction from the *Extreme OB* within a compression channel
- And a final push fueled by **inefficiency fills** on the left
🎯 The bullish intent remains strong, and if momentum follows through, we're looking at:
- **TP1** → 3345–3355 (minor OB & void fill)
- **TP2** → 3375–3390 (liquidity sweep target)
- **TP3** → 3420+ (range expansion goal)
🧠 This analysis has not just been correct.
It’s been **respected by the market.**
I take pride in every reaction the chart gives us when we respect the language of price, structure, and timing.
There’s no shortcut here — just observation, logic, and discipline.
We don’t chase the trend. We wait for it to **bow in confirmation**.
Like it just did.
— *Mohsen Mozafari Nejad* 🧭
#SmartMoney #GoldAnalysis #XAUUSD #TradingView #MarketStructure #BOS #OB #MSU #ReverseHeadAndShoulders #Forex #TechnicalAnalysis
GOLD 30Min Engaged ( Bullish Reversal Entry Detected )➕ Objective: Precision Volume Execution
Time Frame: 30-Minute Warfare
Entry Protocol: Only after volume-verified breakout
🩸 Bullish Reversal : 3318
Volume Poc + Value
➗ Hanzo Protocol: Volume-Tiered Entry Authority
➕ Zone Activated: Dynamic market pressure detected.
The level isn’t just price — it’s a memory of where they moved size.
Volume is rising beneath the surface — not noise, but preparation.
🔥 Tactical Note:
We wait for the energy signature — when volume betrays intention.
The trap gets set. The weak follow. We execute.
Gold 30M Engaged ( Dual Entry's Detected )
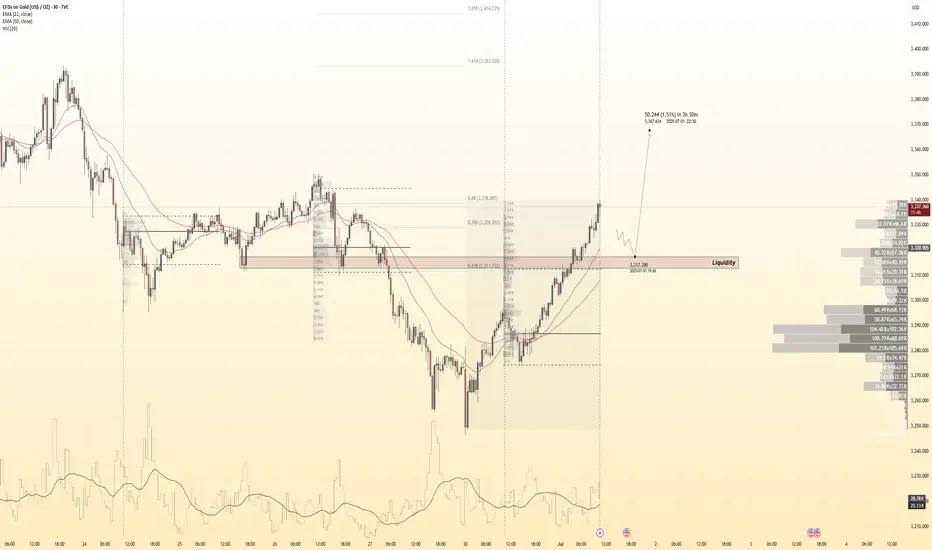
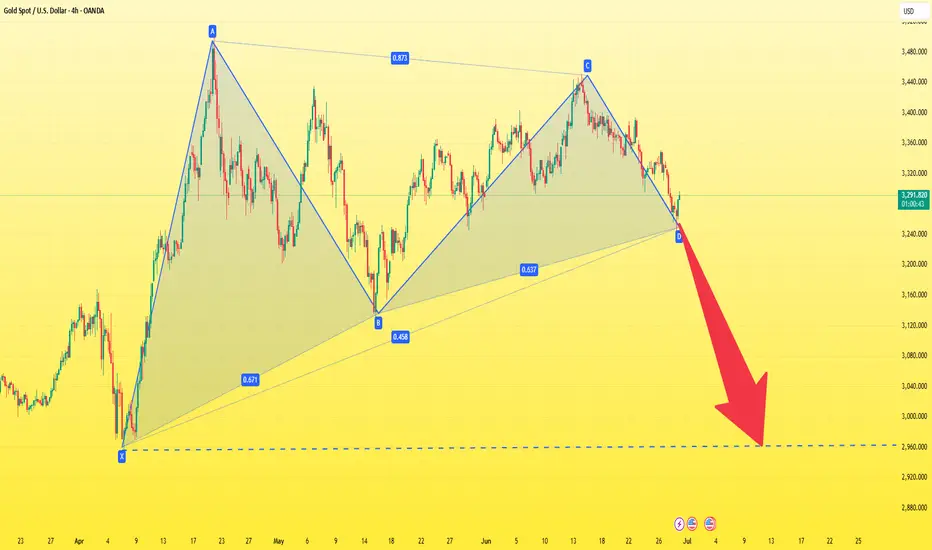
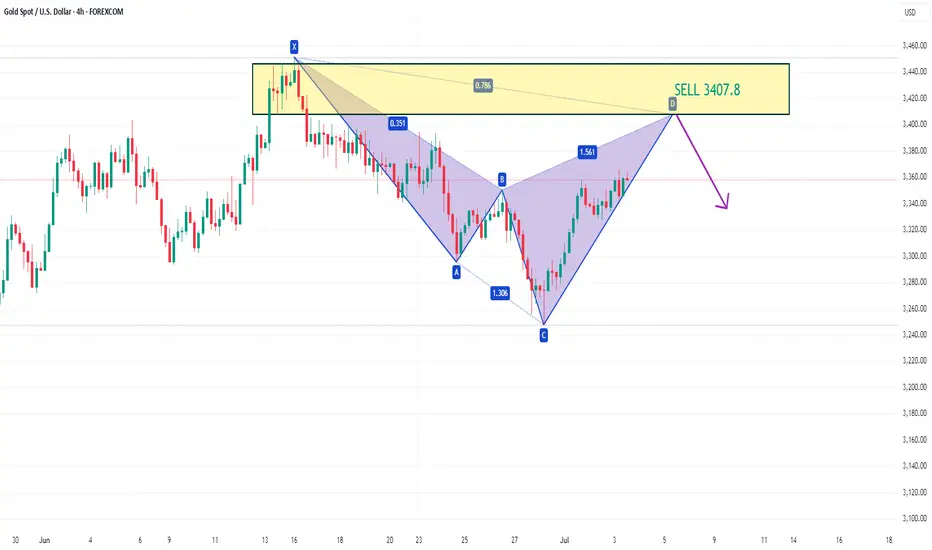
XAUUSD potential Cypher patternOn the 4-hour chart, XAUUSD is fluctuating upward in the short term, and bulls have the upper hand. Currently, XAUUSD is expected to continue to rise, and the price may return to above $3,400. When the price reaches around 3,407.8, you can pay attention to the potential bearish Cypher pattern, which is in the previous supply area.
Gold is Ready For The Next Bullish Run- Taking a Long Trade HereAfter a series of bearish structures on 4Hour time frame, which is actually a bullish retracement on higher time frame, Gold has now broke the bearish structure with series of bullish candles which turned the trend from bearish to bullish trend.
After the bullish break of structure, Gold retrace into a fair value price level, formed a swing low plus a bullish price action which further confirmed the bullishness of Gold, which is were I took an entry for a buy long trade.
My target for this trade is for Gold to reach the price level of $3,436 which is a 5.36RR return.
I will be monitoring price and manage my trade accordingly as price move in my direction.
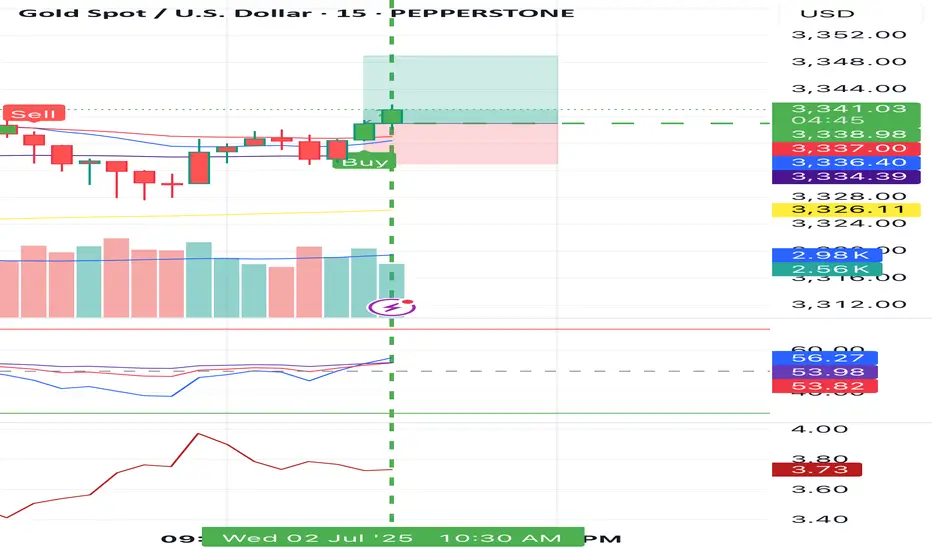
#GOLD Buy 3338.98#GOLD Buy 3338.98
SL 3332.98
TP 3340.98
TP 3348.98
TP 3362.98
Trade at your own risk
Protect your capital
The Wizard 🧙♂️ SWFX
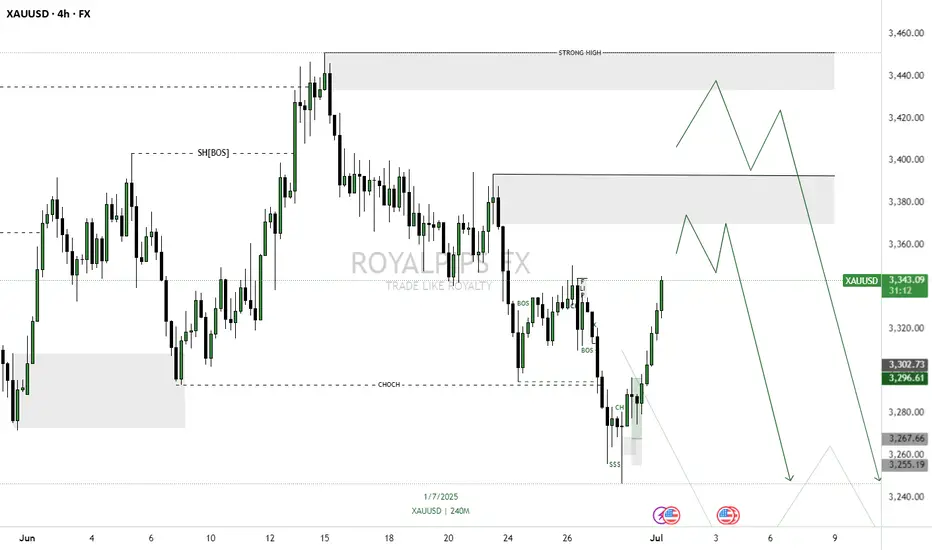
XAUUSD GOING SHORTGOLD has recently broken its last low, shifting market structure (CHOCH) and indicating sellers are currently in control. This break opened up 2 clear Supply Zone above — a small base or last bullish candle before the drop — which is a key area where unfulfilled sell orders may be resting.
Price is likely to retrace back into these Supply Zone to fill those orders. Once it reaches this area, we expect selling pressure to resume and push price downward, honoring the imbalance left by the drop.
Entry:
I’m looking to sell from this Supply Zone on a pullback,
This lets me enter at a premium price while trading in direction of the newly established downward momentum.
Target:
The first Target Profit (TP) is set at the next Demand Zone below, where buying pressure might emerge. This Demand Zone is a key area to watch for a reversal or a temporary halt in downward momentum.
Stop Loss:
To control risk, the Stop Loss (SL) is placed just above the Supply Zone.
If price climbs above this area, it would invalidate the Supply’s ability to hold, signalling a potential reversal.
✅ Summary:
• Market has shifted to bearish after breaking last low.
• Supply Zone above is a key area to watch for selling opportunities.
• Sell upon retracement into Supply, with Stop Loss above and Target at Demand below.
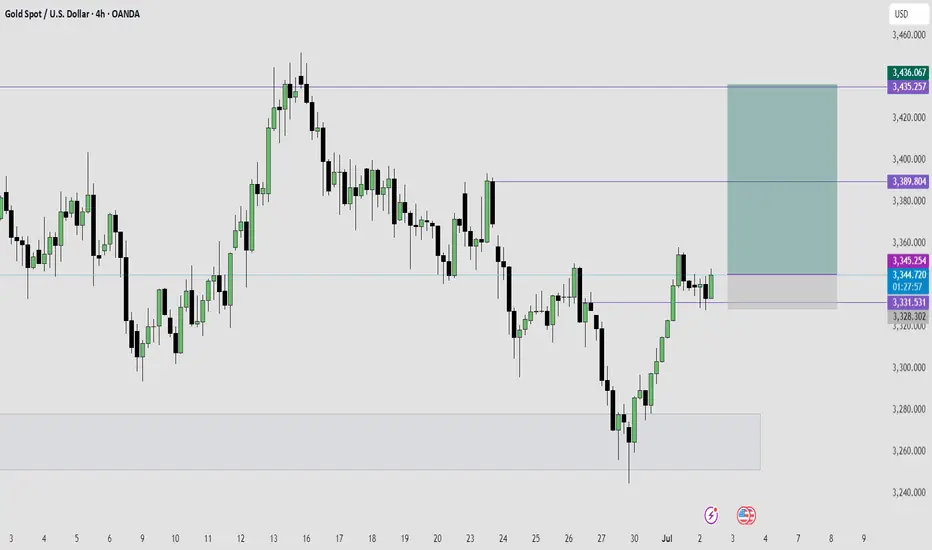
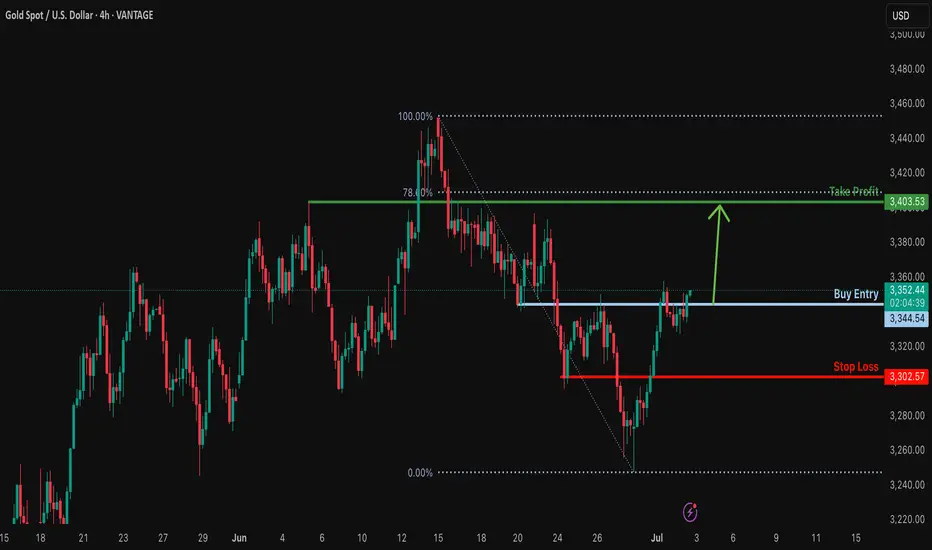
Bullish rise for the Gold?The price is reacting off the resistance level which is a pullback resistance and could potentially rise from this level to our take profit.
Entry: 3,344.54
Why we like it:
There is a pullback resistance level.
Stop loss: 3,302.57
Why we like it:
There is a pullback support level.
Take profit: 3,403.53
Why we like it:
There is a pullback resistance level that lines up with the 78.6% Fibonacci retracement.
Enjoying your TradingView experience? Review us!
Please be advised that the information presented on TradingView is provided to Vantage (‘Vantage Global Limited’, ‘we’) by a third-party provider (‘Everest Fortune Group’). Please be reminded that you are solely responsible for the trading decisions on your account. There is a very high degree of risk involved in trading. Any information and/or content is intended entirely for research, educational and informational purposes only and does not constitute investment or consultation advice or investment strategy. The information is not tailored to the investment needs of any specific person and therefore does not involve a consideration of any of the investment objectives, financial situation or needs of any viewer that may receive it. Kindly also note that past performance is not a reliable indicator of future results. Actual results may differ materially from those anticipated in forward-looking or past performance statements. We assume no liability as to the accuracy or completeness of any of the information and/or content provided herein and the Company cannot be held responsible for any omission, mistake nor for any loss or damage including without limitation to any loss of profit which may arise from reliance on any information supplied by Everest Fortune Group.
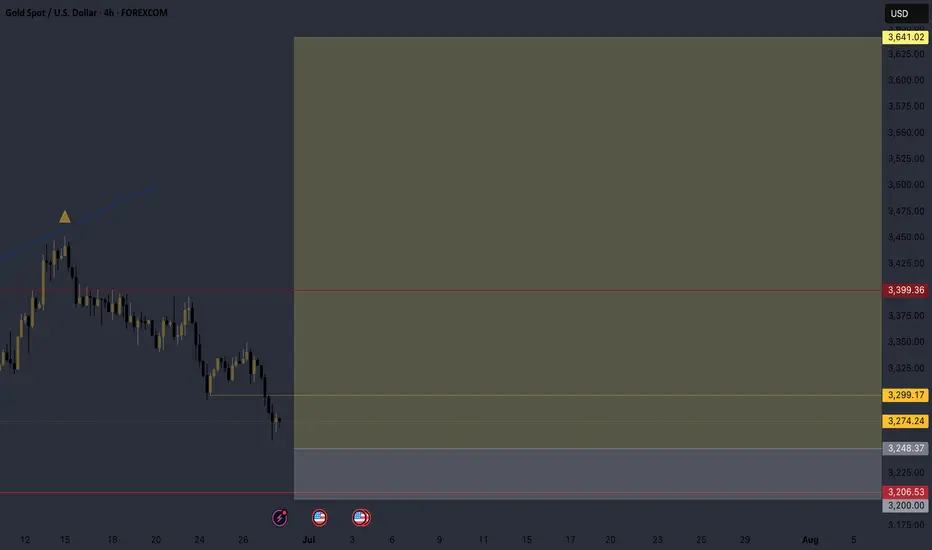
Overall Trajectory BullishEntering long positions on XAU/USD based on a confirmed 3-Drive pattern on the H4 timeframe, aligning with confluence from the 61.8% Fibonacci retracement zone.
As long as price stays and holds above 3200 I will remain bullish, if there is a close below 3200 then my analysis will be subject to change. Strong resistance will be at 3400 if it holds then the target is 3641 with a minor pullback at 3548.
THE KOG REPORT - UpdateEnd of day update from us here at KOG:
Not a bad start to the week with the path working well, we got the swoop we wanted and the opportunity for the long presented itself. We've completed quite a few of the bias targets as well as the red box targets, so now, with it being the last trading day of the month and quarter and tomorrow being the first, we'll take a back seat.
Support stands at the 3275 level with resistance still at 3404-6. Higher box is defence so we'll stick with it and see if it works how we intended.
KOG’s bias for the week:
Bullish above 3250 with targets above 3278✅, 3285✅, 3297 and above that 3306
Bearish below 3250 with targets below 3240, 3232, 3220 and below that 3212
RED BOX TARGETS:
Break above 3275 for 3279✅, 3285✅, 3289✅ and 3306 in extension of the move
Break below 3260 for 3255, 3251, 3240 and 3235 in extension of the move
As always, trade safe.
KOG

Mozafari Nejad ### Multi-Timeframe Analysis: 15min + 30min + 2# XAU/USD | Gold Market Outlook by Mohsen Mozafari Nejad
### Multi-Timeframe Analysis: 15min + 30min + 2h | July 2–3, 2025
---
## 🔍 Technical Overview:
| Timeframe | Structure | Efficiency | Context |
|-----------|-----------|------------|---------|
| 15min | Bullish ✅ | Efficient ✅ | Reverse H&S complete – price entering neckline zone |
| 30min | Bullish ✅ | Inefficient ❌ | Clean BOS – ready for potential continuation |
| 2H | Bullish ✅ | Inefficient ❌ | HL confirmed – clear bullish delivery range ahead |
---
## 🧠 Key Insights:
- **Left Shoulder - Head - Right Shoulder** clearly visible and now validated with neckline break
- Price is reacting from **last TLQ + ILQ zones** with MSU
- Strong **liquidity gap** above 3,380–3,405 likely to be targeted
- **Highs around 3,420–3,440** may act as liquidity magnet if clean break happens
- **BOS and CHoCH** confirmed across all LTFs — strong bullish intent
- Structure remains **bullish** as long as 3,312–3,320 HL holds
---
## 🎯 Price Zones to Watch:
| Zone | Action |
|--------------|----------------|
| 3,335–3,340 | OB Flip Support / Demand (Retest Possible) |
| 3,368–3,375 | Reaction Zone / Short-Term Take Profit |
| 3,404–3,420 | Major Liquidity Above / SH Grab |
| 3,428–3,440+ | Stop-Hunt Potential for Final Exit |
---
## 📌 Trade Scenarios:
### 🟢 Long Setup
- **Entry:** 3,340–3,348 (OB retest or continuation)
- **SL:** below 3,328
- **TP1:** 3,375
- **TP2:** 3,400
- **TP3:** 3,420+
### 🔴 Caution for Short
Only valid if price shows **CHoCH + strong rejection** from above 3,420–3,440.
Otherwise, trend continuation is dominant.
---
## 🧭 Summary:
> Gold continues its bullish structure in all LTFs.
> Reverse H&S has broken neckline cleanly.
> Momentum + inefficiency zones above = clear drive to liquidity.
> Patience is key – reentry on OB retest = high R/R setup.
---
🖋️ Prepared by: **Mohsen Mozafari Nejad**
*Smart Money | Liquidity Zones | Order Blocks | MSU/MSD Framework*
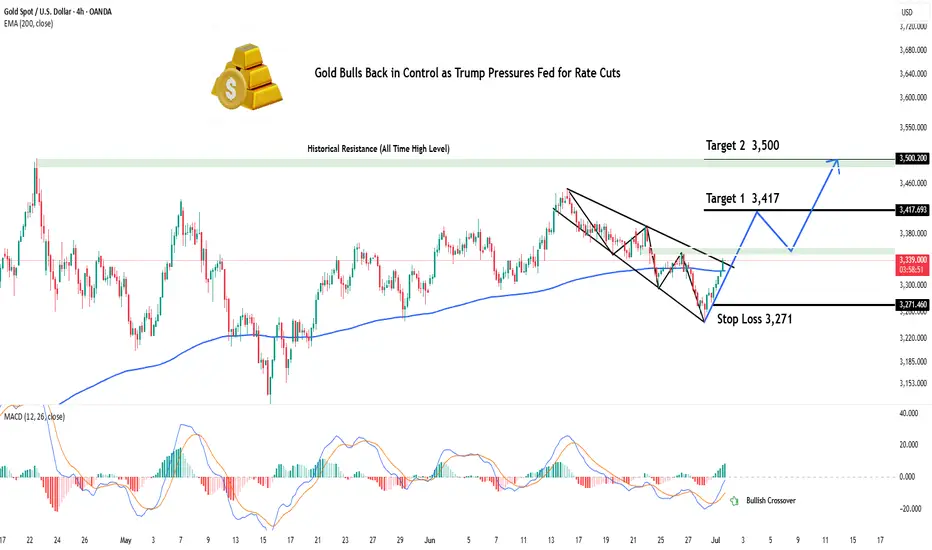
Gold Bulls Back in Control as Trump Pressures Fed for Rate CutsHey Realistic Traders!
President Trump is ramping up pressure on the Fed to cut interest rates , saying the U.S. is falling behind countries with looser policies. As several Fed officials begin to shift their stance, expectations for rate cuts are growing. That’s putting pressure on the dollar and giving gold a fresh boost.
We’ll take a closer look at what this means for OANDA:XAUUSD (Gold) through technical analysis and explore its upside potential.
Technical Analysis
On the 4-hour chart, Gold has moved above the EMA-200, signaling a shift in momentum to the upside. Price has also broken out of a Descending Broadening Wedge (DBW) pattern, which often indicates the start of a bullish trend.
The breakout was confirmed by a Bullish Marubozu candle, reflecting strong buying pressure. To add further confirmation, the MACD has formed a bullish crossover, reinforcing the upward momentum.
Looking ahead, the first target is seen at 3417. If reached, a minor pullback toward the historical resistance zone (green area) may occur, with a potential continuation toward the second target at 3500.
This bullish outlook remains valid as long as the price stays above the stop-loss level at 3271 . A break below this level would invalidate the setup and shift the outlook back to neutral.
Support the channel by engaging with the content, using the rocket button, and sharing your opinions in the comments below.
Disclaimer: "Please note that this analysis is solely for educational purposes and should not be considered a recommendation to take a long or short position on XAUUSD.
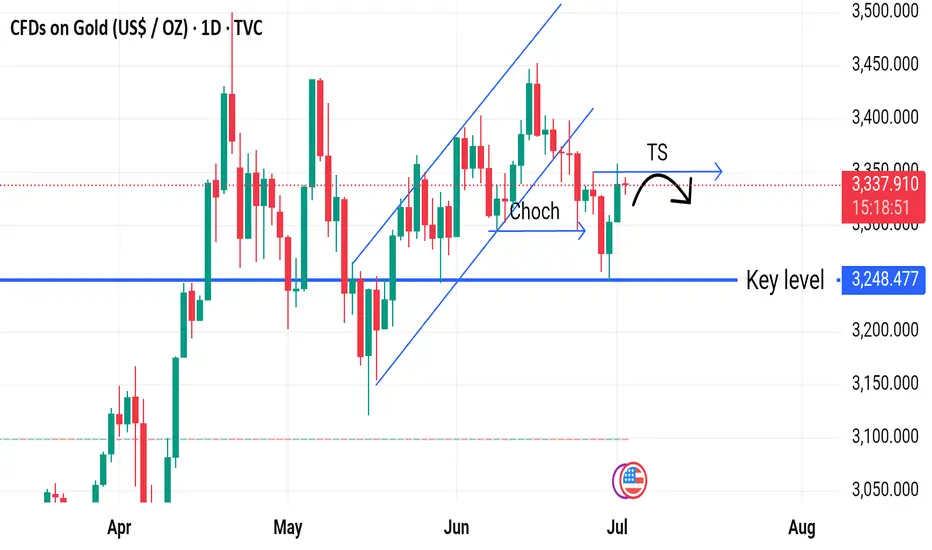
XAUUSD Daily Analysis – Bearish BiasGold tapped a key level at 3,339, sweeping liquidity above before showing signs of exhaustion. A Change of Character (Choch) confirms potential reversal. If price respects this Bearish POI, we could see a drop back to 3,248 support. Watch for a TS (tap and shift) before continuation.
I will update you with trade setup so stay update
#Gold #xauusd #Forex #Dailyanalysis #bias #Goldbias
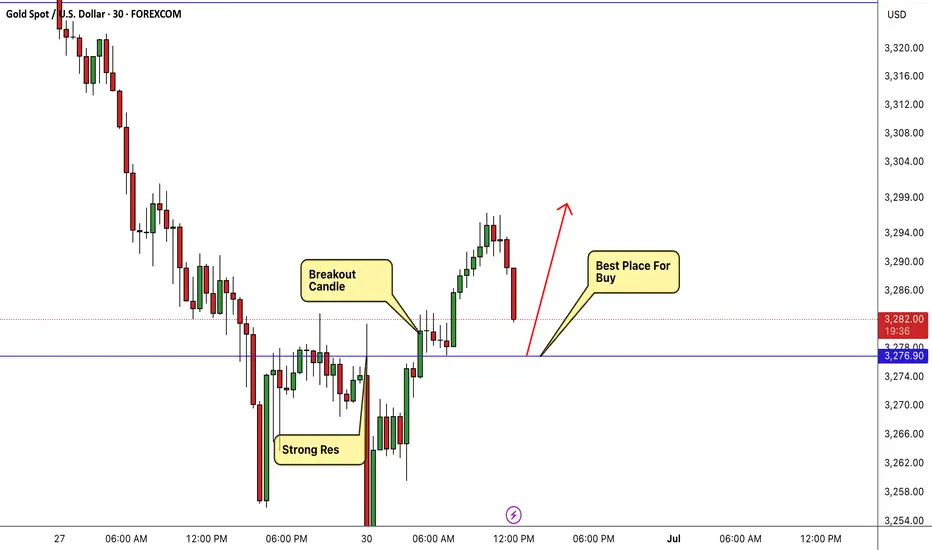
GOLD Breakout Done Let`s Buy It To Get Clear 200 Pips !Here is my opinion on 30 mins T.F , We have a very good bullish price action and we have a very good breakout with amazing bullish candle and now the price back to retest the breakout area , it`s my fav place to enter a buy trade and the price can move 200 Pips easy , i`m waiting for retest and good bullish price action to enter a buy trade .
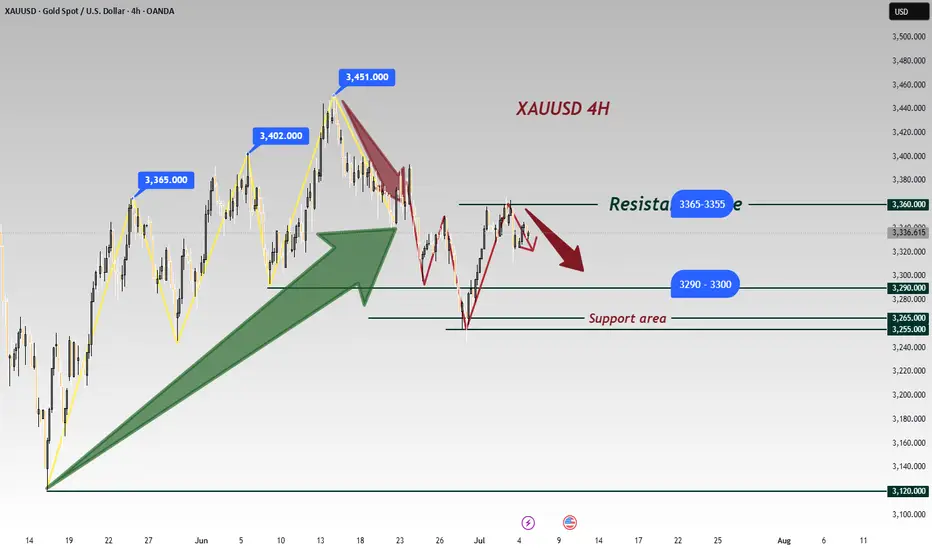
Gold's Next Week Trend & Trading TipsGold Trend Analysis for Next Week
Fundamental Analysis
Friday (July 4th) marks the U.S. Independence Day holiday, with gold oscillating narrowly near 3333 in early European trading 📊. The metal fell nearly 1% on Thursday (July 3rd) to close at 3325.87, weighed by unexpectedly strong June nonfarm payrolls 💪. This boosted the dollar and Treasury yields, dimming Fed rate-cut hopes and curbing gold’s appeal.
Additionally, the U.S. Congress passed the Trump administration’s major tax cuts and spending bill, adding economic complexity 🔄. No key data is due today; markets will close early for the holiday, limiting volatility. Profit-taking on yesterday’s short positions may halt declines, leaving today’s trend likely range-bound or slightly rebounding 📈.
Technical Analysis
Gold rebounded from lows this week, with three straight bullish daily candles breaking above the middle Bollinger Band, signaling short-term strength 🐂. However, dual bearish triggers (nonfarm data and jobless claims) sparked a pullback Thursday, likely forming a bearish candle with a long lower shadow—a correction after three gains 🔄.
The daily chart shows high-range consolidation, lacking sustained momentum. Dollar volatility has capped gold’s moves, with repeated tests of highs failing to break through and pullbacks lacking downside conviction. The daily Bollinger Band is contracting, with gold swinging between middle and lower bands; 3360 acts as resistance 🛑.
Last night’s nonfarm data caused a nearly $40 drop, but markets stabilized, and gold has recovered half those losses, with bearish momentum ebbing 🐻. A secondary support base formed at 3322, and after overnight consolidation, gold is showing rally signs with higher lows 🔄
Strategy:
🚀 Sell@3355 - 3345
🚀 TP 3335 - 3325 - 3315
🚀 Buy@3290 - 3300
🚀 TP 3310 - 3320 - 3330
Accurate signals are updated every day 📈 If you encounter any problems during trading, these signals can serve as your reliable guide 🧭 Feel free to refer to them! I sincerely hope they'll be of great help to you 🌟 👇
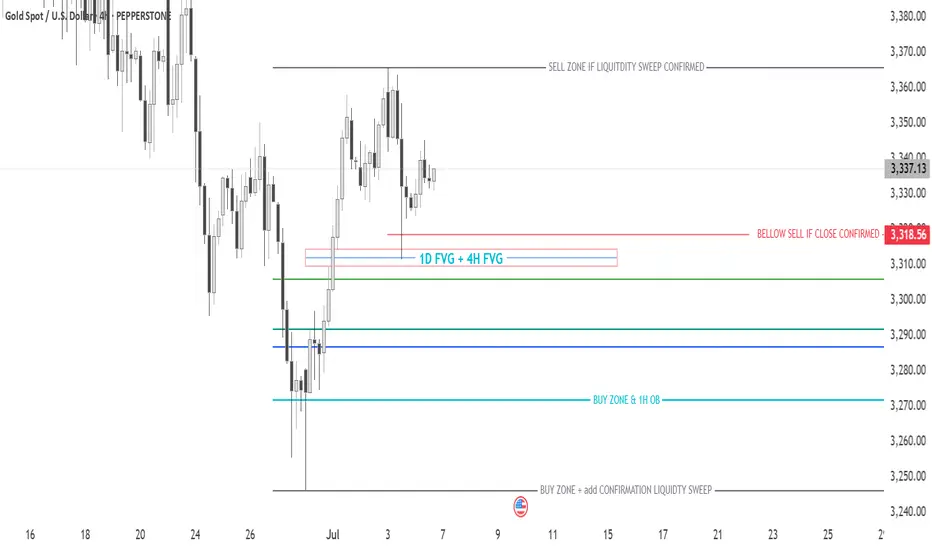
GOLD LIQUIDITY MASTERCLASS: The Smart Money Playbook Revealed🧠 INSTITUTIONAL MINDSET
At $3,365: "Perfect! Time to sell into retail buying"
At $3,337: "Let's see how this plays out"
At $3,318: "Preparing for the hunt"
At $3,270: "Starting to accumulate"
At $3,245: "Loading the truck! This is what we've been waiting for"
🔍 LIQUIDITY ZONES DECODED: The Hidden Treasure Map
🎯 BELLOW SELL IF CLOSE CONFIRMED: $3,318
Significance: Close below = bears take control
Time Frame: 4H close confirmation needed
________________
🛡️ BUY ZONE & 1H OB: $3,270
The Fortress: Major institutional buy zone
Order Block Significance: 1H order block provides additional support
Risk/Reward Sweet Spot: Excellent entry for swing positions
_______________
⚡ BUY ZONE + ADD CONFIRMATION LIQUIDITY SWEEP: $3,245
The Ultimate Accumulation Zone: Where smart money loads up
_________ 🎯 STRATEGY _________
Entry: $3,238-$3,2440 (after liquidity sweep confirmation)
Stop Loss: $3,230 (below the sweep low)
Target 1: $3,290 (Risk:Reward 1:3)
Target 2: $3,320 (Risk:Reward 1:5)
Target 3: $3,365 (Risk:Reward 1:8)
🚨 RISK WARNING 🛡️ DYOR 🚨 DISCLAIMER - JUST FOR EDUCATION PROPOSAL ⚠️
Analysis of gold price rise and fall on MondayAnalysis of gold price rise and fall on Monday
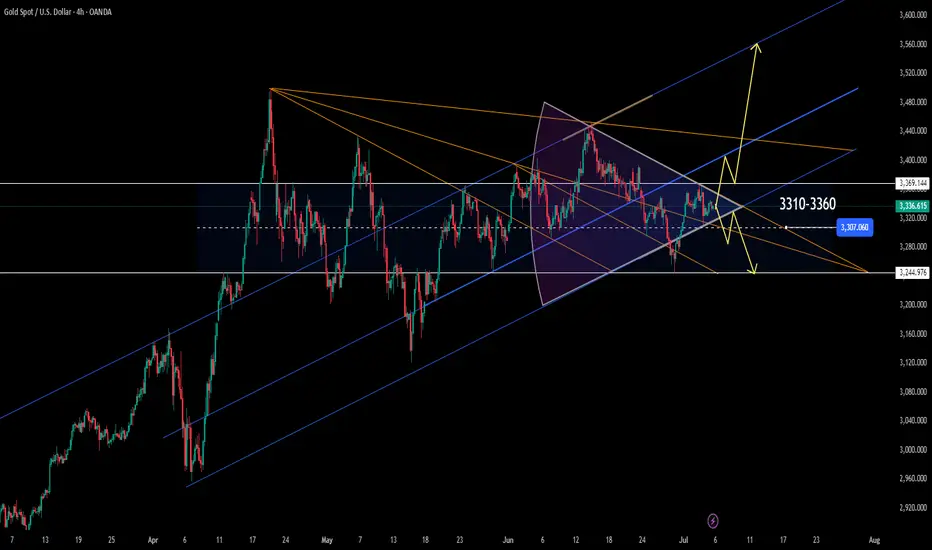
The probability distribution of gold price trend next Monday is as follows:
Probability of rise: 55%-60%.
Support factors include: the expectation of Fed rate cuts has been strengthened, the dollar is weak, the tariff deadline is approaching, triggering safe-haven demand, and the momentum of short-term rebound in the technical aspect.
Probability of decline: 35%-40%.
Risk factors include: strong resistance at 3360 points on the technical side, temporary relief of geopolitical risks, and profit-taking pressure.
Probability of sideways fluctuation: 5%-10%.
If there is a lack of catalysts, the gold price may fluctuate in the range of 3310-3360, waiting for new clues.
Operation strategy reference:
Long position strategy: If the gold price falls back to the 3310-3315 area and stabilizes, you can go long with a light position, set the stop loss below 3300, and the target is 3325-3330 (it can go up to 3335-3340 after breaking through).
Short-selling strategy: If the gold price rises to the 3350-3360 range, you can short with a light position, set the stop loss above 3360, and target 3325-3330 (after breaking through, look down to 3310--3300-3280).
Fundamentals
Weight analysis of key influencing factors:
Subsequent impact of US non-farm payrolls data: If the detailed interpretation of non-farm data next Monday continues to ferment, it may provide support for gold.
Expected changes in the tariff decision on July 9: Next Monday will be the last trading day before the suspension of US trade tariffs (July 9), and market concerns about the Trump administration's possible increase in tariffs may heat up.
Any relevant news or official statements may trigger safe-haven funds to flow into gold.
Key technical game:
The battle between the $3310 support level and the $3360 resistance level will continue to dominate the short-term trend.
If the opening price remains above the 3330-3340 range next Monday, it may test the 3360 resistance; if it falls below 3310, it may fall to the 3280 support.
Trends of the US dollar index and US Treasury yields: The US dollar index has recently fallen to a two-year low (96.875), and US Treasury yields have also fallen (10-year yields are 4.228%). If this trend continues, it will be good for gold.
Geopolitical risk dynamics: Although the situation in the Middle East has not escalated further, it is still in a tense state, and sudden news may disrupt the market at any time.