Inside My Gold Mind: Weekend Trade Log📌 Market Context / Bias
The majority of bullish price action on VELOCITY:GOLD occurred early in the week — specifically between Monday and Tuesday. From midweek through Friday, the market entered a period of consolidation, showing signs of compression.
Interestingly, despite positive economic data that favoured the USD, GOLD remained steady and resilient. This suggests underlying bullish pressure and potential accumulation.
My current bias is bullish going into the new week — with expectations of a price expansion to the upside.
🔍 Higher Timeframe Analysis
Weekly Candle: Shows early bullish expansion followed by consolidation — classic sign of absorption or reaccumulation.
Draw on Liquidity: Equal highs remain above, acting as a magnet for price.
FVGs: Price traded into a daily FVG earlier in the week and closed above it.
Order Block: Price respected a previous Bullish Order Block during Thursday’s retracement, reinforcing possible support.
🧩 Lower Timeframe Confluence
1H–4H: Price is forming relatively equal highs above the current range — potential liquidity targets.
Intraday Structure: No major shift to bearish order flow was confirmed; compression suggests a possible continuation move once expansion begins.
🧠 Fundamental Insight
Despite hawkish or strong USD fundamentals, GOLD held its ground. This divergence often precedes a strong move — likely driven by risk sentiment, upcoming Fed commentary, or global macro drivers.
🧠 Trade Plan Preview
Stay tuned for my daily updates where I’ll share:
My bias for the day
Market structure breakdown
Intraday trade plan (entry, targets, and session model)
⚠️ Reminder:
Trade with due diligence. This is not financial advice. Always align entries with your personal model and preferred session.
Thanks for your support!
If you found this idea helpful or insightful, please drop a like 👍 and leave a comment — I’d love to hear your thoughts! 🚀
Follow me for more daily price action insights and trading strategies on XAUUSD and other key markets.
Let’s grow and trade smarter together! 📈
⚠️ Disclaimer
This content is for educational and informational purposes only and does not constitute financial or investment advice.
All trading involves risk. You are solely responsible for your own decisions, so always conduct proper research and due diligence before taking any trades.
Past performance is not indicative of future results. Trade responsibly.
May your final trades of the week be precise and profitable.
XAUUSDG trade ideas
GOLD XAUUSD potential 1-2 setup to downsideLooking at an potential 1-2 setup to the downside wave 3 of 5. adding to my previous gameplay
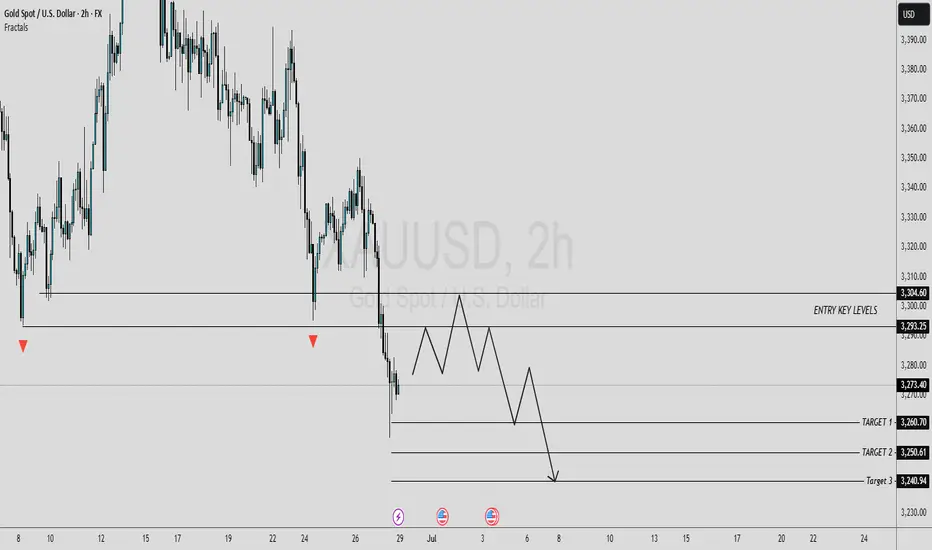
#XAU/USD SELL TRADE SETUP [SHORT]In this analysis we're focusing on 2H timeframe. As we know, Gold is moving in a strong bearish trend. The best selling zone is 3295 - 3305 key levels area. If gold encounters rejection from this zone, we can anticipate a potential decline in price towards its targeted levels.
Target 1:3260
Target 2:3250
Target 3:3240
Wait for a retracement to sell with strong confirmation and proper risk management.
#GOLD 2H Technical Analysis Expected Move.
GOLD - Price can grow to resistance line of wedge patternHi guys, this is my overview for XAUUSD, feel free to check it and write your feedback in comments👊
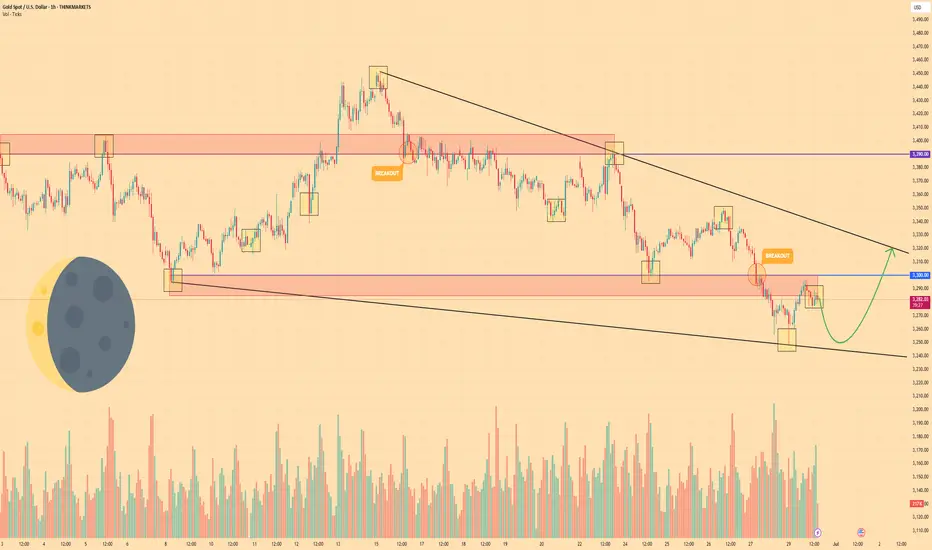
Some time ago price bounced from $3390 level and declined, but soon turned back and even entered to resistance area.
After this, the price dropped from this area and then started to grow inside the wedge, where it at once made an impulse up.
Price reached $3390 level one more time and broke it, after which it continued to grow to the resistance line of the wedge.
When it reached this line, price turned around and in a short time declined below $3390 level, breaking and then made a retest.
Later, Gold broke $3300 level and fell to the support line of the wedge, after which it rose to the resistance area.
Now I expect that Gold can make a correction to almost support line and then bounce up to $3320 resistance line of the wedge.
If this post is useful to you, you can support me with like/boost and advice in comments❤️
Disclaimer: As part of ThinkMarkets’ Influencer Program, I am sponsored to share and publish their charts in my analysis.
Gold Gains Strength as the Dollar Wobbles – What’s Next?Hello, my dear friends – let’s take a fresh look at gold after yesterday’s moves!
At the moment, gold is trading steadily around 3,345 USD as the market awaits tonight’s highly anticipated U.S. Nonfarm Payrolls report. Yesterday’s ADP data caused a mild shake in sentiment, showing the first drop in private sector employment in over two years. This immediately fueled expectations that the Federal Reserve could move to cut interest rates sooner than expected — putting pressure on the U.S. dollar and offering support to gold as a non-yielding safe haven.
Meanwhile, the DXY (U.S. Dollar Index) has slipped to its lowest level in nearly three years, making dollar-denominated assets like gold more attractive to international investors. On top of that, lingering geopolitical tensions and ongoing strong central bank buying continue to reinforce gold’s role as a long-term store of value.
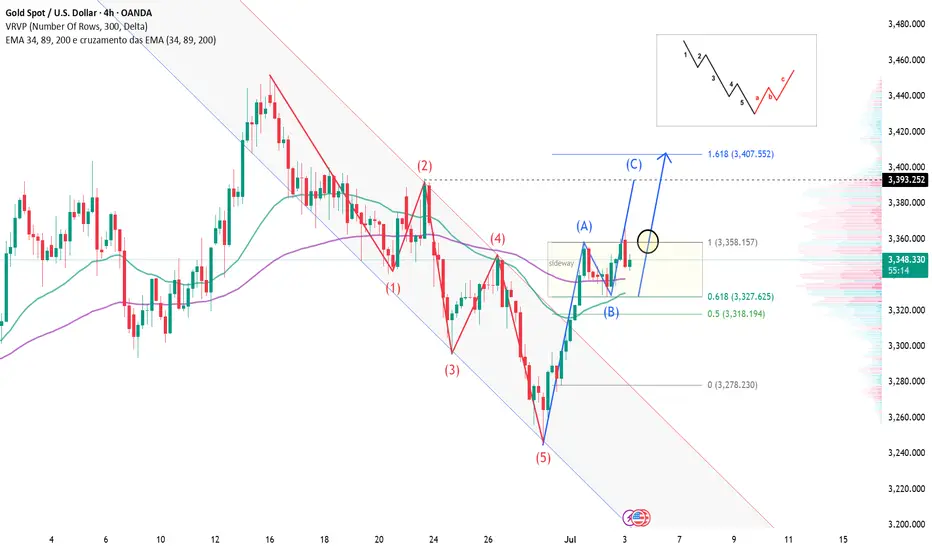
From a technical perspective on the H4 timeframe, gold is showing a very tight structure after breaking out of a prolonged downtrend channel. Price is currently consolidating between 3,330 and 3,360 USD, with a clearly defined bullish formation: higher highs and higher lows — a strong signal that the uptrend is starting to take shape again.
The key level to watch now is 3,358 USD. If price breaks above this level with convincing buying momentum, I expect gold to enter a new bullish leg toward 3,390 – 3,407 USD, aligning with the Fibonacci 1.618 extension — often a magnet for price during strong trends. On the other hand, if there’s a short-term pullback, the support zone around 3,327 – 3,318 USD will be critical, offering a potential re-entry point for buyers looking to ride the next wave up.
This is not a phase for impulsive decisions — but it’s definitely not a moment to be passive either. The breakout could come fast, and only prepared traders will be ready to act.
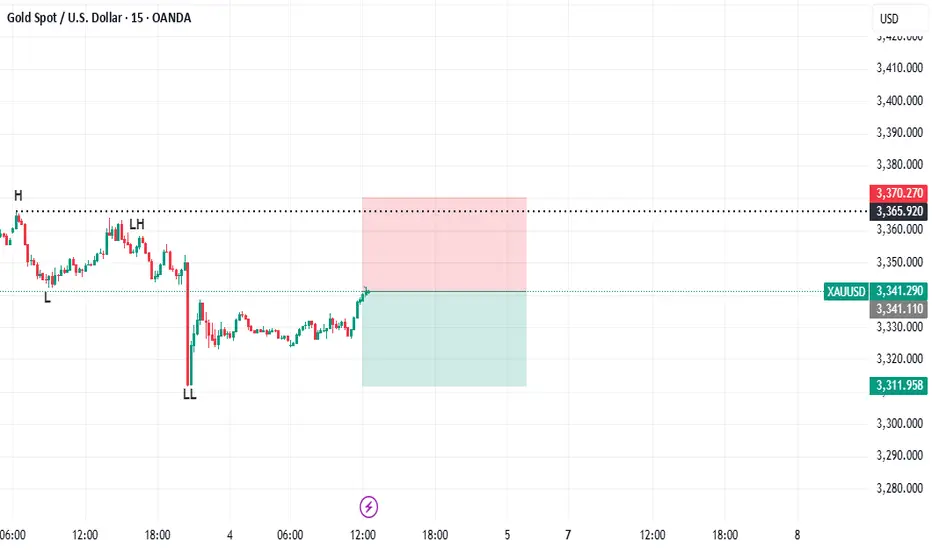
Simple analysisSimple analysis using trend patterns. I saw a downtrend pattern which is H-L-LH-LL. So, I decided to sell. RRR 1:1
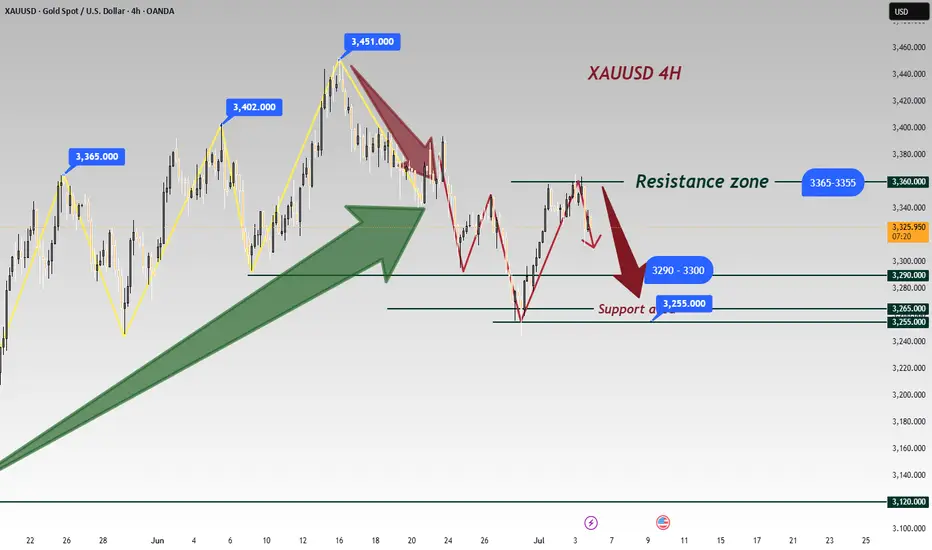
XAUUSD - Trading Plan 4-Hour Analysis and ProjectionThis 4-hour candlestick chart of Gold against the US Dollar highlights key Wyckoff market phases and technical levels that frame the current market structure. The analysis identifies significant points including the Buying Climax (BC), Upthrust (UT), Second Test (ST), and Automatic Reaction (AR), which mark essential phases of accumulation and distribution.
Multiple Dow swing counts (Dow-1, Dow-2, Dow-3) are annotated with various colors, illustrating the market’s internal structure and momentum shifts. The chart shows a failed upthrust after distribution, signaling a likely bearish pressure following the attempt to push prices higher.
The current price action indicates a potential retracement to the support zone near the Automatic Reaction level, followed by possible continuation up to recent highs. The plan suggests watching for a minor pullback around area A, after which a bullish move is expected to resume, targeting higher resistance levels as indicated by the projected price movement arrows.
This trading plan emphasizes careful observation of price reactions around key support and resistance levels derived from Wyckoff methodology phases, aiming to capture potential bullish continuation or prepare for bearish scenarios if support fails.
==============
Dow Theory & Wyckoff

GOLD (XAUUSD): Potential Scenarios Explained
Here is my updated technical outlook for Gold with potential scenarios.
Bullish Scenario
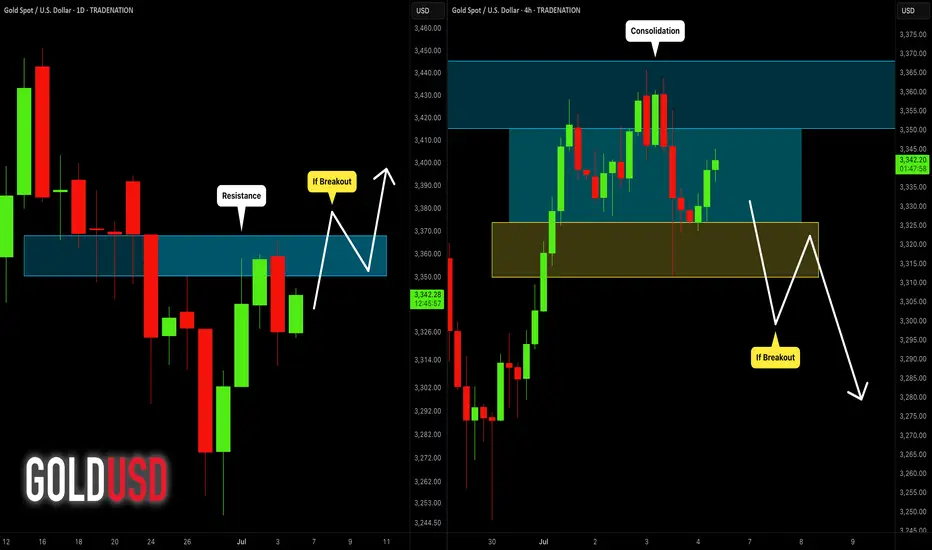
The price is currently testing a significant daily resistance cluster.
Its bullish breakout and a daily candle close above 3368 will
provide a strong confirmation.
More growth will be expected then.
Bearish Scenario
For now, the market is consolidating on the underlined resistance.
The price is stuck within a horizontal range on a 4H time frame now.
Your bearish signal will be a breakout of its support and a 4H candle
close below 3310.
It will provide a strong bearish confirmation.
The market might be weak and remain within a 4H range today.
But, everything can happen, so watch carefully.
❤️Please, support my work with like, thank you!❤️
I am part of Trade Nation's Influencer program and receive a monthly fee for using their TradingView charts in my analysis.
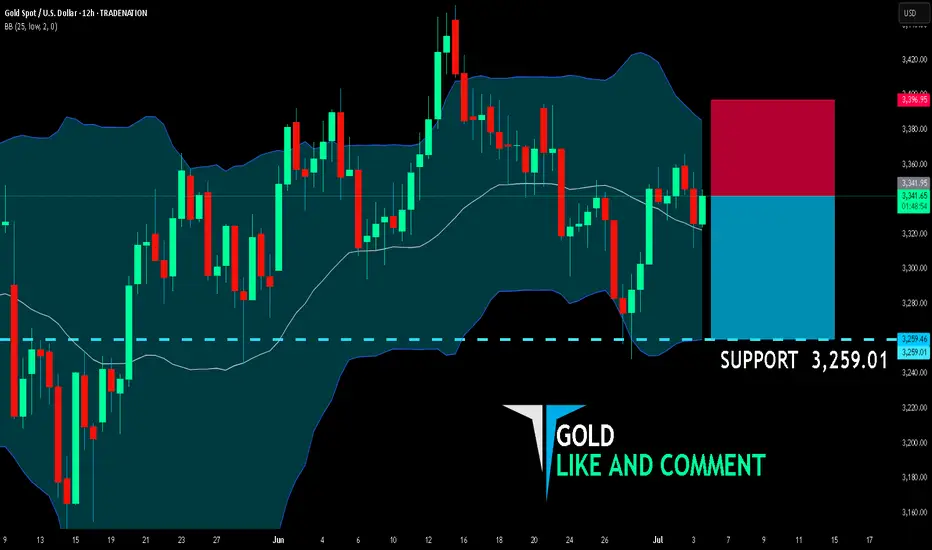
GOLD BEARS ARE STRONG HERE|SHORT
GOLD SIGNAL
Trade Direction: short
Entry Level: 3,341.95
Target Level: 3,259.01
Stop Loss: 3,396.95
RISK PROFILE
Risk level: medium
Suggested risk: 1%
Timeframe: 12h
Disclosure: I am part of Trade Nation's Influencer program and receive a monthly fee for using their TradingView charts in my analysis.
✅LIKE AND COMMENT MY IDEAS✅
Gold Retests Ascending TrendlineGold has pulled back to a key technical level, despite a mix of conditions that would usually support higher prices. This signals a potential shift in how investors are positioning for risk, inflation, and growth.
Gold Ignores the Playbook
You’d be forgiven for expecting gold to be higher. The past week saw softer US dollar action, rising bets on interest rate cuts, and inflation numbers that nudged uncomfortably higher. On paper, these are the sort of developments that traditionally give gold a boost. But the metal barely blinked.
The May core PCE figure, the Fed’s preferred inflation gauge, rose more than expected to 2.7%. Yet bond markets took it in their stride, with rate futures continuing to price in a strong chance of easing by September. At the same time, the US dollar lost ground, with the dollar index down over 1% on the week. That sort of move would usually feed straight through into dollar-denominated commodities like gold. This time, it didn’t.
Part of the answer lies in geopolitics. The ceasefire between Israel and Iran has cooled tensions that previously underpinned gold’s safe-haven appeal. Meanwhile, equity markets keep printing new highs, led by tech and growth stocks. Investors are shifting from protection to participation, favouring assets that benefit from improving trade flows and global demand. The latest US-China trade deal, focused on rare earth exports, only adds to that narrative. For now, risk-on is winning.
All Eyes on the Trendline
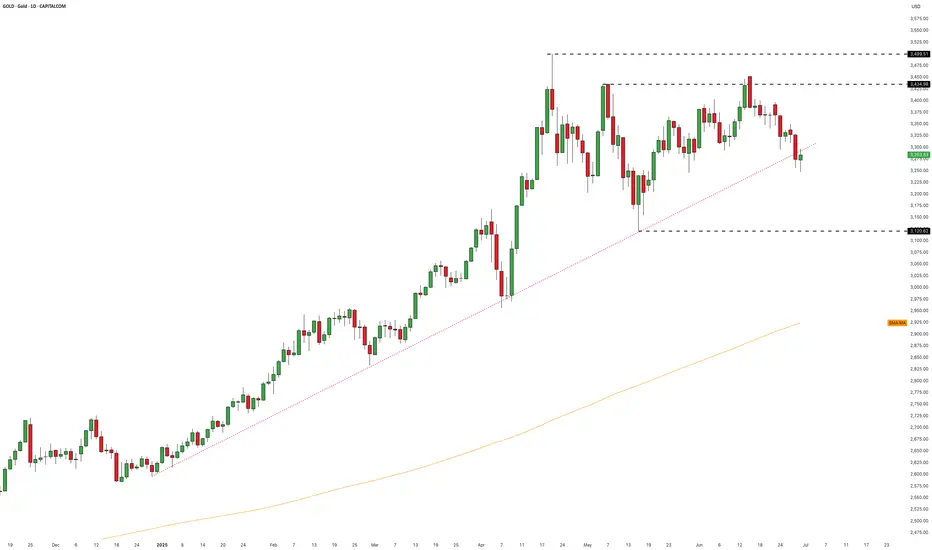
While the macro backdrop has turned more complex, the technical picture for gold remains clearly defined. After a strong rally into April, the market has entered a period of consolidation. A lower swing high formed in May, which was retested and rejected in June. That rejection triggered the most recent two-week slide, bringing the precious metal back to its rising trendline.
This trendline, in place since December 2024, has guided the broader uptrend and held firm on three previous tests. Once again, it finds itself under pressure. Whether it holds this time is an open question. Trendlines are only as good as the demand that supports them, and in a consolidation phase, that support can often be patchy.
The nature of consolidation is a kind of controlled drift, plenty of movement, but not much commitment. If the trendline does give way, that doesn’t necessarily spell the end of gold’s bull cycle. But it would likely open the door to a deeper correction, with the May swing lows in play. That area also aligns with the volume-weighted average price anchored to the December 2024 lows which is a key reference point for longer-term participants.
For now, gold is in wait-and-see mode. It is still above support, but no longer behaving like a market in control. If the broader risk-on mood continues, we may see further rotation away from safe havens. But if the growth narrative starts to wobble, don’t be surprised if gold finds its voice again.
Gold Daily Candle Chart
Past performance is not a reliable indicator of future results
Disclaimer: This is for information and learning purposes only. The information provided does not constitute investment advice nor take into account the individual financial circumstances or objectives of any investor. Any information that may be provided relating to past performance is not a reliable indicator of future results or performance. Social media channels are not relevant for UK residents.
Spread bets and CFDs are complex instruments and come with a high risk of losing money rapidly due to leverage. 85.24% of retail investor accounts lose money when trading spread bets and CFDs with this provider. You should consider whether you understand how spread bets and CFDs work and whether you can afford to take the high risk of losing your money.
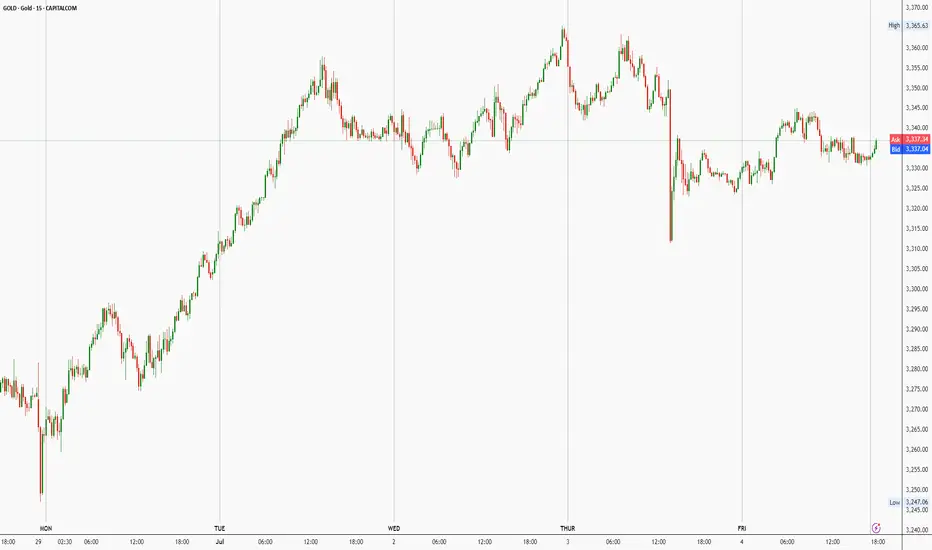
Daily live trade with XAUUSD in 15m/30m/1h 20250703Daily live trade with XAUUSD in 15m/30m/1h 20250703
Gold Holds Above 3342 Ahead of Key U.S Data –Bullish Bias IntactGold Rises as Market Awaits Key U.S. Economic Data
Gold prices are pushing higher as investors position ahead of today’s major U.S. economic releases, including NFP and unemployment figures. Expectations of weaker data are supporting bullish sentiment.
Technical Outlook (XAU/USD):
Gold maintains a bullish structure as long as it trades above 3,342.
→ A push toward 3,365 is likely
→ A 1H close above 3,365 would open the path toward 3,375
However, if price closes below 3,342 on the 1H chart, bearish momentum may build, targeting 3,331 and 3,320
Key Levels:
• Resistance: 3,365 / 3,375 / 3,390
• Support: 3,341 / 3,331 / 3,320
June Nonfarm Data: Gold PlungesThe US June nonfarm payrolls data is out: 147,000 jobs were added, exceeding the expected 106,000 and the previous 139,000, with slight upward revisions to the prior two months’ figures. The unemployment rate dipped from 4.2% to 4.1%, beating the forecast of 4.3%. While the US economy slows, the job market remains robust. 🌟
Post-data release, market bets on a July rate cut have evaporated, with the probability of a September cut dropping to around 75%. US stock futures extended gains, Treasury yields rose across the board, the US Dollar Index surged, and gold plunged nearly $40 in a short squeeze—signaling an unexpected major bearish hit to gold. Weng Fuhao advises trading with the trend, focusing on shorting on rebounds. 😲
Gold, jolted by the nonfarm data, slid sharply in the short term before a minor rebound, with bearish signals across all timeframes. The data triggered an immediate breakdown, shifting the short-term trend to downward: on the 3-hour chart, moving averages formed a death cross, MACD showed a death cross with expanding volume, and gold prices fell below the Bollinger Band lower track, confirming a clear bearish momentum. 📉
🚀 Sell@3355 - 3345
🚀 TP 3335 - 3325 - 3315
Accurate signals are updated every day 📈 If you encounter any problems during trading, these signals can serve as your reliable guide 🧭 Feel free to refer to them! I sincerely hope they'll be of great help to you 🌟 👇
Check the trend Given the price behavior within the current resistance range, possible scenarios have been identified. It is expected that after some fluctuation within the current resistance range, a trend change will take place and we will witness the beginning of a downtrend. With consolidation above the resistance range, an uptrend will be likely.
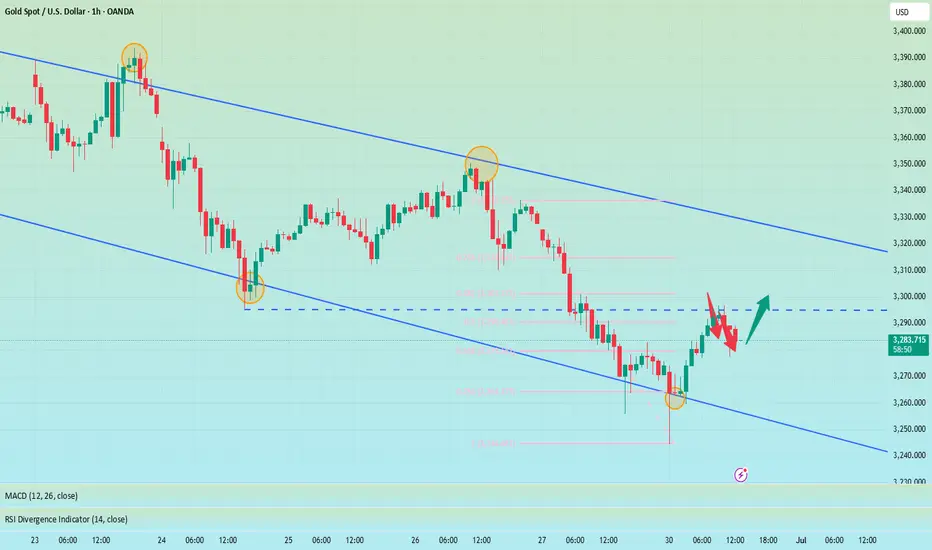
Go long on dips and short on rallies📰 News information:
1. Gold market liquidity at the end of the month
2. Impact of geopolitical situation
📈 Technical Analysis:
Last week we predicted that gold would rebound. Today, after gold rebounded as expected, we gave a short trading strategy. Gold fell precisely at the point we gave, 3295, and successfully hit our TP3280-3270. The result confirmed the correctness of our trading strategy. Next, we will focus on the long trading opportunities below 3270-3260.
🎯 Trading Points:
BUY 3270-3260
TP 3290-3300
SELL 3295-3300-3310
TP 3280-3270
In addition to investment, life also includes poetry, distant places, and Allen. Facing the market is actually facing yourself, correcting your shortcomings, confronting your mistakes, and strictly disciplining yourself. I hope my analysis can help you🌐.
TVC:GOLD FXOPEN:XAUUSD PEPPERSTONE:XAUUSD FX:XAUUSD FOREXCOM:XAUUSD OANDA:XAUUSD
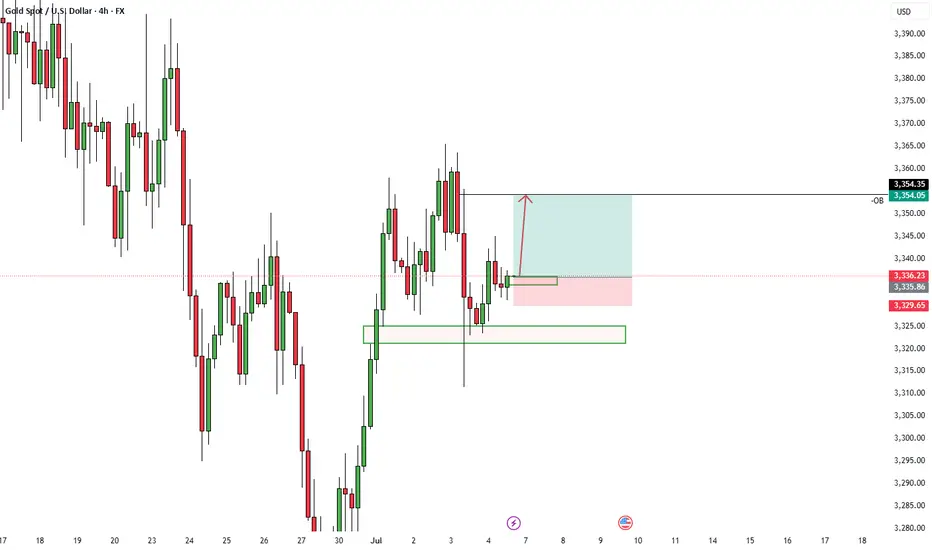
XAUUSD 4HR Trade Idea - ICTBeautiful 2.93 RR Trade Idea on Gold, I am bearish on DXY heading for the -OB on the 4hr.
Gold Trading Strategy July 3✏️D1 candle continues to increase towards the price gap zone. At the beginning of the European session, sellers accept to enter the market at this resistance price zone around 3365. The accumulation pattern of gold price is forming a triangle pattern.
The lower boundary is broken, it will lead to the breakout point of the lower boundary and vice versa, if the upper boundary of the triangle is broken, the price will move towards the next resistance.
📉 Key Levels
Resistance: 3388-3363
Support: 3330-3311-3297-3277
Buy trigger: breakout above 3363
Sell trigger: breakout below 3330
If this idea resonates with you or you have other ideas, please comment. I look forward to reading your thoughts!
Best regards, VHT Traders!
Maintain range fluctuations during the day?Gold has maintained a volatile pattern recently. As the US market is closed today for Independence Day, the market volatility is expected to be limited, but the volatile market will continue, but the volatility range may change. Yesterday's gold price fell mainly due to the news, and this decline usually does not last too long. From a technical point of view, gold prices are supported near 3310-3300, which is the key support level today. It is worth noting that on Wednesday, gold prices were under pressure in the 3340-3350 area, and on Thursday, prices formed support in this range, indicating that the area is forming a top-bottom conversion. Therefore, 3340-3350 has become an important pressure level today. It is expected to fluctuate in the 3300-3340/3350 range during the day. The impact of news on gold prices is usually short-term. When the fundamentals and technical directions are consistent, price fluctuations will be more obvious. When the two are inconsistent, price fluctuations will weaken, but will not change the technical trend. The rebound pattern established at the beginning of the week is still valid. After a short-term shock, gold prices are expected to re-stand above 3345 and continue to maintain the rebound trend.
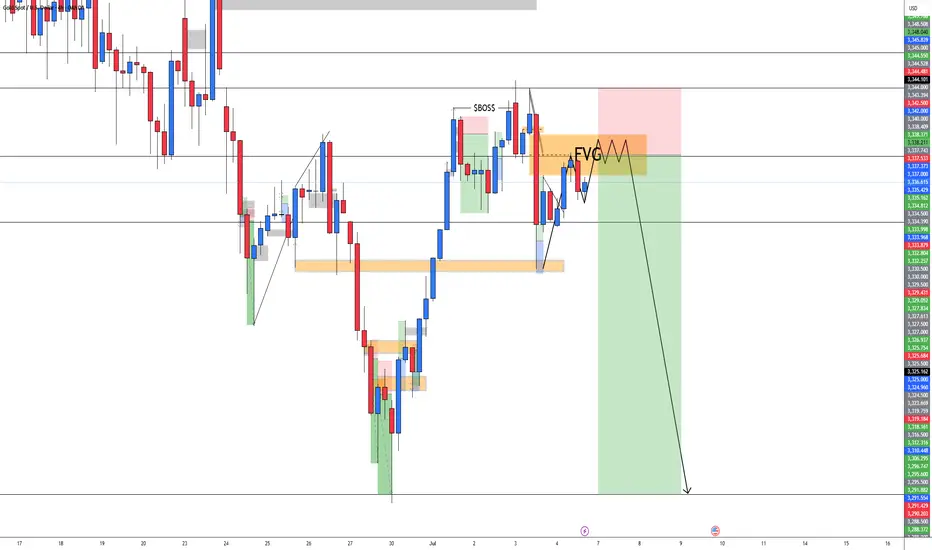
XAUUSD BEARISHAccording to the SMC and FVG concept, I am seeing bearish momentum in Gold. We have to wait for the proper rejection from FVG to sell the GOLD.
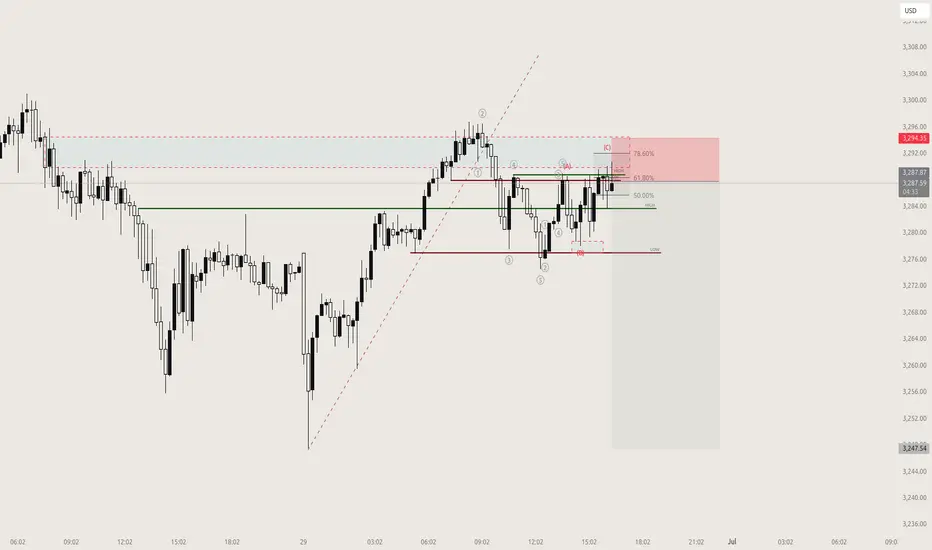
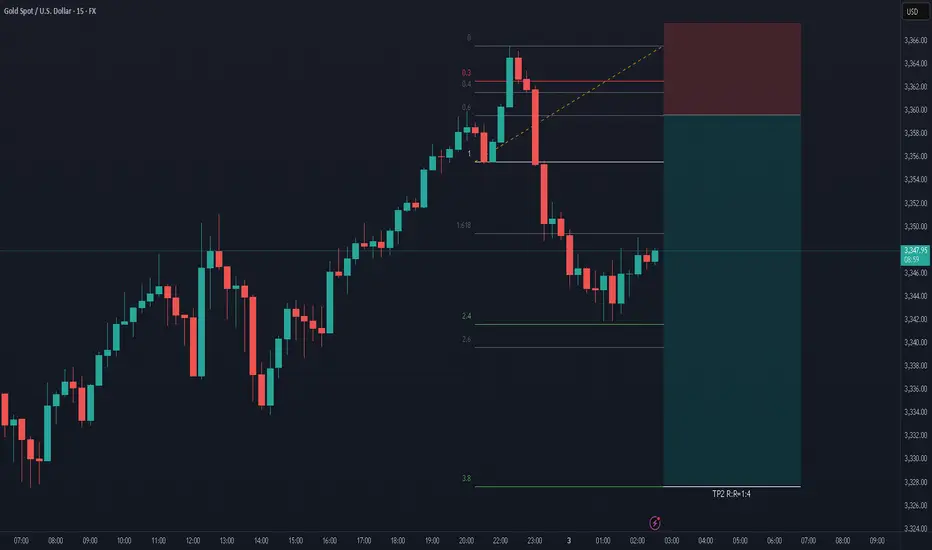
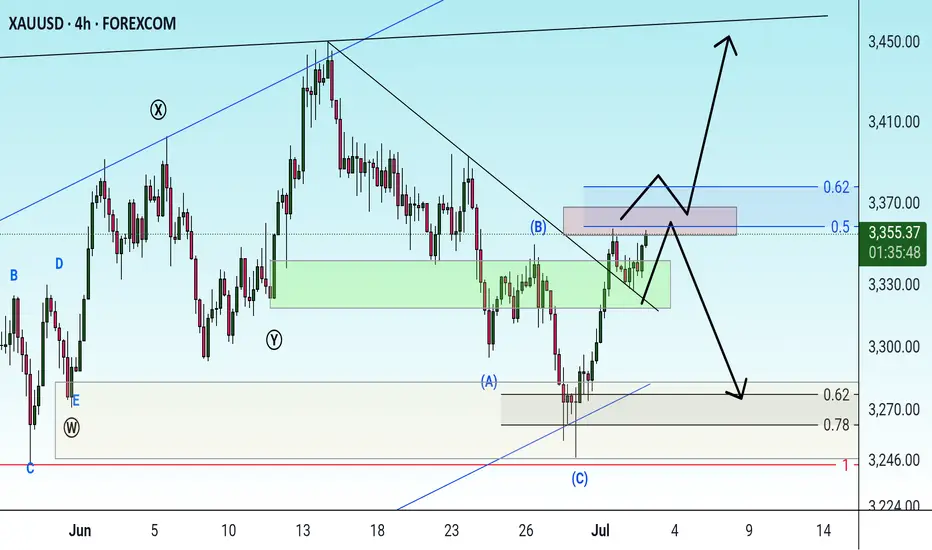
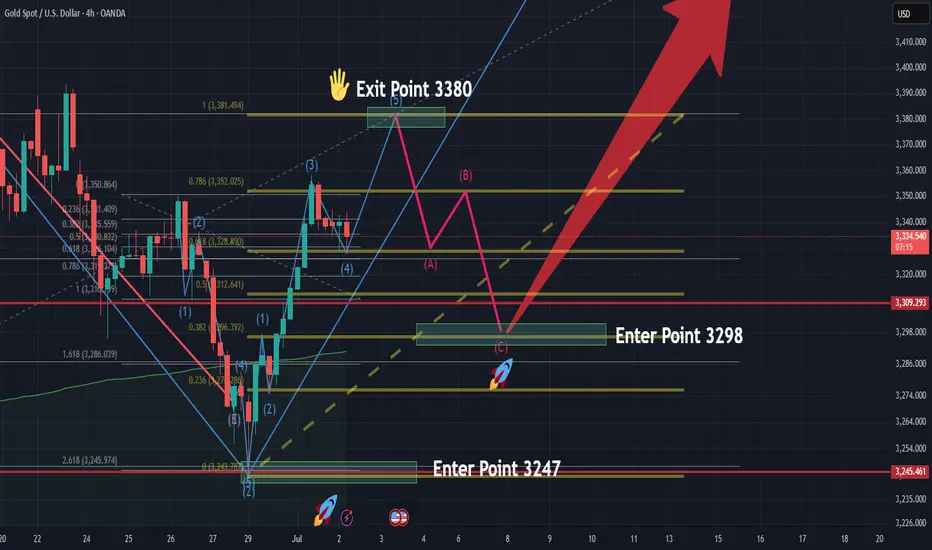
Riding Wave (5) Toward 3380 Before ABC Correction📌 Market Context
The current chart shows wave (5) of a larger impulsive structure is still in progress, with price rising from the bottom of wave (4). After a clean wave (1)-(2)-(3)-(4), the market is now pushing upward, targeting the 3380 zone as a likely wave (5) completion.
🟢 Entry Levels (End of Wave 2)
First Entry: 3298
Second Entry: 3279.6
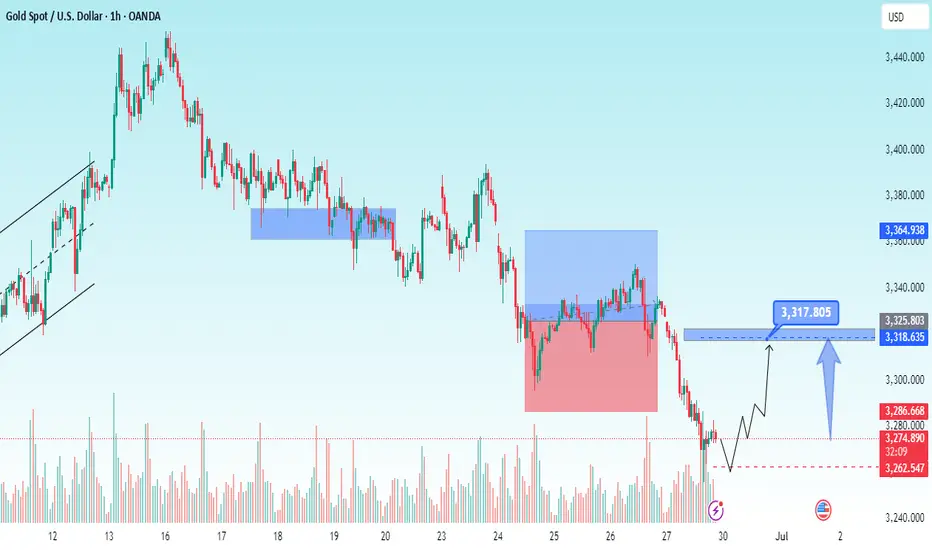
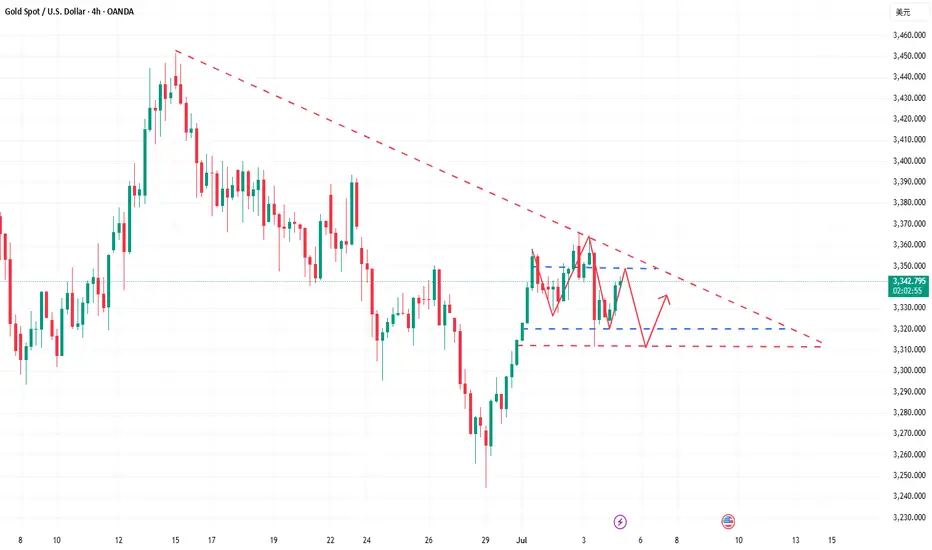
Gold’s Bullish Range Holds – Is This the Dip to Buy?With tensions easing in the Middle East and risk appetite moderating, gold has settled into a bullish daily range. The metal recently broke a key high, confirming its upward momentum, but now appears to be consolidating. The central question is whether gold will break lower for a deeper correction or whether this is merely a pause before the next leg higher.
Reduced geopolitical risk has tempered the “risk-on” rally in gold, but the metal remains firmly within a bullish daily range. This indicates that the underlying bid has not disappeared—only short-term speculative flows have adjusted.
Gold recently breached a protected high—likely a higher high or significant resistance level—reinforcing the prevailing bullish momentum. A pullback into imbalance or demand zones is anticipated; however, if a catalyst emerges, price could resume its advance from current levels, with the 0.328 Fibonacci retracement acting as a strong support.
Meanwhile, the DXY is exhibiting signs of a pullback but lacks the fundamental drivers necessary to sustain a broader rally.

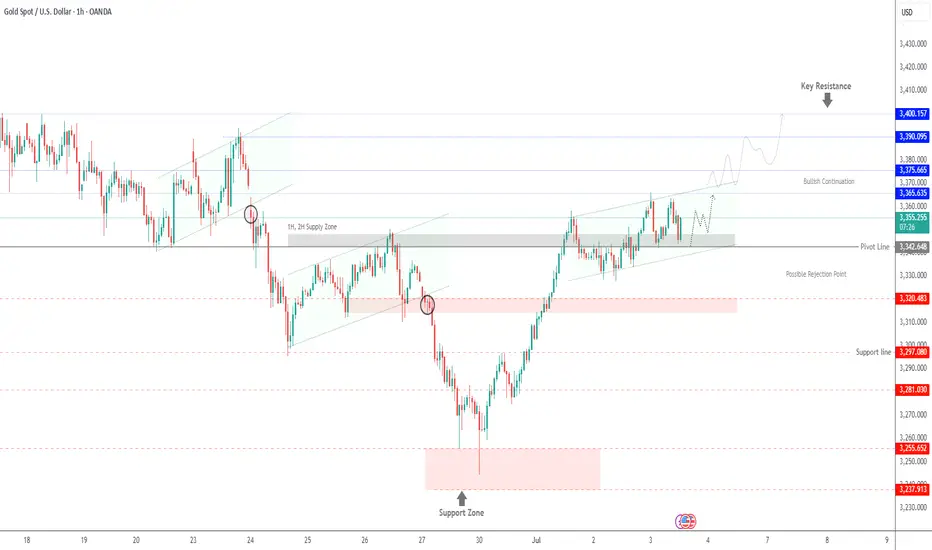
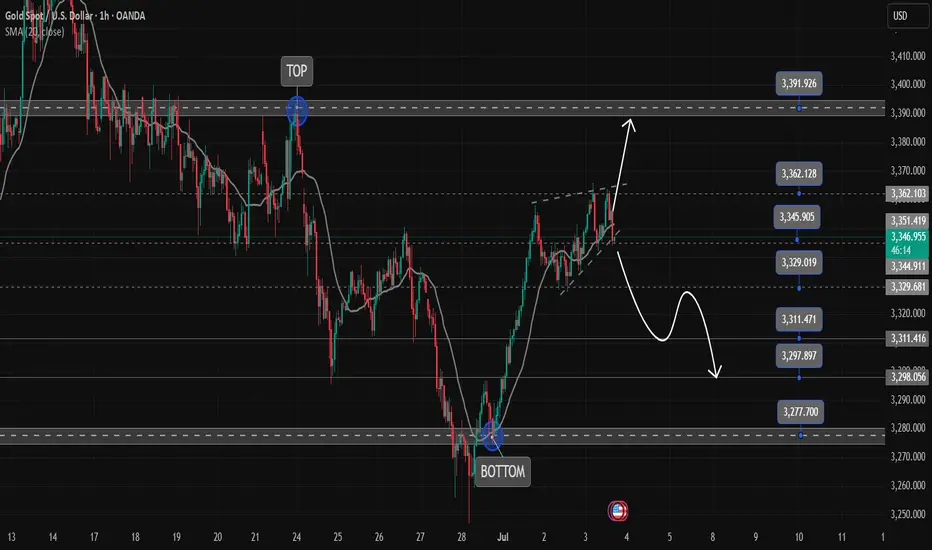
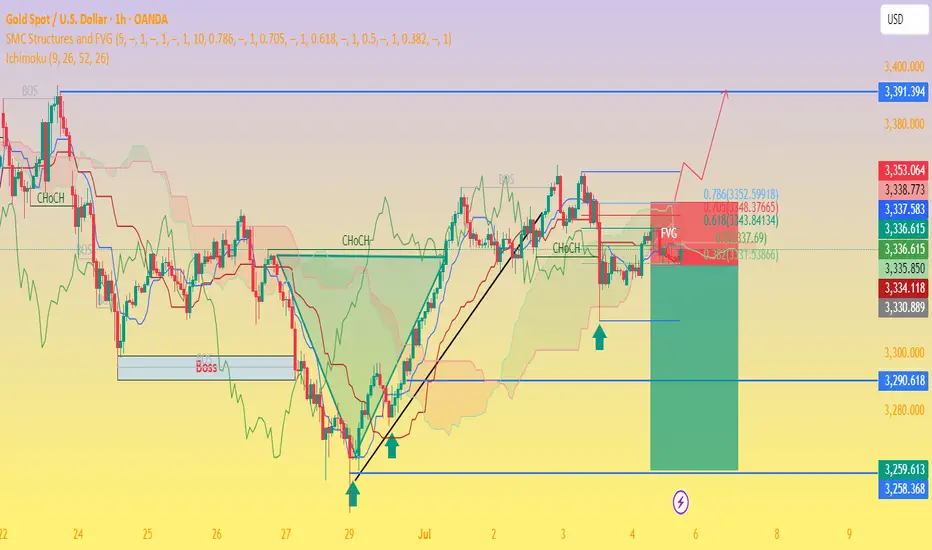
Gold Price Setup: Bullish Continuation or Rejection? 🧠 Chart Analysis (XAU/USD – 1H):
Key Structure Highlights:
CHoCH (Change of Character) zones marked both up and down indicate a battle between bulls and bears.
Recent bullish CHoCH followed by a fair value gap (FVG) retest suggests potential continuation to the upside.
Price recently bounced strongly from demand zone, shown by the green arrows and strong candle reaction.
Ichimoku Cloud:
Price is trying to break back above the Kumo (cloud), a sign of bullish momentum building.
However, resistance is still present with the Kijun and Tenkan lines converging.
FVG (Fair Value Gap):
The current price is attempting to fill and break above the FVG zone.
A successful breakout above this area confirms bullish intention.
Fibonacci Levels:
Price is hovering around the 0.5 - 0.618 retracement zone, often a strong reversal or continuation point.
Upside targets lie near the 0.786 retracement (3352) and ultimate target at 3391, a major resistance level.
Risk Management:
Trade setup shows an excellent Risk:Reward ratio.
Stop-loss placed just below the last structure low.
Potential downside to 3290–3258 if breakout fails.
🟢 Possible Next Move:
Bullish Scenario: If price clears the FVG and breaks above 3353, expect continuation to 3391.
Bearish Rejection: If rejected at FVG/0.618 level, watch for a drop back to 3290 or even 3259.
Xauusd Going Towards BuyDespite rising selling pressure on the dollar and mixed US PCE numbers, Gold prices fell further on Thursday, reaching new four-week lows around $3,260 per troy ounce. Collaborating with the decline, recent improvements in the Israel-Iran conflict continue to fuel investor withdrawals from the safe haven region.