Gold on upswing as expectedAs discussed throughout my yesterday's session commentary: "My position: Since #3,337.80 was neckline for upside Bull structure, I was aware if it gets invalidated to the downside, it will open doors for #3,327.80 extension (which held twice throughout late U.S. and Asian session). I don't expect much Selling action today however Bulls need another Fundamental push to invalidate wall of Resistances at #3,340's and #3,350's. I will continue Scalping as opportunity arise / no Swing orders."
I have expected Gold to test upside extension where I Bought (Scalp of course) #3,342.80 twice towards #3,348.80 and re-Sold #3,357.80 - #3,362.80 belt many times (excellent returns). I will await area to be engulfed and only then make my move.
As I am getting many Fundamental inquiries lately: Gold's current almost #2-Year perma-Bull outlook is driven by more than Fundamentals - rising Global debt, Central bank Buying (especially by China), and general declining trust in fiat currencies all play key roles in Gold's perma-Bull stance. It's considered undervalued by some part of my analysis when adjusted for Inflation and Money supply expansion (like #M2 growth). Gold acts as a Long-term hedge against currency devaluation and systemic Risk, especially during Global conflicts or financial crises. Mining costs are also on the rise while new discoveries are declining, which supports Higher future Prices. With ongoing de-Dollarization and interest in Gold-backed digital assets, the Long-term future of Gold looks structurally strong.
My position: Gold is Trading within #3,350's belt which represents crossroads for the Short-term. Either #3,362.80 - #3,368.80 break-out to the upside towards #3,377.80 strong Resistance, or #3,342.80 - #3,352.80 break-out to the downside towards #3,327.80 Support. Current Price-action is ideal for Scalping since I don't expect major movement until tomorrow's NFP numbers.
XAUUSDG trade ideas
XAUUSD:A long trading strategy
The highest gold price in the Asian session reached 3365.4, which is already our mid-line target range. If you have completed and left the market, congratulations, because I personally set the TP point of 3368, so it did not touch, the trend of the past two days is appropriate rewithdrawal after strengthening, the high is also gradually rising, the overall long trend has not changed. For today's data, the probability will make gold prices continue to rise, trading ideas or to do the main.
Trading Strategy:
BUY@3347-51
TP:3365-70
This TP range is also the target range of the median trader, for friends who do not have automatic stop profit, you can take a profit manually at that time.
More detailed strategies and trading will be notified here ↗↗↗
Keep updated, come to "get" ↗↗↗
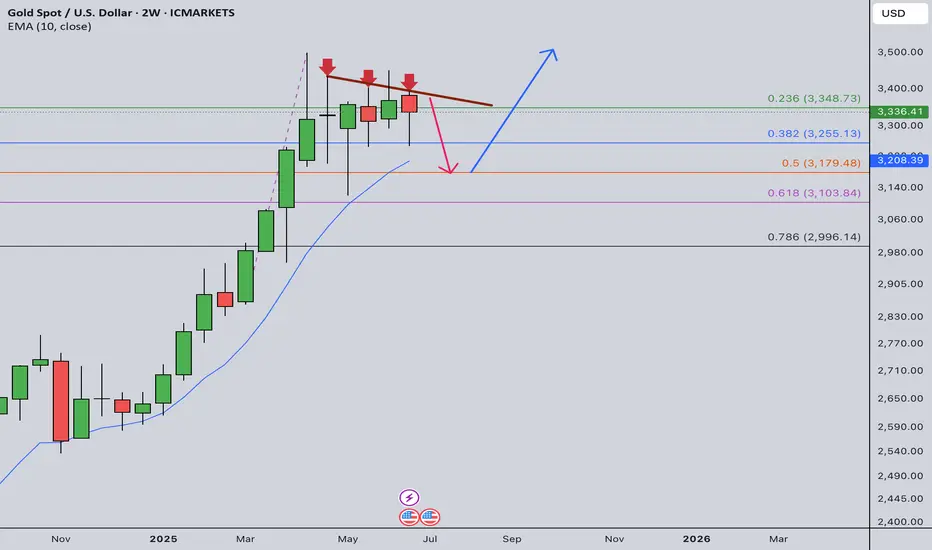
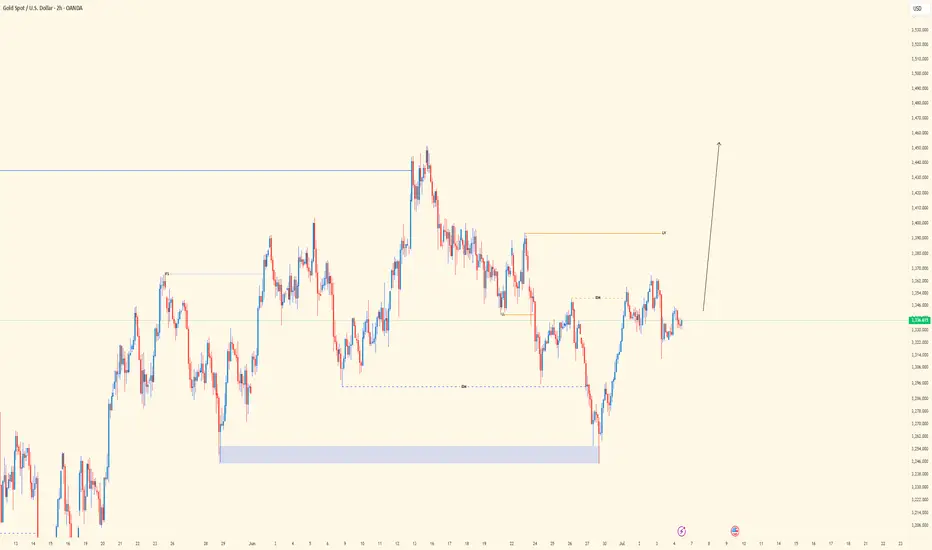
Gold Weekly Summary and Forecast 7/5/2025In my half year review, I expected next half year gold will continue its bullish drive. Overall picture shows a bullish momentum. However, the road is not straight and could be bumpy.
In 2W TF, there is a three drive pattern indicated in the chart with three red arrows. An immediate price drop will follow from this pattern. Therefore, I am expecting the price to drop to 3180 before next take off.
Next week's high is max at 3380 and could drop to 3260. Watch out the daily trading plan for more details next week.
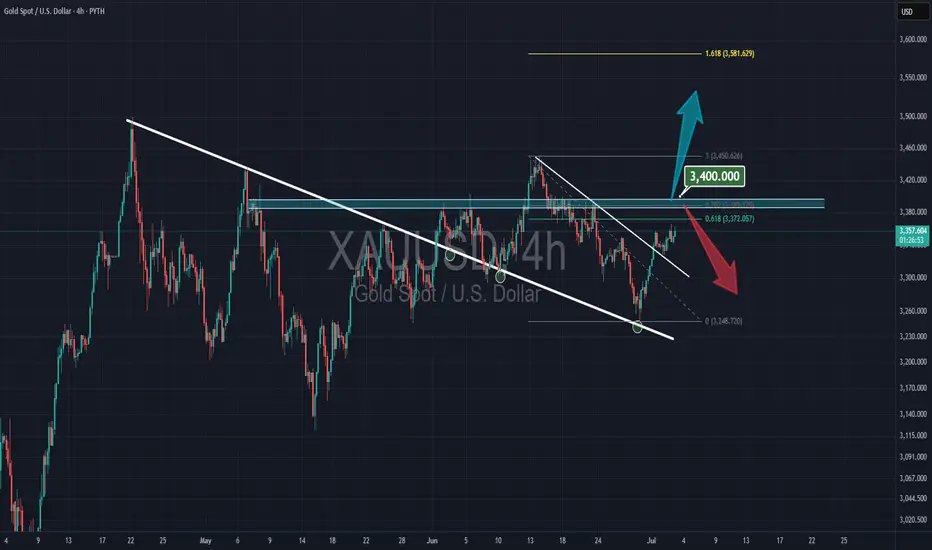
Gold & $3400Gold is under the resistance at $3400 for a long time, and if can not break that then downside movement will come.
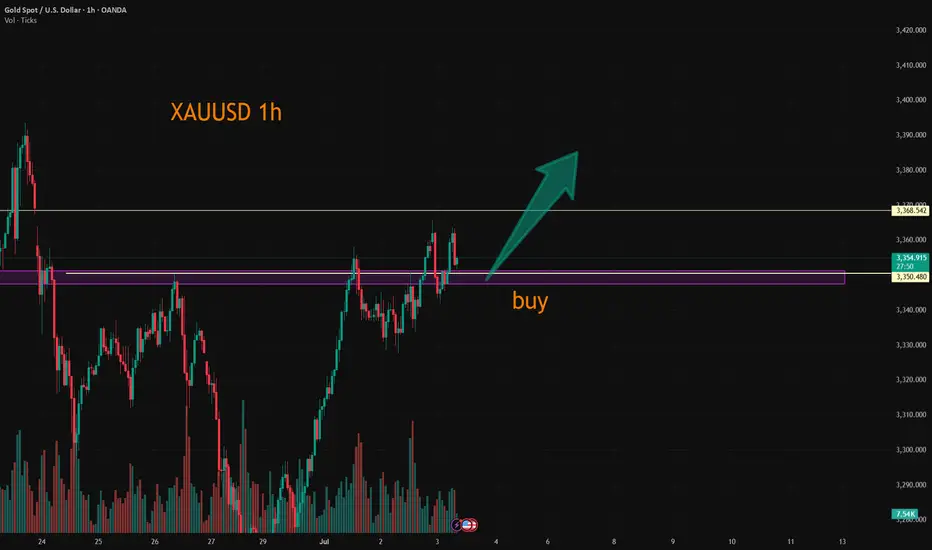
Gold remains strong, and we continue to buy on pullbacks!ADP employment unexpectedly turned negative, and the probability of a rate cut increased again
The ADP employment report released on the same day showed that the number of private sector jobs in the United States decreased by 33,000 in June, the first net loss since March 2023, and the May data was also significantly revised down to +29,000. After the release of the ADP data, the probability of the Federal Reserve's interest rate cut in July quickly rose from 20% before the data was released to about 27.4%. The market's bet on a rate cut before September has almost been fully factored in, and federal funds futures also show that the possibility of a 50 basis point rate cut has risen to 22%.
This "frown-making" data released a strong signal of cooling in the labor market before Thursday's non-farm report. If today's non-farm continues to be weaker than expected, it may force the Federal Reserve to act faster.
Gold opened high and then retreated continuously. From the daily chart, gold is still in an upward trend in the long term. The previous market rebounded effectively after touching the downward trend line, and the rebound force was considerable. With the restart of the bullish force, the main idea can carry the trend and do more on dips. In addition, from the 4-hour chart, gold has broken through the previous downward trend line and has gone out of the V-shaped reversal pattern, which means that the previous short-term downward trend has ended. At present, a new trend is also opening up in the 4-hour chart. The rise of gold has also established an upward trend line. You can consider buying on dips based on the upward trend line 3332. However, due to insufficient bottoming time in the previous stage, it may still face the risk of decline, so you should set the stop loss with caution. From the 1-hour chart, gold fell after opening high, and the bullish trend remains unchanged. The points for long orders can consider 3334 and 3328.
Gold operation suggestions: Go long on gold near 3325-3335, with a target of 3350-3360.
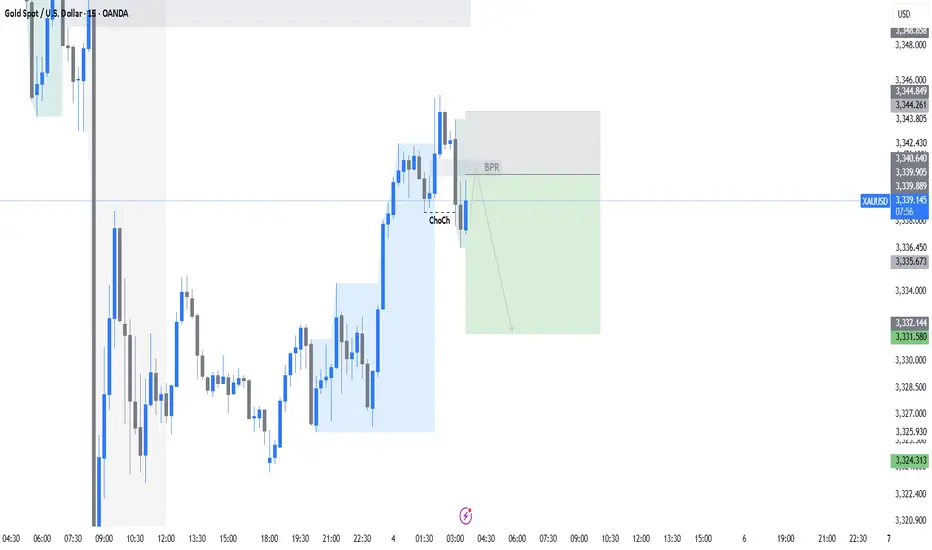
GOLD (XAUUSD) | 4H OB Respected | waiting for 30m LH BreakPair: XAUUSD
Bias: Bullish
Timeframes: 4H, 30M, LTFs
• 4H showing strong bullish structure — OB respected cleanly, confirming higher timeframe demand.
• On 30M, now patiently waiting for the break of LH to confirm continued bullish intent. After that, looking for a sweep off a fresh internal OB for LTF entry confirmation.
🔹 Entry: After LH break + sweep + CHoCH on LTFs
🔹 Entry Zone: Within fresh internal OB post-LH break
🔹 Target: Near structure highs
Mindset: Let the structure speak. No guesswork — wait for your levels, your break, and your confirmation. Precision over prediction.
Bless Trading!
Gold price rises by more than $100, will the bull run continue?📰 News information:
1. Geopolitical situation
2. PMI data
3. Global Central Bank Governors Meeting
📈 Technical Analysis:
The NY session is about to begin, and there are two things we need to pay attention to. First, the PMI data, and second, the talks between global central bank governors. If Powell again hints that the inflation outlook is weaker than expected, this will increase the Fed's easing bets and trigger a new round of decline in the US dollar. The dovish tone may help gold prices to further rebound. On the contrary, if Powell makes some hawkish or cautious remarks, this may exacerbate the recent downward trend in gold prices. The key point at present is the 3350 mark. If the 4H closing line of the NY session remains below 3350, then in the short term we are expected to continue to retreat to the 3330-3320 range. If the 4H closing line is above 3350 and stabilizes, gold may rebound to the 61.8% position, which is around 3372.
🎯 Trading Points:
SELL 3340-3350-3355
TP 3330-3325-3320
BUY 3330-3320
TP 3340-3350-3372
In addition to investment, life also includes poetry, distant places, and Allen. Facing the market is actually facing yourself, correcting your shortcomings, confronting your mistakes, and strictly disciplining yourself. I hope my analysis can help you🌐.
FX:XAUUSD FXOPEN:XAUUSD PEPPERSTONE:XAUUSD FOREXCOM:XAUUSD FX:XAUUSD OANDA:XAUUSD TVC:GOLD
July 3, 2025 - XAUUSD GOLD Analysis and Potential OpportunityAnalysis:
Today, the NFP report will be released during the US session.
Before Asian trading even began, the market saw a sharp downward move.
It’s possible that both the Asian and European sessions will remain range-bound until the data release provides a clear direction.
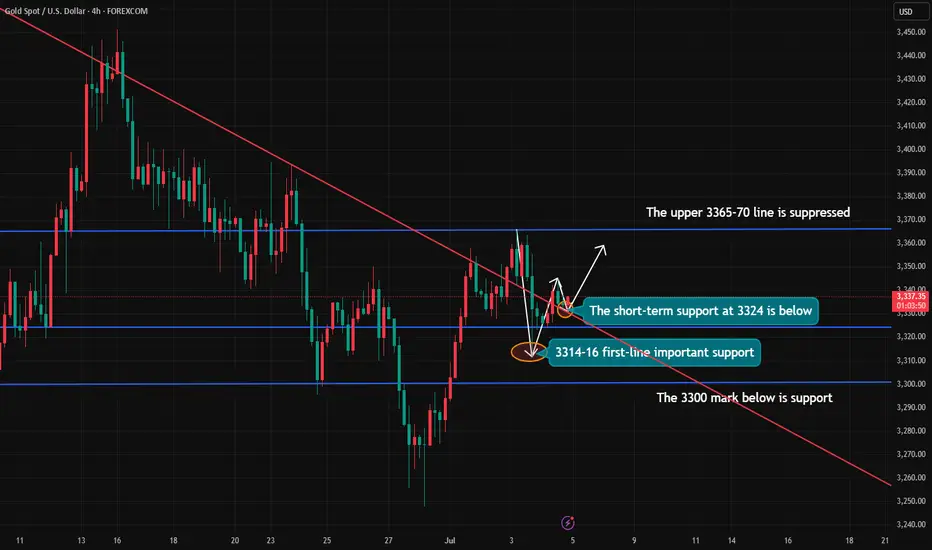
Until then, treat 3342–3365 as the primary range and focus on selling near resistance and buying near support within this zone.
🔍 Key Levels to Watch:
• 3375 – Resistance
• 3365 – Resistance
• 3358 – Resistance
• 3352 – Resistance
• 3342 – Important support
• 3337 – Support
• 3328 – Key support
• 3310–3312 – Intraday key support zone
• 3300 – Psychological level
📈 Intraday Strategy:
• SELL if price breaks below 3342 → target 3337, then 3333, 3328, 3322
• BUY if price holds above 3348 → target 3350, then 3352, 3355, 3358
👉 If you want to know how I time entries and set stop-losses, hit the like button so I know there’s interest — I may publish a detailed post by the weekend if support continues!
Disclaimer: This is my personal opinion, not financial advice. Always trade with caution and manage your risk.
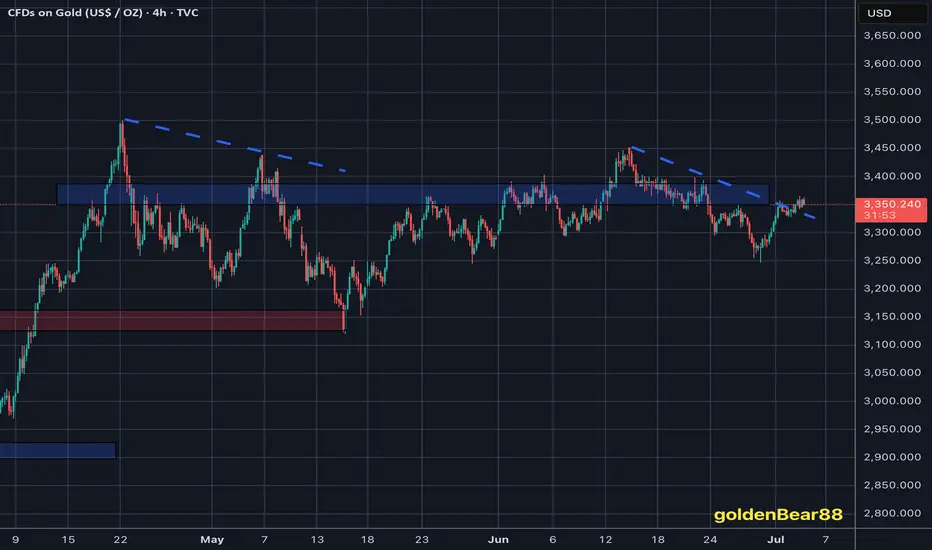
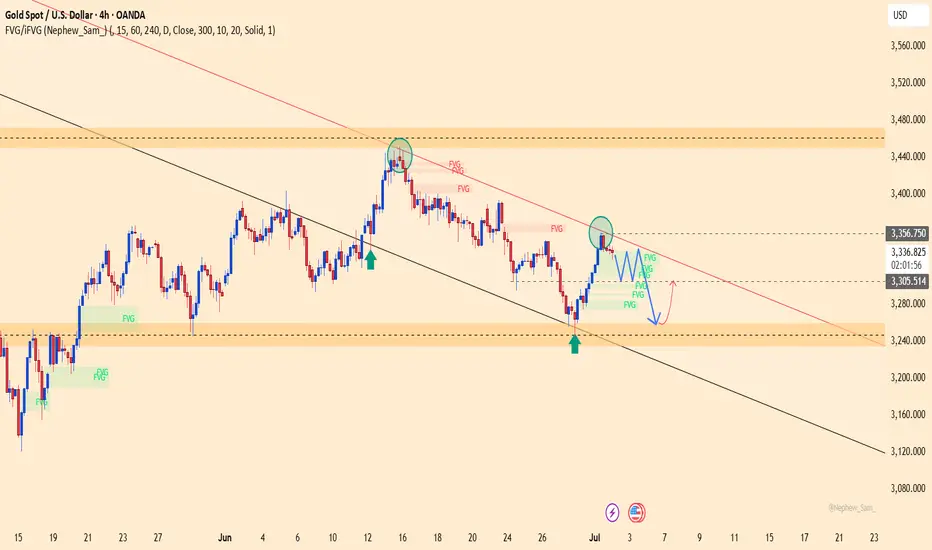
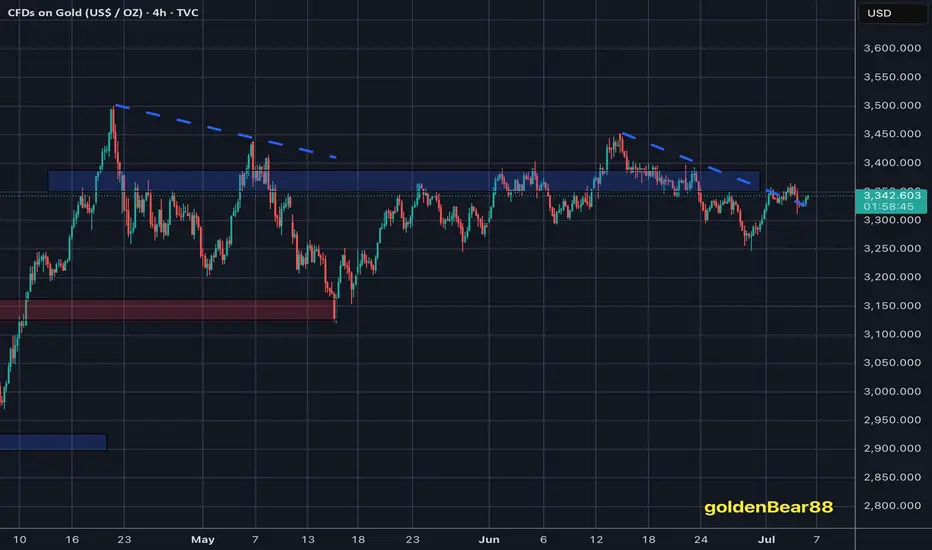
XAUUSD: Gold Surges on U.S. Fiscal Reform ExpectationsGold remains firmly within a short-term bullish structure after rebounding strongly from the $3,258 support zone and forming a consolidation pattern just below the $3,342 resistance. This area marks the confluence of a descending trendline and a fair value gap (FVG), where buyers may gather momentum to break through.
Fundamental news continues to favor the upside: concerns over the U.S. budget deficit and an upcoming tax reform package have boosted safe-haven demand for gold. Meanwhile, U.S. bond yields and the dollar remain low, further driving capital into precious metals.
Yesterday, gold rose by approximately $33.49, equivalent to 3,349 pips, confirming strong bullish inflows. If price breaks above the $3,342–$3,356 zone, the next target could extend beyond the $3,400 mark.
However, if short-term pullbacks occur, the $3,258 area remains a key support level to watch for potential bullish re-entry signals.
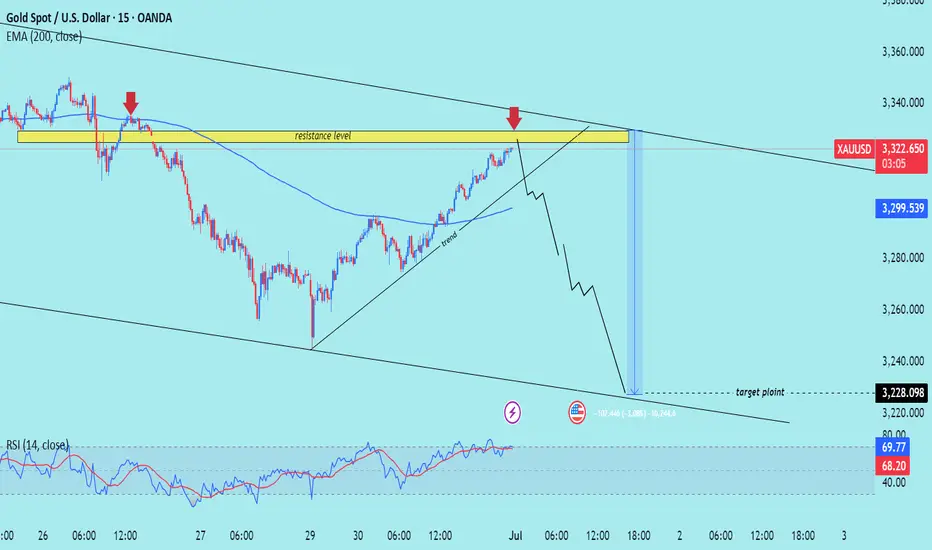
XAU/USD) bearish reversal analysis Read The captionTechnical analysis of (XAU/USD) based on price action and technical indicators on the 15-minute timeframe. Here's a
---
Key Technical Insights:
1. Resistance Level (Highlighted Yellow Zone):
Price is approaching a strong resistance zone (previous rejection marked by red arrows).
This area has historically pushed price downward.
2. Trendline Support (Rising Black Line):
Price has been following a short-term ascending trendline, forming higher lows.
A break below this trendline signals potential bearish reversal.
3. EMA 200 (Blue Line):
Price is currently above the EMA 200, indicating short-term bullish momentum.
However, price is testing resistance — a rejection could flip momentum bearish.
4. Bearish Rejection & Projection:
The chart shows an anticipated rejection from resistance, followed by a break of trendline support.
Target zone is marked near 3,228.098, indicating a drop of ~94 points from the current level.
5. RSI (Relative Strength Index):
RSI is nearing overbought territory (68.79).
A bearish divergence or RSI crossing down may confirm weakening momentum.
Mr SMC Trading point
---
Conclusion / Trading Idea:
Bias: Bearish
Entry Zone: Near the resistance level (~3,322)
Confirmation: Break of trendline support
Target: 3,228
Stop-Loss: Above resistance zone (just over the upper trendline)
---
pelas support boost 🚀 this analysis)
Gold lacks downward momentum.Today, gold is relatively quiet due to the impact of the US Independence Day holiday. Below, we continue to pay attention to the short-term quality layer of 3324. The key pressure above is maintained at yesterday's opening point of 3345-50. At midnight, gold rebounds near 3345-50 and can be shorted. The target is around 3330-33. It closes early at midnight and maintains a range of fluctuations! If your current gold operation is not ideal, I hope I can help you avoid detours in your investment. Welcome to communicate!
From the 4-hour analysis, pay attention to the support of 3324-30 below, focus on the support position of 3316, and pay attention to the short-term resistance of 3345-50 above. At midnight, the overall high-altitude low-multiple cycle participation remains unchanged. In the middle position, watch more and move less, be cautious in chasing orders, and wait patiently for key points to participate.
Gold Pulls Back After Strong US NFP Data📊 Market Overview:
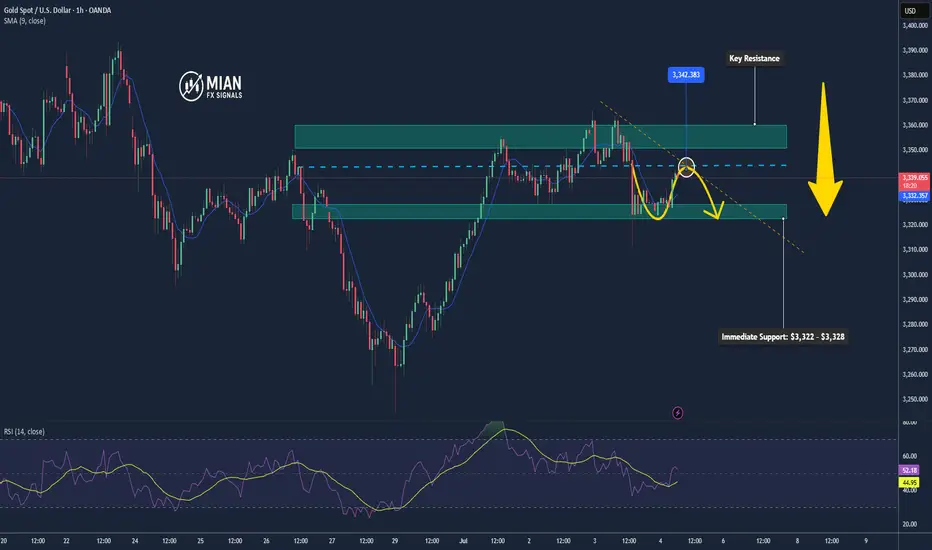
U.S. June Non-Farm Payrolls came in at 147,000 vs. 110,000 expected, strengthening the dollar and reducing expectations for a July Fed rate cut. As a result, gold dropped nearly 1%, trading in the $3,328–3,332 zone
📉 Technical Analysis:
• Key Resistance: $3,350 – $3,360
• Immediate Support: $3,322 – $3,328
• EMA: Price has fallen below the 09 EMA, indicating a bearish short-term trend.
• Candle/Volume/Momentum: A strong bearish candle with increased volume shows significant selling pressure post-NFP
📌 Outlook:
Gold may continue its downtrend in the short term if the dollar remains strong and no fresh bullish triggers emerge. A drop toward $3,322–$3,328 is possible.
💡 Trade Ideas:
🔻 SELL XAU/USD at: $3,342 – $3,345
🎯 TP: $3,322
❌ SL: $3,348
🔺 BUY XAU/USD at: $3,322 – $3,325
🎯 TP: $3,345
❌ SL: $3,316
Gold Daily Review
Dear traders, the sell-off last night directly brought the bulls back to their original form. The closing price of 3325 made most of the gains accumulated hard this week spit back. To me, this wave of market is a typical "data killing". The June non-agricultural data came out halfway, and the employment data was so strong that even the old foxes on Wall Street were surprised. Now the market's bet on the September rate cut has dropped directly from 70% to less than 50%. How can gold, which is "interest rate sensitive", withstand such a critical blow?
From a technical perspective, the negative line of the daily line is indeed ugly, but I think the bulls should not die. Look at the 4-hour chart. The Bollinger Bands have begun to "tighten their belts", and the 3310-3365 box is clearly drawn. Today is Independence Day. The US market closed early. Those Wall Street wolves probably ran to the Hamptons for a pool party. We are likely to play a "lying flat" market in the Asian and European markets. I calculated with my fingers that the 40 USD range of 3310-3350 is enough for us to toss around. Remember - short orders at the upper edge of 3345 should be as fast, accurate and ruthless as "whack-a-mole", and long orders at the lower edge of 3325 should be as patient as a fisherman!
The news is now "ice and fire". On the one hand, Trump's "big and beautiful" tax cut bill has just passed the test successfully. After this shot of booster, the US dollar and US bond yields are soaring like stimulants; on the other hand, drones in the Middle East are causing trouble again, and the small flame of geopolitical risk has not been extinguished. If you ask me, gold is like a "schizophrenic patient" now, jumping back and forth between inflation narratives and risk aversion sentiment.
Specific strategy:
① Directly "operate from a height" near the rebound of 3345, set the stop loss at 3352, and the target position is the 3330-3320 range. Remember that this position is the "previous high neckline position" and the probability of breaking is not high.
② You can "lighten your position and fish" when it falls back to 3325. The defensive position of 3315 must be strictly guarded, and the target position is the pressure zone of 3335-3345
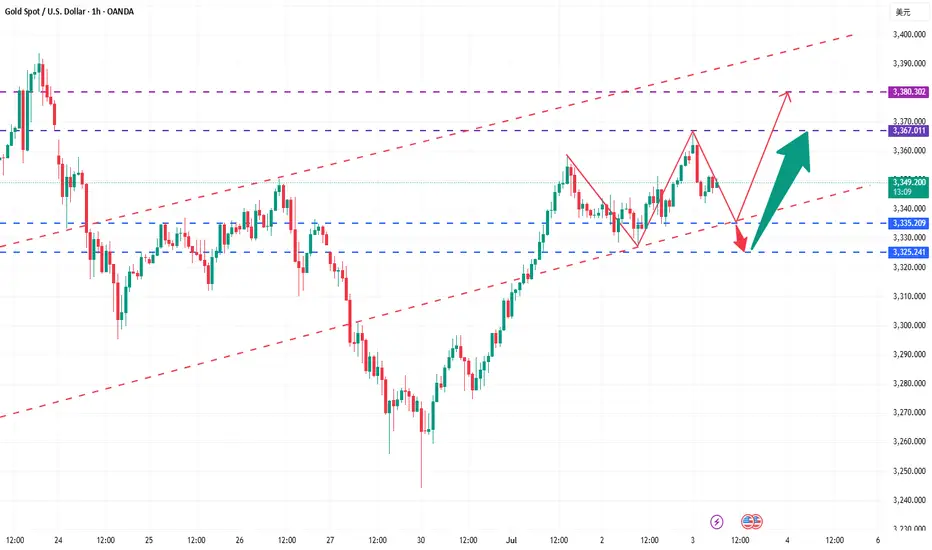
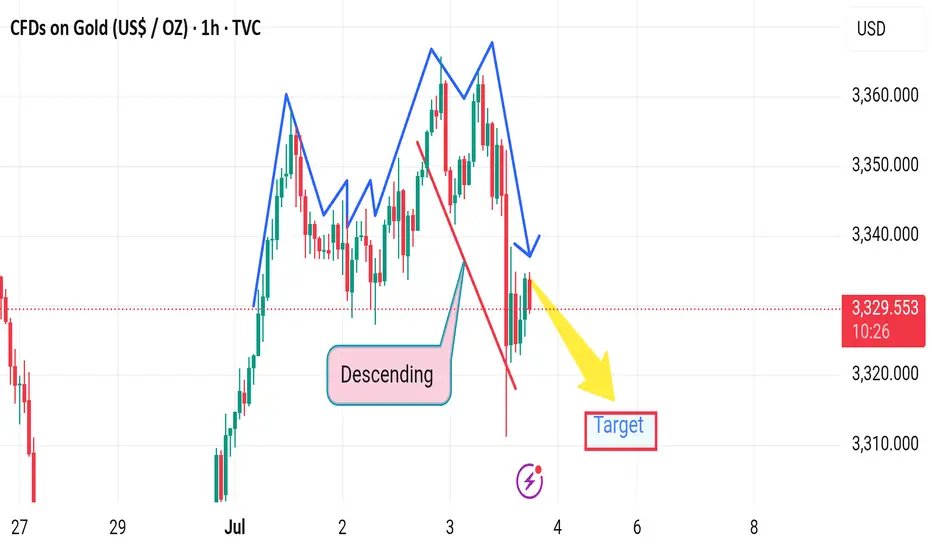
Market next target ⚠️ Disruption Analysis – Gold (1H):
🔹 Pattern Disruption Identified:
The chart previously followed a descending structure with lower highs and lower lows, confirming bearish momentum.
However, a temporary recovery (small bullish correction) appears after a sharp drop, disrupting the previous flow.
---
🔄 Disruption Points:
1. Break in Momentum (Structure Shift):
The recent bullish correction (small upward leg) challenges the consistency of the descending trend.
It signals a potential pause or trap in the current bearish move.
2. Price Rejection Area:
Price attempted to bounce but failed to break above the previous lower high, indicating bearish strength remains intact, but is facing disruption from short-term buyers.
3. Volatility Spike:
The long wick on the recent candle shows a volatility disruption, likely due to economic news or high-impact events (suggested by the ⚡ icon on the chart).
4. Target Zone Disruption:
Though the yellow arrow points toward a bearish target, the slight upward pullback adds uncertainty about whether price will reach that level immediately.
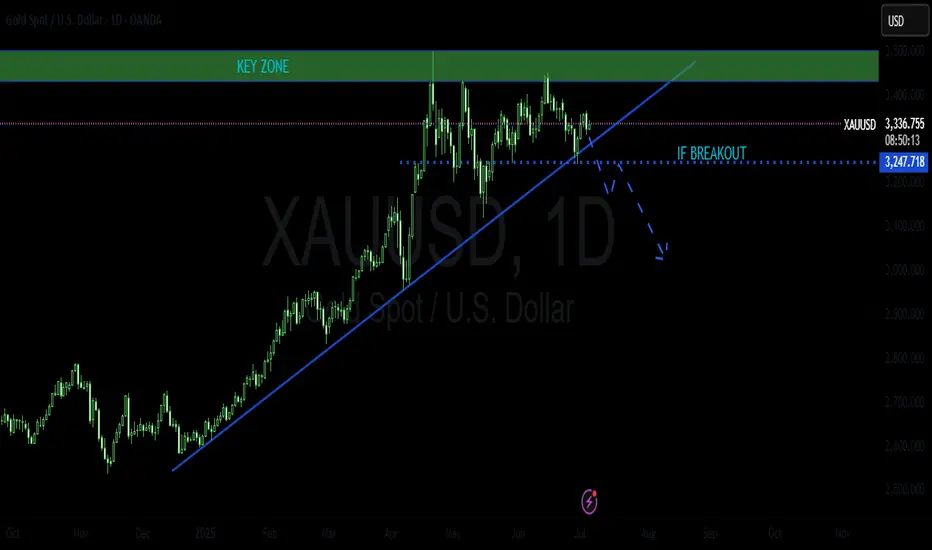
XAUUSD POSSIBLE SHORTOn the technical view, the instrument is trading in a global bull trend on D1. It recently rejected for the 3rd time near a key zone and is now testing a supporting bullish trendline. If this is broken below and the subsequent support, it will be a good indication of a bearish movement.
Please do your own analysis before taking any trades.
Cheers and happy trading !!!
My Weekly Review and Some tierlist for the zones I madeHello guys. its end of the week and I wanna share you my journey since monday until today. I also tell you the real reason why I don't believe the bottom is in yet and holding my swing sell. Thank you for watching.

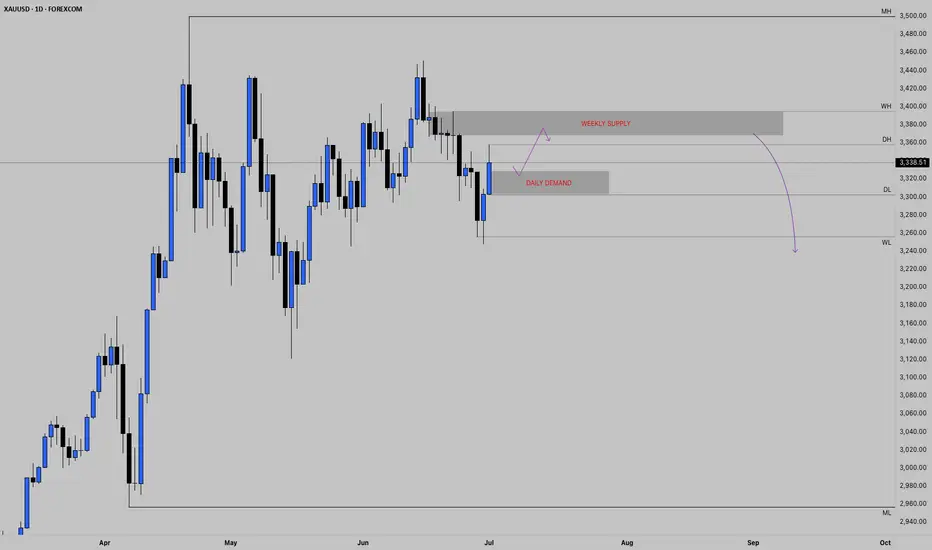
A LITTLE MORE RALLY?After price closed strong bearing the previous week, we have witnessed a massive rally back up into weekly highs. Even after 2 days of rally, this strong bullish pressure doesn't seem to be over looking at today's strong daily closure. We might just see price extend a little further into weekly highs as shown and now based on strong confirmations, a plunge back down into April's lows.
A continuation of the rally may be seen after price taps into the current daily demand region as indicated on the chart. Fingers crossed for confirmations
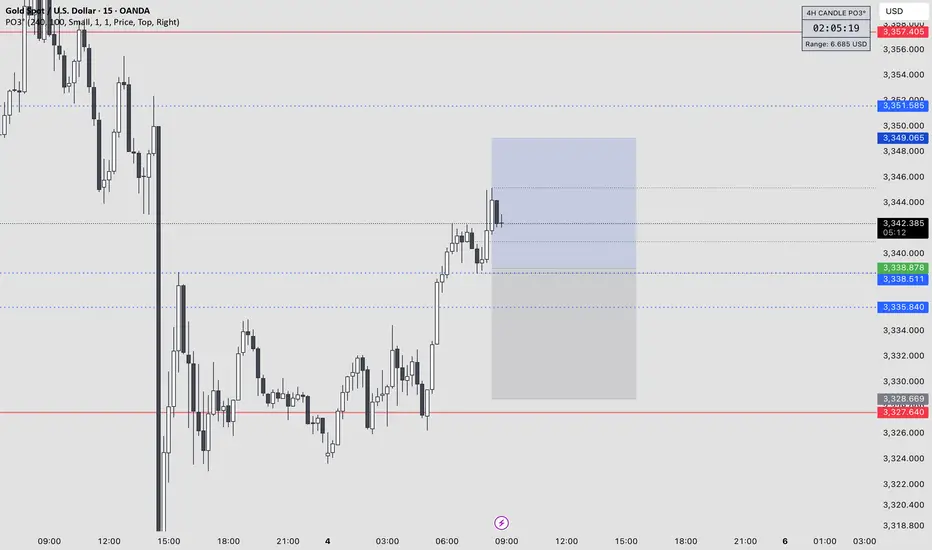
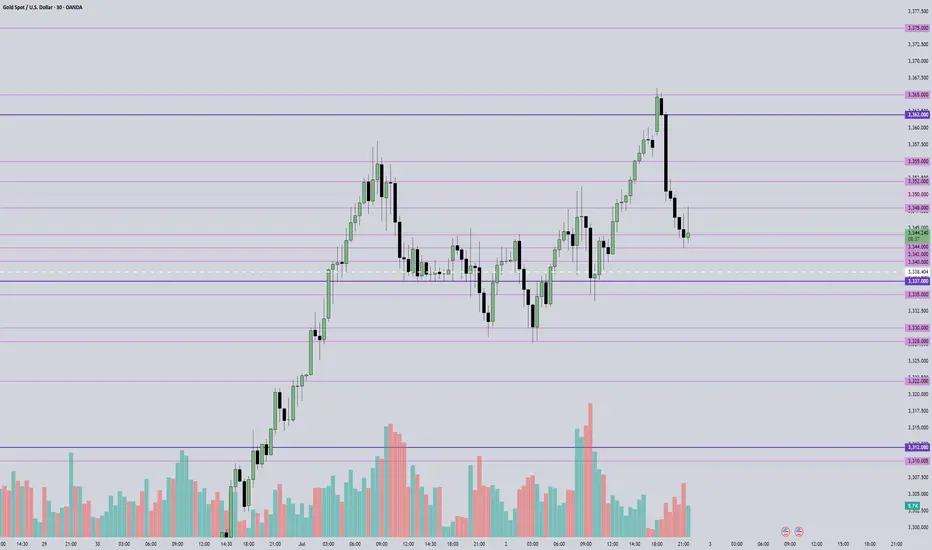
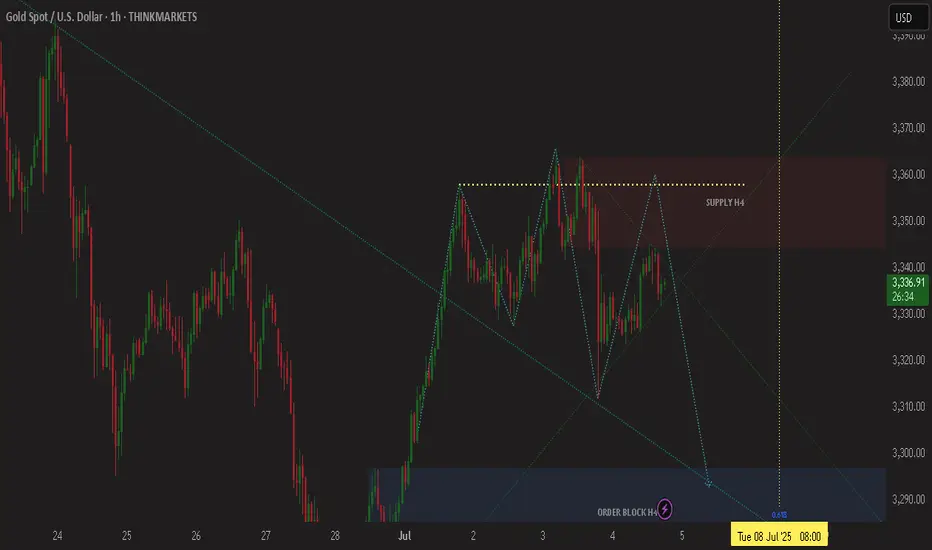
Excellent NFP sessionAs discussed throughout yesterday's session commentary: "My position: Gold is Trading within #3,350's belt which represents crossroads for the Short-term. Either #3,362.80 - #3,368.80 break-out to the upside towards #3,377.80 strong Resistance, or #3,342.80 - #3,352.80 break-out to the downside towards #3,327.80 Support. Current Price-action is ideal for Scalping since I don't expect major movement until tomorrow's NFP numbers."
Firstly I have re-Sold Gold almost all Wednesday's Asian session from #3,360's (Wednesday - Thursday) closing my orders on #3,352.80 then re-Bought Gold with set of aggressive Scalping orders from #3,345.80 towards #3,352.80. As NFP numbers were delivered, I have waited for decline to find a Support and Bought Gold aggressively from #3,312.80 and closed on #3,320.80. Later on, #3,332.80 Sold again (#4 aggressive Scalps) and closed on #3,327.80 and with mentioned order finalized excellent NFP session.
Technical analysis: The Short-term Price-action is Trading within #3,327.80 - #3,352.80 belt as I can easily spot idle movements on Hourly 4 chart with #3,327.80 Support bounces but regardless, Gold is Trading within my predicted values. Spot though on the Hourly 4 chart how Technicals are showcasing different / mixed values, and Gold is isolated within Neutral Rectangle with detectable Higher Low’s Upper and Lower zone. This is what I described on my commentary as an Bearish Divergence (BD) and is usually a first alert that the trend might be pointing to even stronger takedown. See how the very same divergence has Traded since November - April. On the November #12 Low, the Price-action started rising on an Ascending Channel but only once the structure formed a new Low. Then again after mentioned Low’s, Gold started rising until the next Bullish Divergence (which means, after local Low's tested, Gold engaged parabolic uptrend). I am monitoring closely #MA50 on Daily chart which is pointer for new #1 - #3 Month cycle.
My position: I will take no new orders as I am Highly satisfied with my returns / also it is holiday in U.S. as I do not expect major moves throughout the session (only ranging candles with Low Volume). Enjoy the Profits and have a great weekend!
Gold AnalysisI am seeing gold for a bearish move as it shifts its direction i am taking a short position from marked zone you guys can manage your risk accordingly
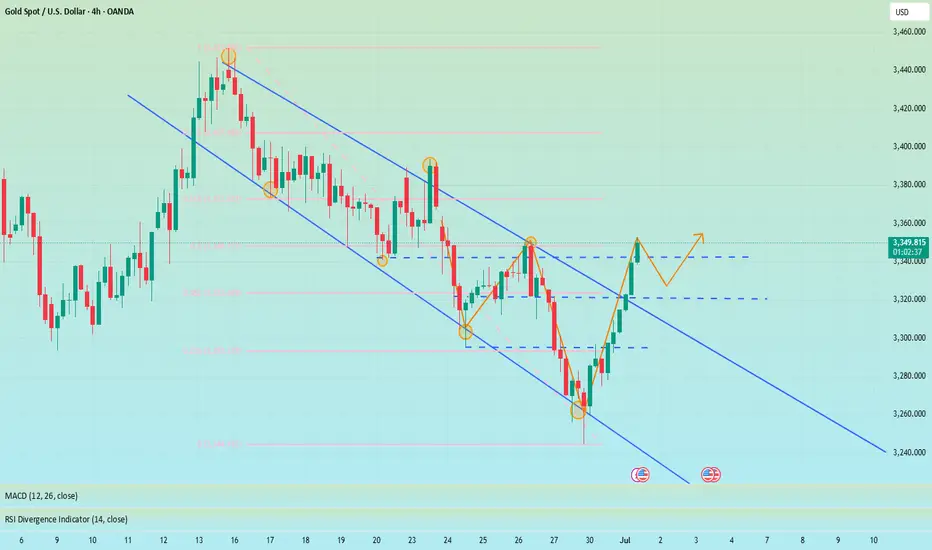
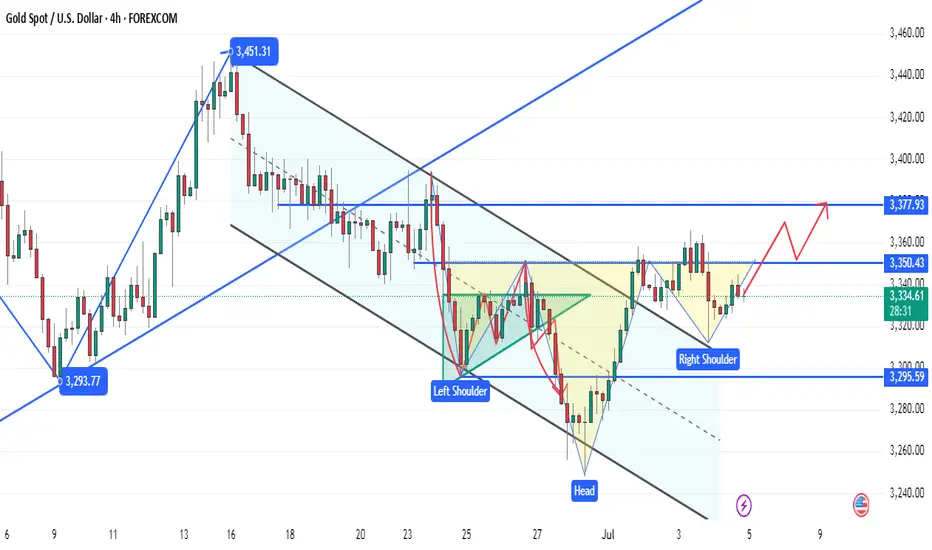
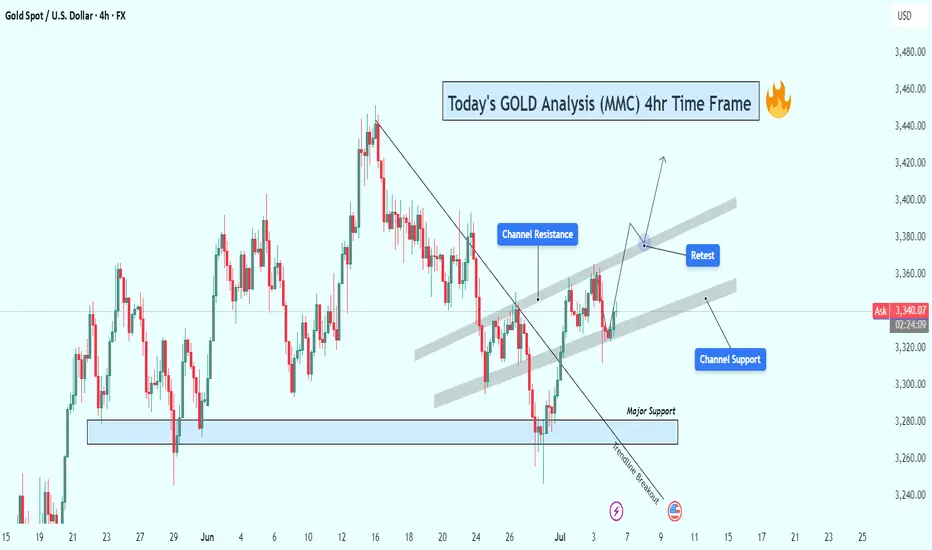
GOLD (XAUUSD) 4H Technical Analysis – Channel Breakout & Target🧠 Executive Summary:
The GOLD market has completed a key structural shift following a successful bearish trendline breakout, and is now trading within a well-formed ascending price channel. Price action has recently bounced from the channel support area, which aligns closely with a retested zone that was previously resistance. All signs now point to a potential continuation of the bullish leg—but only if the current structure holds.
This analysis outlines the technical foundation, key trading zones, price action psychology, and risk management factors that define this setup.
🔍 Technical Breakdown
🔸 1. Trendline Breakout – The Structural Shift
The bearish trendline, which previously capped multiple upside moves throughout June, has finally been broken.
The breakout was accompanied by higher volume and larger bullish candles, indicating momentum.
After the breakout, price pulled back near the trendline and respected the newly flipped support zone.
This forms a classic Breakout–Retest–Continuation pattern, one of the most reliable in trend reversal scenarios.
🔸 2. Formation of Ascending Channel – A New Bullish Structure
After the breakout, price action established a consistent pattern of higher highs and higher lows, confirming the birth of a new ascending channel.
The channel support (around 3,320–3,330) has been tested multiple times and held strong.
The channel resistance lies between 3,390–3,400, which is now the next short-term target if bulls maintain control.
The channel offers both trend direction and entry timing opportunities as price bounces between its boundaries.
🔸 3. Retest Zone – Buyer’s Territory
The price is currently bouncing off the mid-channel zone, where the previous downtrend resistance overlaps with current channel support.
This confluence area is where smart money often enters after institutional accumulation at the base (around 3,270).
The bullish wick rejections around this zone signal a likely continuation toward the upper channel.
📈 Price Behavior & Market Psychology
What’s happening here isn't just lines and candles—there’s a psychological story unfolding:
Fear drove the market lower, respecting the bearish trendline until late June.
Hope and buyer aggression surged once the breakout confirmed.
Now we’re in the "belief" phase, where traders await confirmation of the new trend.
Many are watching for entry confirmation at support zones, and as long as fear doesn’t return (i.e., price breaking below 3,320), the structure remains valid.
🧭 Key Technical Levels to Watch
Level Type Price Range Notes
Major Support Zone 3,270–3,285 Key buyer zone, invalidation of bullish case below this
Channel Support 3,320–3,330 Retest zone after breakout, current active level
Mid-Channel Area 3,350–3,360 Decision zone – price may build momentum here
Channel Resistance 3,390–3,400 First bullish target, potential breakout area
Breakout Target 3,420–3,440 If price breaks channel resistance with volume
🧮 Trade Setup Ideas (Educational – Not Financial Advice)
🟢 Long Setup Option 1:
Entry: Upon confirmation above 3,340–3,345 with bullish engulfing candle or breakout bar.
Stop-Loss: Below 3,320 or slightly below channel support.
Take Profit: Partial at 3,390 (channel top), full at 3,420–3,440 breakout zone.
R:R Ratio: 1:2.5+ (highly favorable)
🔴 Bearish Scenario (Risk Management)
If price closes below 3,320 with momentum, expect a revisit to the 3,270–3,285 support.
This invalidates the current bullish channel structure and might bring in short-term bearish pressure.
Avoid long positions until new structure is formed.
🧠 Educational Takeaway for Traders
This analysis highlights the importance of:
Structure-based entries: Instead of chasing candles, you wait for confluence and entry triggers.
Multiple timeframe confirmation: Higher timeframes also show bullish bias, giving confidence to 4H trades.
Risk management: The current setup allows tight stop losses relative to potential reward, making it attractive.
By combining trendline breakouts, channel formations, and support/resistance flips, you significantly increase the probability of a successful trade.
📌 Final Thoughts:
Gold is giving traders a clean and structured opportunity. The market has shown strength through structure, not just random price spikes. With the ascending channel intact and price respecting support zones, there is a solid foundation for a bullish continuation toward 3,400 and beyond.
But as always, confirmation is key. Wait for price action to validate your bias, and never ignore risk management.
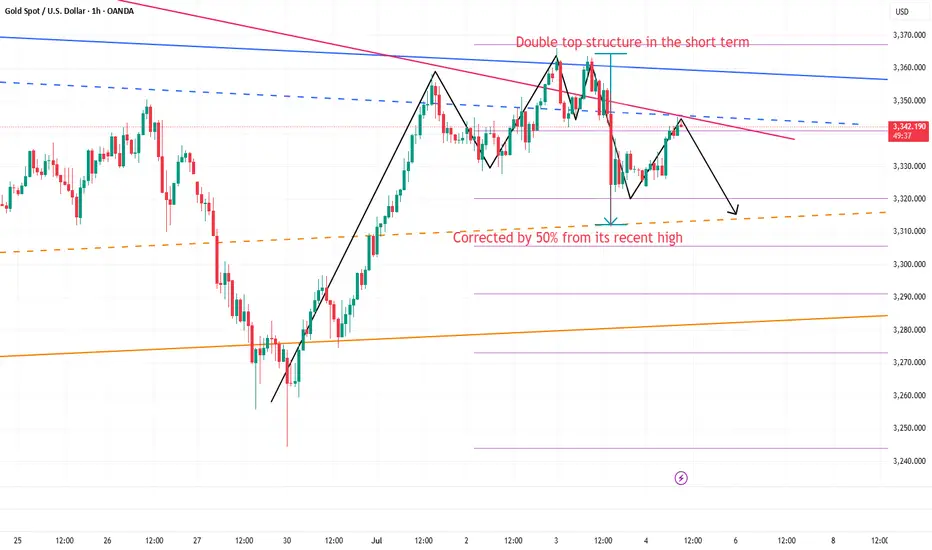
Still short gold before breaking 3355After the release of NFP yesterday, gold began to fall sharply from 3352, reaching a low of around 3312; although it has gradually rebounded above 3340, the time span is not short, so the rebound is not strong; and the double top structure successfully constructed by gold in the 3365-3360 area in the short term still plays a technical suppression role in the short term, greatly weakening the rebound potential; and with the decline of gold yesterday, I think before gold recovers the 3352 starting point, gold will also be under pressure in the 3345-3355 area in the short term. If gold cannot successfully break through this area during the rebound, gold is expected to retest the 3330-3320 area again.
Because of the US Independence Day, the gold market will be closed in advance today. It is expected that gold will not have a breakthrough today, so it may be difficult to break through the 3345-3355 area in the short term, so we can still continue to maintain the trading rhythm of shorting gold in terms of trading.
So I think shorting gold still has a lot of profit potential. We can short gold with 3345-3355 area as resistance and look to the target area: 3335-3325-3315.
XAU/USD Gold LONG 1:1 XAU/USD Gold LONG 1:1
Let's try to catch the low of the 4h candle, limit order.
Enjoy!