Gold 30M Engaged ( Bullish Entry Detected )
➕ Objective: Precision Volume Execution
Time Frame: 30-Minute Warfare
Entry Protocol: Only after volume-verified breakout
🩸 Bullish Wave Coming From Now : 3352
➗ Hanzo Protocol: Volume-Tiered Entry Authority
➕ Zone Activated: Dynamic market pressure detected.
The level isn’t just price — it’s a memory of where they moved size.
Volume is rising beneath the surface — not noise, but preparation.
🔥 Tactical Note:
We wait for the energy signature — when volume betrays intention.
The trap gets set. The weak follow. We execute.
Gold 30M Engaged ( Bullish Entry Detected )
XAUUSDK trade ideas
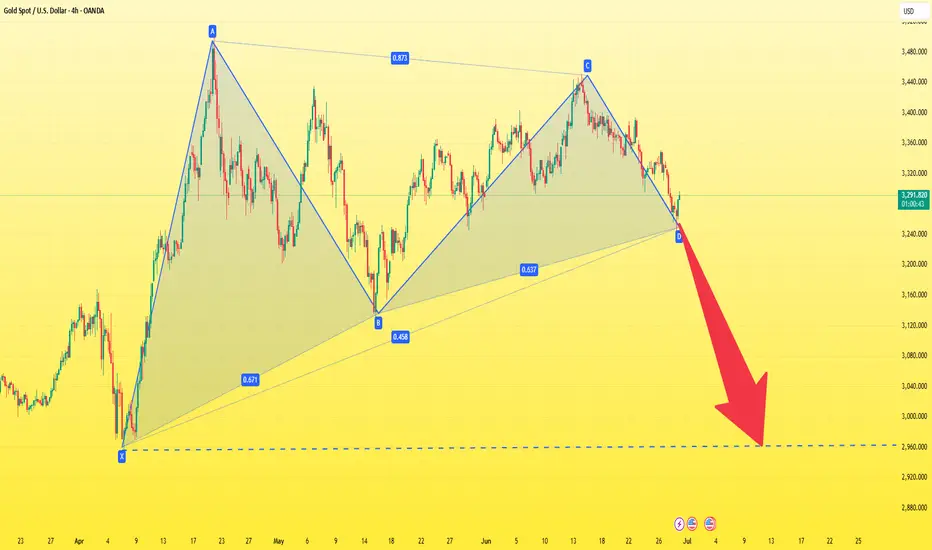
Cypher Pattern Walkthrough on GoldA look at a potential bearish cypher pattern on gold and an opportunity to trade while the market is stuck in a holding pattern.
Akil

Gold 30M Engaged ( Bearish Entry Detected )➕ Objective: Precision Volume Execution
Time Frame: 30-Minute Warfare
Entry Protocol: Only after volume-verified breakout
🩸 Bearish Wave Coming From Now : 3333
➗ Hanzo Protocol: Volume-Tiered Entry Authority
➕ Zone Activated: Dynamic market pressure detected.
The level isn’t just price — it’s a memory of where they moved size.
Volume is rising beneath the surface — not noise, but preparation.
🔥 Tactical Note:
We wait for the energy signature — when volume betrays intention.
The trap gets set. The weak follow. We execute.
Gold 30M Engaged ( Bearish Entry Detected )
Daily Outlook | XAUUSD June 30, 2025Hey traders,
Fresh week, clean structure. Let’s lock in the key levels and let price do the talking.
🌐 Macro Context
It’s a heavy week for USD – all major data drops before Friday:
Tuesday: ISM Manufacturing + Powell speaks
Wednesday: ADP Employment
Thursday: NFP, Unemployment Rate, ISM Services
Friday: US holiday – markets closed
📌 This means liquidity will build into Thursday, then fade. Expect gold to stay range-bound early in the week, unless momentum shifts hard today. Volatility should peak around NFP.
🧭 Daily Structure & Bias
Gold opened weak under 3287, still below 21EMA and 50EMA. The structure shows lower highs, bearish control, and no signs of strength reclaiming ground. RSI is at 42 — momentum down, but not oversold yet. Unless price breaks back above 3340, sellers stay in control.
✅ D1 Bias: Bearish while under 3340
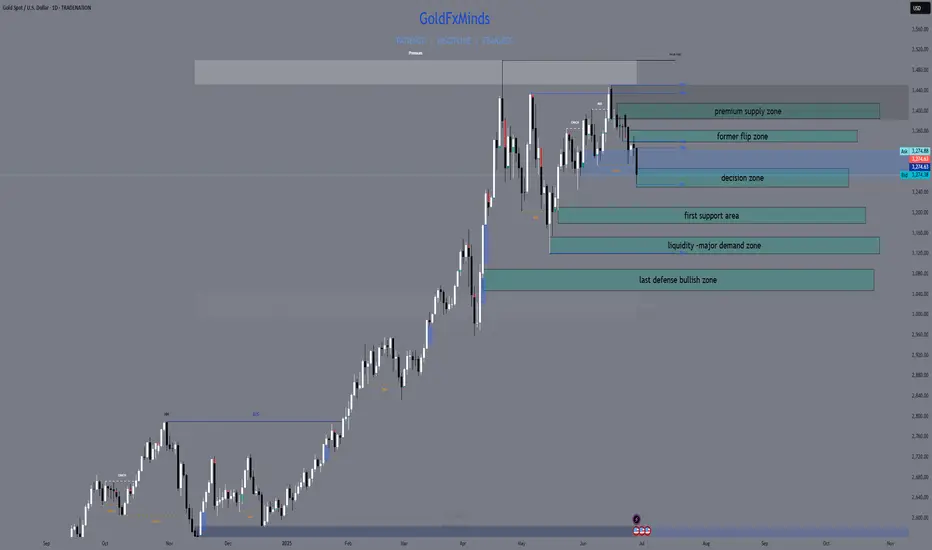
📌 Key D1 Zones to Watch
🔺 D1 Breaker Block – 3340–3355
Former support, now clean resistance. Includes 50EMA and last failed closes. If price rejects again here, bearish continuation likely. A daily close above 3355 flips short bias.
🔺 D1 Supply + FVG – 3385–3405
Unmitigated imbalance from early June. If price pushes through 3355, this is the next upside magnet. Good spot for first reaction.
⚖️ D1 Decision Zone – 3287–3265
Current price zone. Multiple past reactions. A daily close below 3265 confirms breakdown. Holding above = more choppy range.
🟢 D1 Reaction Shelf – 3210–3180
Minor support zone from April candle bodies. Can slow price, but not strong enough for reversal on its own.
🟢 D1 Demand Block – 3155–3120
First major HTF demand. Includes 200EMA, strong structure, and previous breakout base. If price sells into it fast, watch for rejection — but only with confirmation.
🟢 D1 Macro Demand – 3090–3055
Final line of macro defense. Clean imbalance + demand from February. Valid only if sentiment breaks post-NFP.
✅ Final Summary
• Below 3265 = structure breaks → opens 3180
• 3155–3120 = real support zone
• Below 3120 = macro shift risk
• Reclaiming 3340 = short bias invalid
• Break above 3385 = continuation possible
📌 Today is all about the close. No confirmation = no trade. Thursday is the real trigger — be positioned, not exposed.
—
📣 If this gave you clarity and structure, drop a 🔥, share your bias, and follow GoldFxMinds for sniper plans with zero fluff — only clean, confirmed price action.
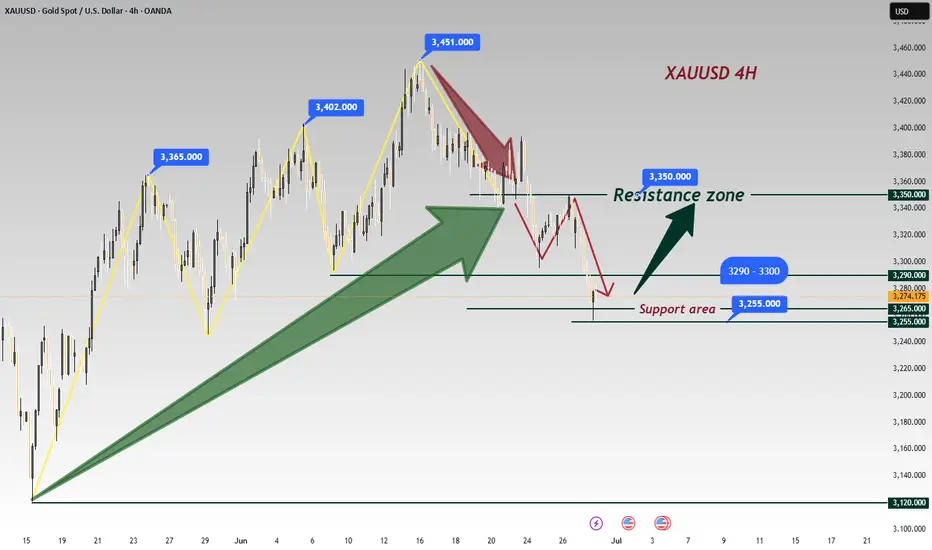
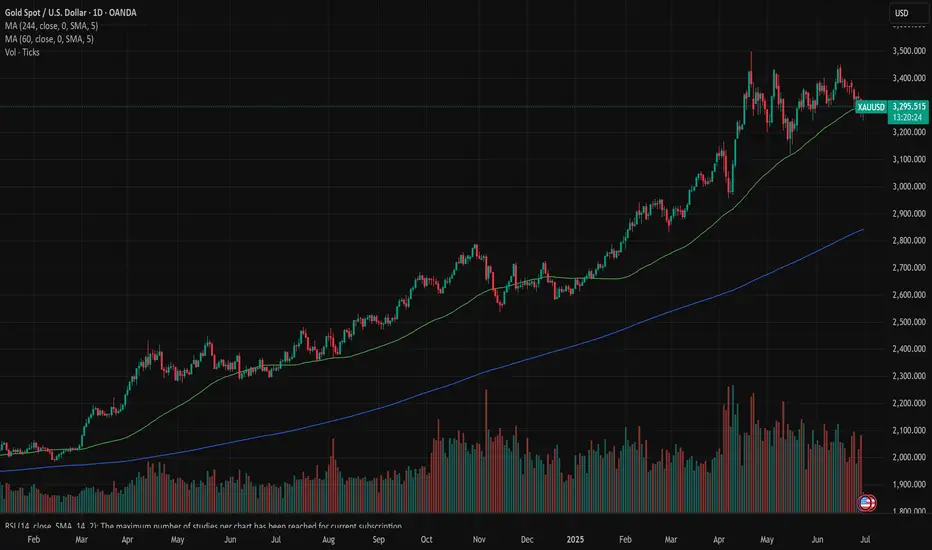
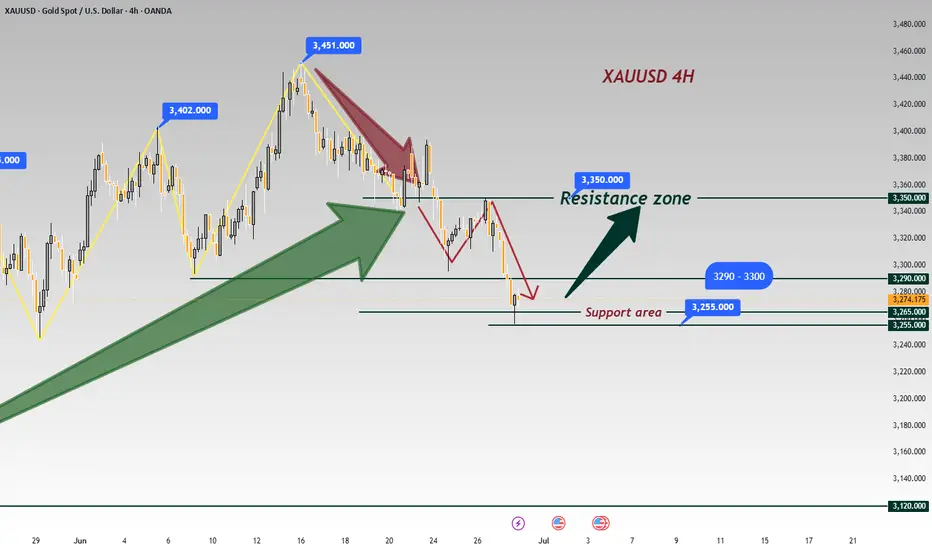
Gold Slides Further as Market Risk Eases and Inflation LoomsGold Slides Further as Market Risk Eases and Inflation Looms
Gold continues to extend its downward momentum for the second consecutive week, sliding from 3451 to 3283—a decline of nearly 4.85% in just 10 days.
Today, all eyes are on the U.S. inflation data. While the broader market reaction remains uncertain, gold appears particularly vulnerable to further downside pressure.
The temporary ceasefire between Israel and Iran, coupled with advances in the U.S.-China trade talks, has eased geopolitical tensions, diminishing the immediate appeal of safe-haven assets like gold.
Even if prices rebound toward 3300 or even 3350 in a deeper pullback, the overall trend remains bearish.
PS: This analysis assumes normal market conditions and excludes the influence of potential manipulation.
You may find more details in the chart!
Thank you and Good Luck!
PS: Please support with a like or comment if you find this analysis useful for your trading day
Previous analysis:
XAUUSDTHE united state interest rate stands at 4.25%-4.5%
the US10Y open the day at 4.293% and closes 4.26% a significant drop from may high of 4.62%
the dollar index is heading to 96$ after open 97.611$ to close 97.313$.
Final GDP q/q
Actual: -0.5%
Forecast: -0.2%
Previous: -0.2%
The US economy contracted by 0.5% in the first quarter, worse than the expected 0.2% decline, indicating a sharper slowdown than anticipated.
2. Unemployment Claims
Initial Claims: 236,000
Forecast: 244,000
Previous: 245,000
Initial jobless claims fell by 10,000 to 236,000, lower than forecast and near historically low levels, suggesting that layoffs remain relatively subdued despite economic challenges.
3. Core Durable Goods Orders m/m
Actual: +0.5%
Forecast: +0.1%
Previous: +0.2%
Core durable goods orders, which exclude transportation, rose 0.5% month-over-month, beating expectations and signaling some resilience in business investment.
4. Durable Goods Orders m/m
Actual: +16.4%
Forecast: +8.6%
Previous: -6.3%
Total durable goods orders surged 16.4%, a strong rebound following a prior decline, indicating a pickup in demand for long-lasting manufactured goods.
5. Final GDP Price Index q/q
Actual: 3.7%
This measure of inflation in the GDP deflator remains elevated, reflecting persistent price pressures in the economy.
Summary of Market Implications:
The larger-than-expected GDP contraction signals economic weakness, which could increase expectations for accommodative Fed policy.
The drop in initial jobless claims supports the view that layoffs are limited, but rising continuing claims suggest some labor market softness ahead.
Strong durable goods orders point to underlying business investment strength, providing a mixed but cautiously optimistic outlook.
Elevated inflation as shown by the GDP price index keeps inflation concerns alive.
Overall, the data presents a complex picture of a slowing economy with pockets of resilience and ongoing inflationary pressures
the interest rate remains 4.24%-4.5% ,the bond market remain weak on fiscal policy challenges and pending rate outlook.
the 10 year bond yield is trading around 4.291% -4.26% and edge lower from fundamental outlook.
gold on ascending trendline connecting April till June and found support at 3312-3314.
buyers during newyork session will build momentum on technical to bridge 3350 supply .
break below 3311-3314 will heading to my demand floor .
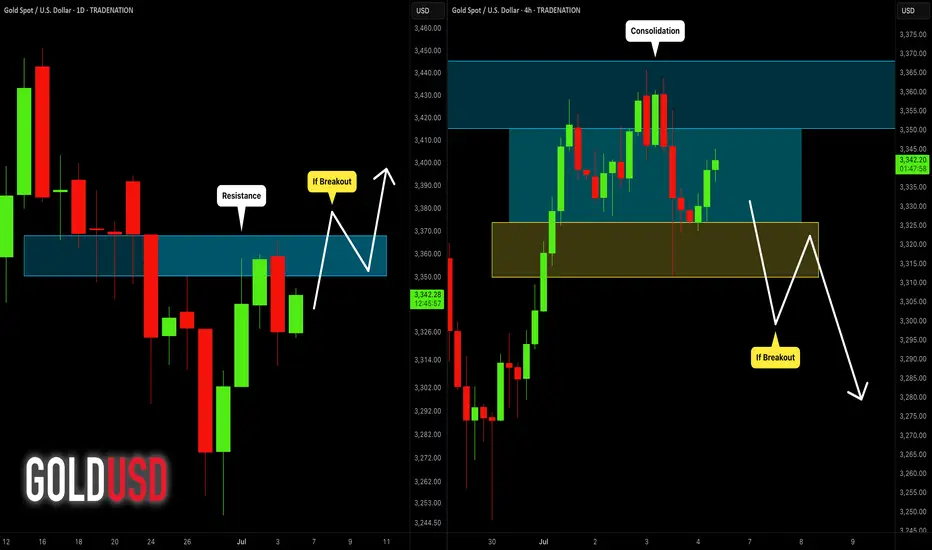
GOLD (XAUUSD): Potential Scenarios Explained
Here is my updated technical outlook for Gold with potential scenarios.
Bullish Scenario
The price is currently testing a significant daily resistance cluster.
Its bullish breakout and a daily candle close above 3368 will
provide a strong confirmation.
More growth will be expected then.
Bearish Scenario
For now, the market is consolidating on the underlined resistance.
The price is stuck within a horizontal range on a 4H time frame now.
Your bearish signal will be a breakout of its support and a 4H candle
close below 3310.
It will provide a strong bearish confirmation.
The market might be weak and remain within a 4H range today.
But, everything can happen, so watch carefully.
❤️Please, support my work with like, thank you!❤️
I am part of Trade Nation's Influencer program and receive a monthly fee for using their TradingView charts in my analysis.
Gold's 3290-3300 Support : Next Week Aims for Gap-Up Retest Last week, gold opened with a gap-up on Monday 🔼, then trended downward 🔽.
⚡ Notably, the 3290-3300 support zone held firmly from Monday to Thursday, demonstrating strong resilience.
🌱 The price plunged to around 3255 on Friday but rebounded promptly.
🔥 For next week, the opening may surge toward the 3290-3300 zone, warranting close attention.
🚀 Buy@3260 - 3270
🚀 TP 3280 - 3290 -3300
Accurate signals are updated every day 📈 If you encounter any problems during trading, these signals can serve as your reliable guide 🧭 Feel free to refer to them! I sincerely hope they'll be of great help to you 🌟 👇
XAUUSD I Forecast Ahead of USD Unemployment ClaimsWelcome back! Let me know your thoughts in the comments!
** XAUUSD Analysis - Listen to video!
We recommend that you keep this pair on your watchlist and enter when the entry criteria of your strategy is met.
Please support this idea with a LIKE and COMMENT if you find it useful and Click "Follow" on our profile if you'd like these trade ideas delivered straight to your email in the future.
Thanks for your continued support!Welcome back! Let me know your thoughts in the comments!

Gold: eased on tariffs dealAs geopolitical and economic tensions are slowly settling down, the price of gold eased its road toward the higher grounds. During the previous week, gold was traded with a bearish sentiment, dropping from the level of $3.395 down to $3.262. The main causes behind the drop in the price of gold are related to decreased tensions in the Middle East, as well as, settlement of the trade tariffs deal between the U.S. and China. Although the details of this deal was not disclosed publicly, still, the market reacted positively to the news. Investors moved funds from safe-haven assets toward the equity and the crypto market, as riskier ones in a quest for higher returns.
The RSI took the down path, ending the week at the level of 41. The indicator is currently clearly on the road toward the oversold market side. The price of gold breached the MA50 line during the previous week, which was acting like a support line for the price of gold during the previous period. The MA200 continued with an uptrend, following the MA 50 line. There is a high distance between two lines, so the potential cross is still not in the store for the price of gold.
Charts are pointing that the gold is on the easing road currently, with a potential for further correction in the coming period. The RSI is indicating that the oversold market side might be reached in the coming period, which means that the price could further ease. The bottom of the current correction might be $3.180, which was the highest level in mid April this year. Still, some short reversals are quite expected on this road, in which sense, Monday might start with a short attempt for higher grounds. In this sense, the $3,3K level might be tested.
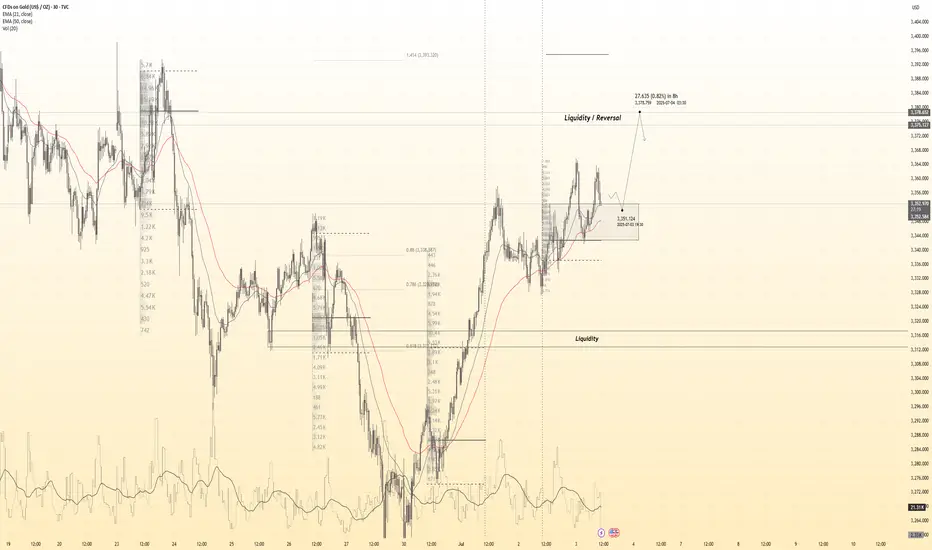
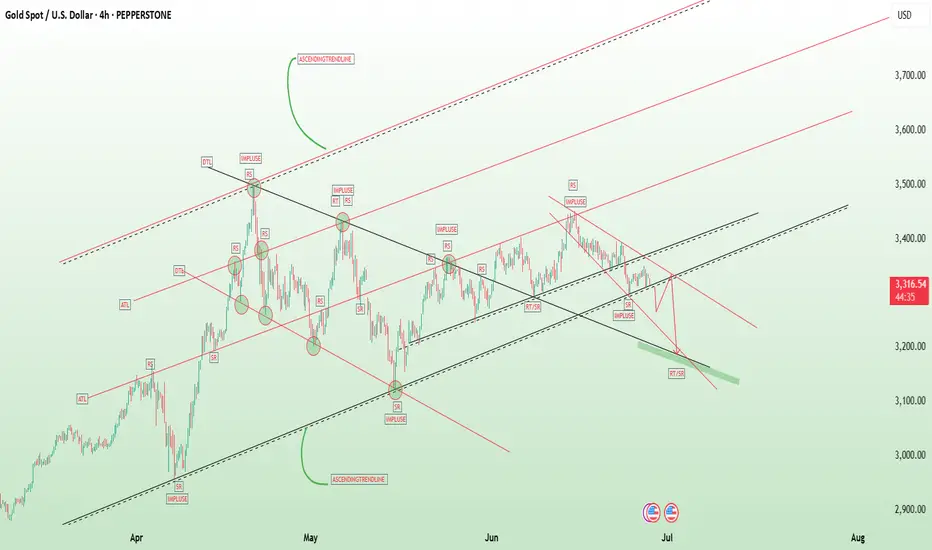
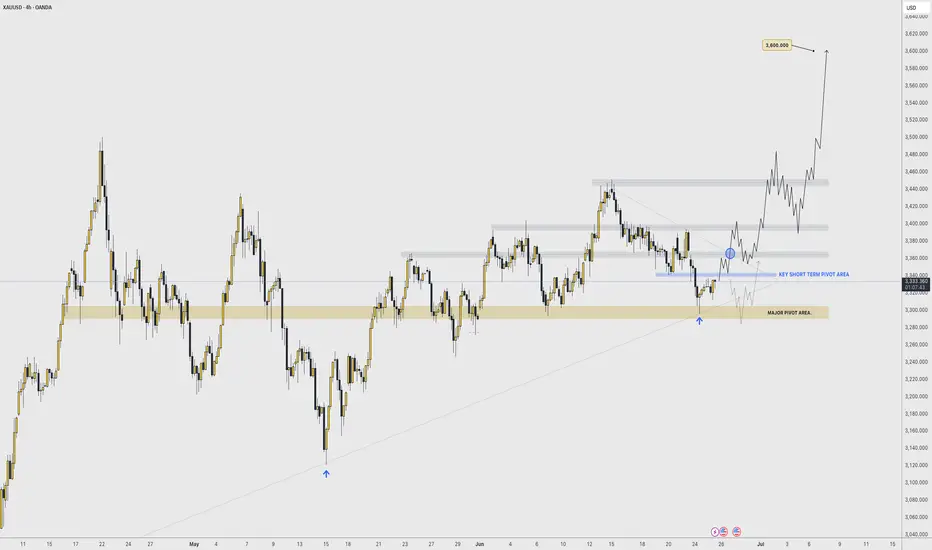
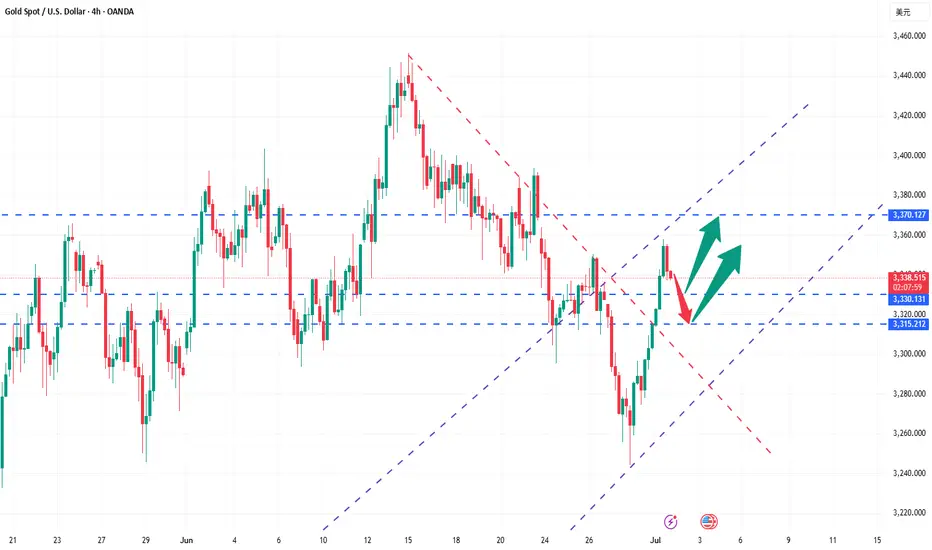
BULLS HOLDING KEY PIVOT 〉ATH AROUND THE CORNER As illustrated, Im trying to visualize what a potential bull run could look like starting from what seems to be a "bullish signature" move by gold: a diagonal double bottom.
Don't believe me; go back in time and study how gold makes bottoms and how new bull runs start. The fact that it was NY that manipulated BOTH times and got the best price, is a strong footprint that MIGHT just indicate a potential bottom (at least of this current bearish correction.
I won't say "this is it" and ATH are next FROM this potential rebound; HOWEVER, it could indicate at least the next 10 to 24 hours of potential bullish impulse to retest a degree of the bearish drop since Sunday's weekly open.
Hammer candle from Tuesday's NY session low + today's 4H bullish engulfing, are also powerful components that show bullish strength indicating 3300 to be a major support area.
I'm expecting (BUT NOT ADVISING) Asia to break aggressively to the upside confirming that this could have been this current correction's bottom, and/or at least this week's low.
Should Thursday close above Tuesday's high or consolidating near it, also shows signs of bullish strength and opens the door for Friday to make a second bullish impulse move.
This would reflect on the Weekly candle leaving a long rejection wick and closing (potentially) back above 3350 - 3360.
Should this be the case, the following week would have the road paved to lift off price to retest previous 4H highs of 3440 - 3450 range.
...
July is a bullish month historically. Don't believe me; search "seasonality tool, gold" and see it for yourself.
It is a matter of weeks for Gold to breakout of this wide accumulation phase it has been since end of April, and start a fresh and brand new bull run that could/should last until the end of the year.
-
GOOD LUCK
Persa
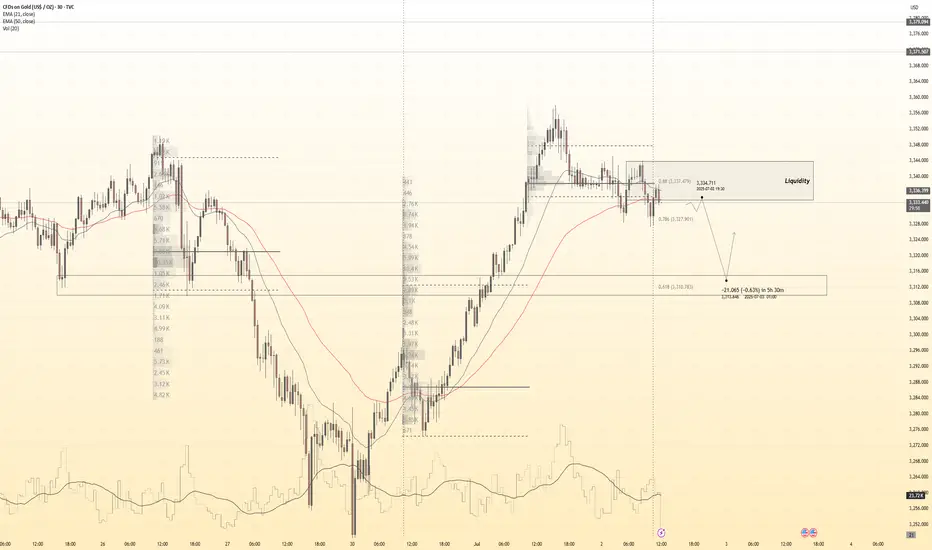
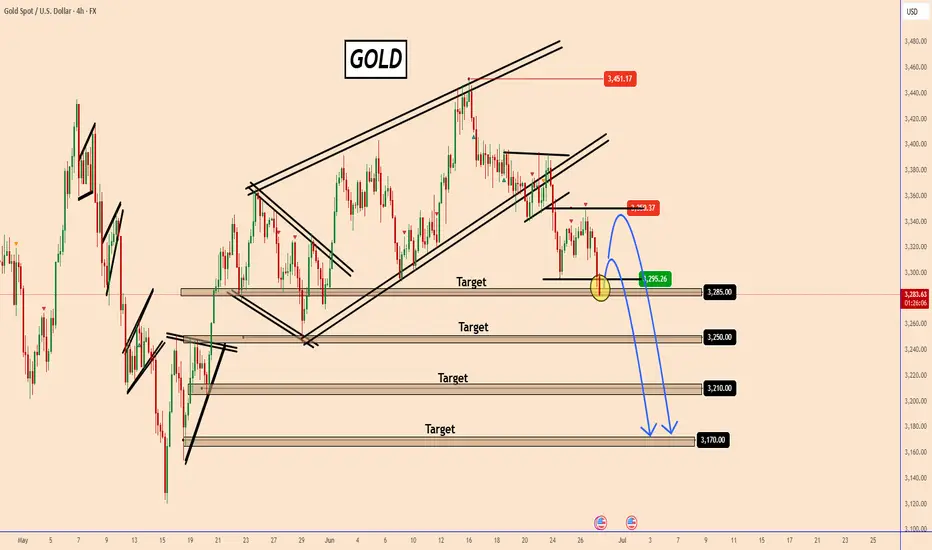
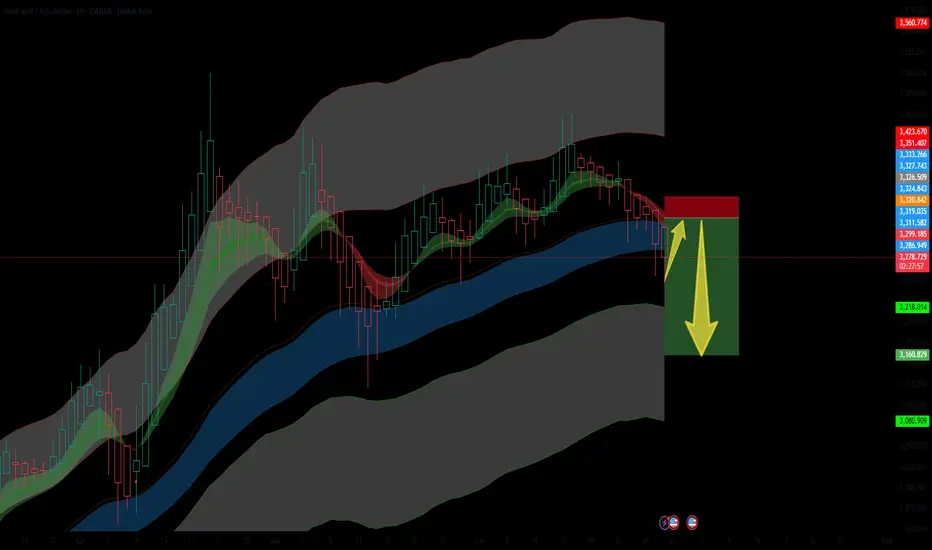
Bearish Setup for GoldGold is currently in a retracement phase after breaking below the mid Keltner channel zone. The small upward arrow marks this temporary relief rally, which I anticipate will be short-lived.
Price is testing the lower band of the inner Keltner channel after rejecting from the upper zones. The structure suggests a classic lower high formation before a potential major sell-off, targeting the deeper liquidity zones around $3,218 – $3,160 and possibly $3,080 if momentum accelerates.
📉 Bias: Bearish
📌 Invalidation: A clean break and close above the red resistance block (~$3,320+)
📌 Target Zones: $3,218 → $3,160 → $3,080
🔔 Look for volume drop and wick exhaustion confirming the next leg down.
This retracement may offer one final short entry opportunity before a deeper correction unfolds.
Gold continues to be weak, but be careful about operations📣Gold prices fell 2% last Friday, hitting a near one-month low. Optimistic trade-related agreements boosted risk appetite and weakened the attractiveness of gold as a safe-haven asset. This week, the market will usher in a group meeting of major central bank governors around the world (Fed Chairman Powell, European Central Bank President Lagarde, Bank of England Governor Bailey, Bank of Japan Governor Kazuo Ueda, and Bank of Korea Governor Lee Chang-yong). The market will also usher in non-agricultural data. In addition, Powell's remarks on whether to resign may ignite the market this week. Gold prices may fluctuate more around the lower track of the Bollinger Band at $3,270/ounce this week.
Technical analysis:
Last Friday, the K-line had a lower shadow, and the Bollinger Band did not diverge. It is not easy to go short directly in operation, but wait for the rebound to confirm 3295 and the key resistance of ma5 to be short.
💰 Operation strategy: Rebound to 3280-3283 to go short, target 3270-3265, stop loss 3288-3290
If you are a beginner, I suggest you first understand what trading is.
Waiting for gold price to grow with ADP-NF⭐️GOLDEN INFORMATION:
Gold (XAU/USD) finds it difficult to extend its two-day rally and trades within a tight range during Wednesday’s Asian session, hovering just below Tuesday’s one-week high. A modest rebound in the US Dollar—recovering from its lowest level since February 2022—has put pressure on the precious metal. Additionally, improving market sentiment continues to reduce demand for safe-haven assets like Gold, further limiting its upside.
⭐️Personal comments NOVA:
Steady trendline recovery, sustained buying could move towards 3383 with today's ADP-NF data
⭐️SET UP GOLD PRICE:
🔥SELL GOLD zone: 3382- 3384 SL 3389
TP1: $3370
TP2: $3360
TP3: $3350
🔥BUY GOLD zone: $3312-$3310 SL $3305
TP1: $3320
TP2: $3330
TP3: $3340
⭐️Technical analysis:
Based on technical indicators EMA 34, EMA89 and support resistance areas to set up a reasonable BUY order.
⭐️NOTE:
Note: Nova wishes traders to manage their capital well
- take the number of lots that match your capital
- Takeprofit equal to 4-6% of capital account
- Stoplose equal to 2-3% of capital account
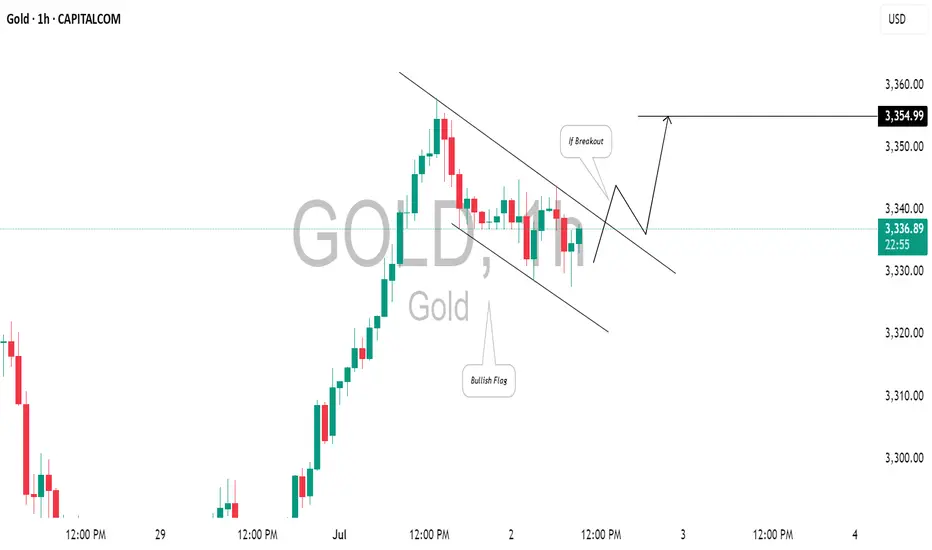
GOLD (XAUUSD): Classic Trend-Following Pattern⚠️Gold closed on Tuesday, forming a bullish flag pattern on an hourly chart, indicating a market correction following a strong upward wave.
A breakout above the resistance line with a candle close will likely signal a continuation of the trend, with a high probability of the price rising to at least a new higher high.
However, keep in mind that the price may respect the trend line multiple times and corrections could be prolonged, which is why we depend on a reliable breakout as a trigger.
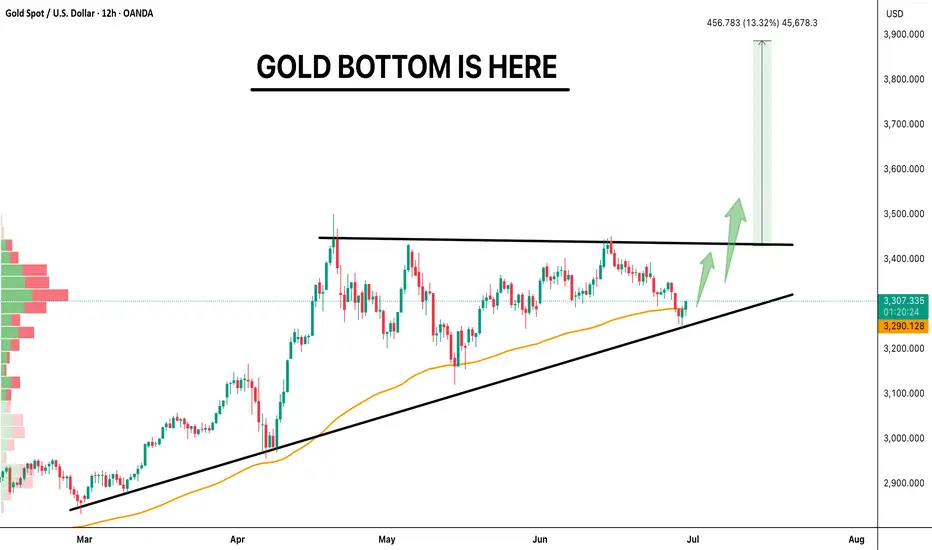
GOLD Bouncing from Trendline, Breakout Ahead?GOLD BOTTOM IS HERE 🔥
Gold has taken support from the rising trendline and is now close to breaking a key resistance. The chart is showing an ascending triangle, which usually means a big move is coming.
If price breaks above the resistance, we might see a strong rally of 13% or more.
The setup looks positive as long as the support stays strong.
Looks like Gold is ready to shine again!
Retweet if you're bullish.
Like and follow for more updates!
#GOLD TVC:XAU
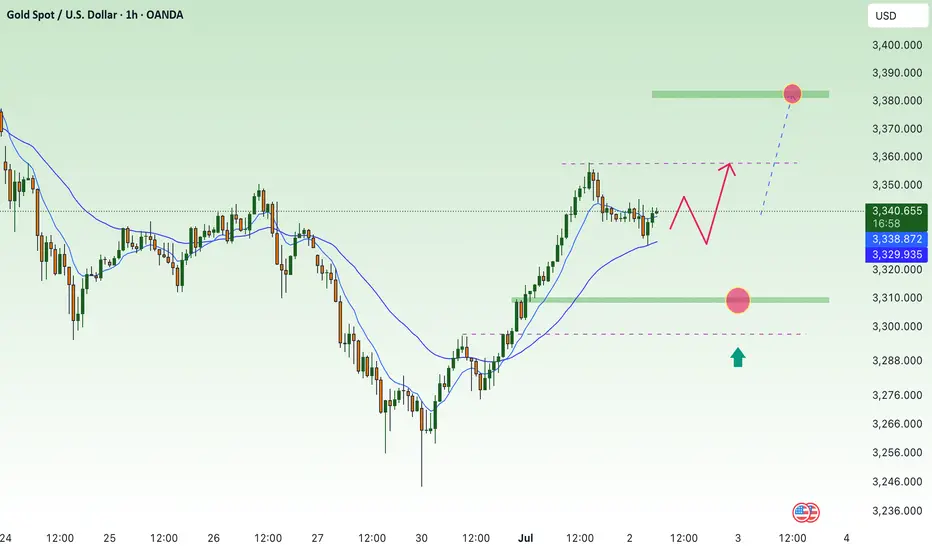
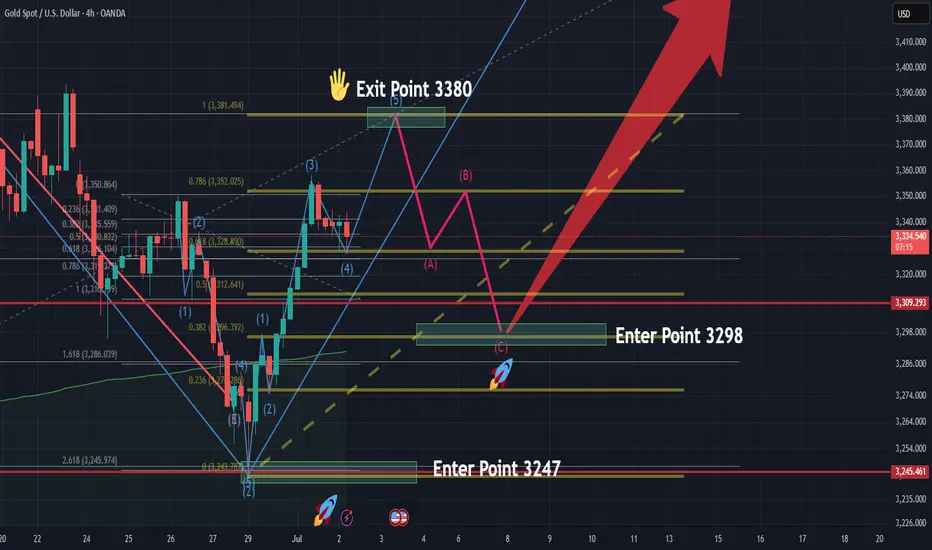
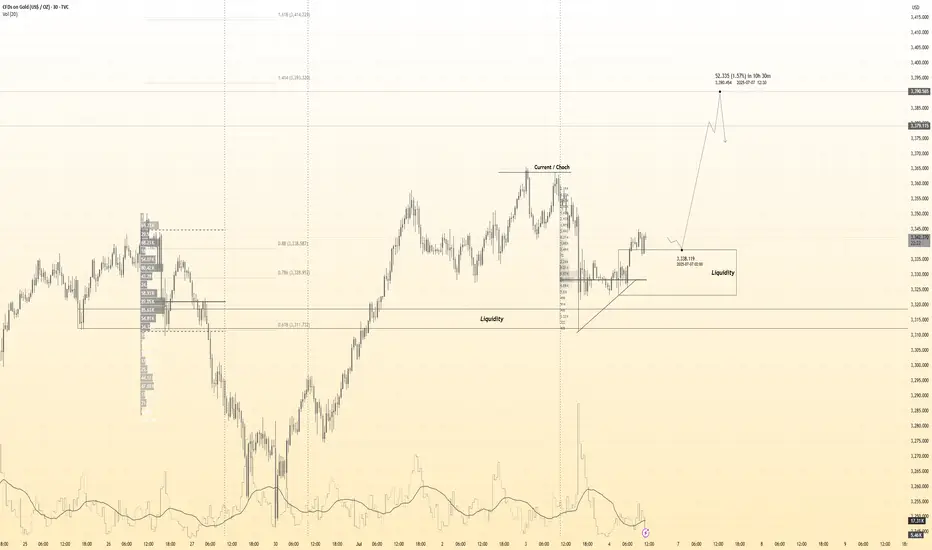
Riding Wave (5) Toward 3380 Before ABC Correction📌 Market Context
The current chart shows wave (5) of a larger impulsive structure is still in progress, with price rising from the bottom of wave (4). After a clean wave (1)-(2)-(3)-(4), the market is now pushing upward, targeting the 3380 zone as a likely wave (5) completion.
🟢 Entry Levels (End of Wave 2)
First Entry: 3298
Second Entry: 3279.6
The idea is clear, gold falls as expected!The gold market is just as I predicted. I have repeatedly warned everyone not to chase the 3350-3355 line. The technical side needs to step back. Now, it just proves the idea I gave. After gold hit the highest line of 3358, it stepped back to the 3337 line and started to fluctuate. Our 3355 short order plan successfully touched 3340 to stop profit and exit. From the current gold trend, it should fluctuate like this before closing. After the opening, we will step back and go long as planned. Focus on the 3330-3335 line below. If it does not break, we can consider going long.
From the current gold trend analysis, pay attention to the 3360-3370 line of pressure on the top, and the short-term support on the bottom is around 3330-3335. Focus on the key support at 3315-3325. Relying on this range as a whole, maintain the main tone of low-long participation unchanged, wait for the pullback to confirm the support and then intervene when the opportunity arises. In the middle position, keep watching and do less, chase orders cautiously, and wait for the entry opportunity after the key points are in place.
Gold operation suggestion: go long around 3315-3325, target 3340-3350.
Gold 30Min Engaged ( Bullish Entry Detected )➕ Objective: Precision Volume Execution
Time Frame: 30-Minute Warfare
Entry Protocol: Only after volume-verified breakout
🩸 Bullish Wave Coming From : 3338
➗ Hanzo Protocol: Volume-Tiered Entry Authority
➕ Zone Activated: Dynamic market pressure detected.
The level isn’t just price — it’s a memory of where they moved size.
Volume is rising beneath the surface — not noise, but preparation.
🔥 Tactical Note:
We wait for the energy signature — when volume betrays intention.
The trap gets set. The weak follow. We execute.
EURUSD 30Min Engaged ( Bullish Entry Detected )
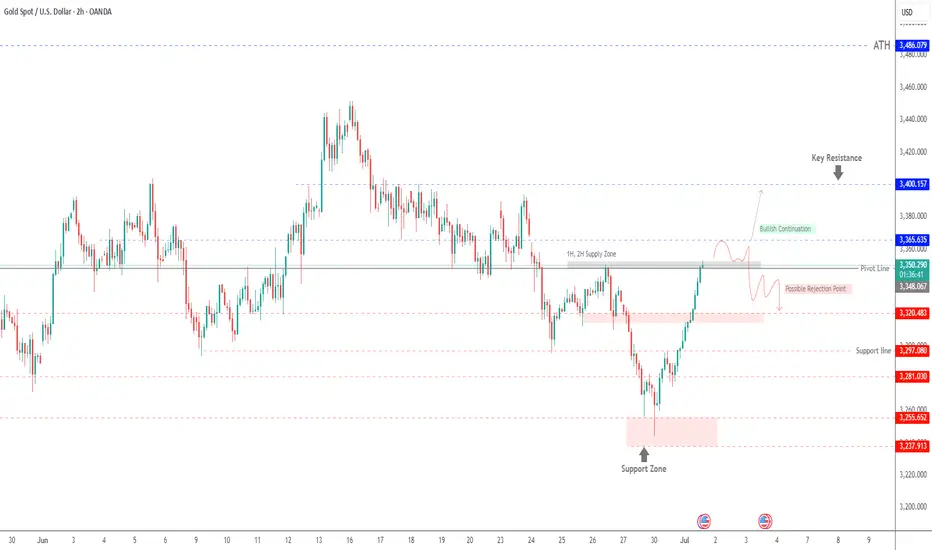
XAU/USD – Testing 2H/1H Supply Zone | Breakout or Rejection?XAU/USD – Testing 1H/2H Supply Zone | Bullish Continuation or Rejection Ahead
Gold has rallied strongly from the support zone around 3,238–3,255, breaking multiple intraday resistance levels and now approaching a critical 1H/2H Supply Zone near 3,348–3,366.
This area previously acted as a strong sell-off zone, making it a key decision point.
Scenario 1: Bullish Continuation
If price breaks and closes above 3,366 with momentum, we could see further upside toward the next resistance at 3,400 and possibly retest the ATH zone at 3,486. A short consolidation or retest within the zone would confirm strength.
Scenario 2: Rejection from Supply Zone
If the supply holds, a rejection from the zone could lead to a pullback toward:
3,320.48 (minor support)
3,297.08 (support line)
Or deeper retracement to the 3,255–3,238 support zone
Key Technical Levels
Supply Zone: 3,348 – 3,366
Resistance: 3,400 – 3,486 (ATH)
Support Levels: 3,320 – 3,297 – 3,255 – 3,238
Pivot Line: 3,348
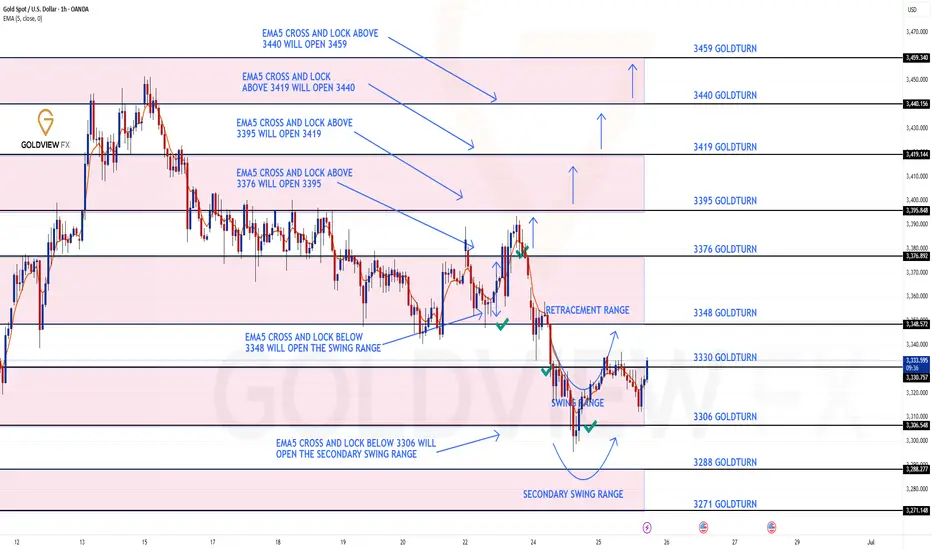
GOLD ROUTE MAP UPDATEHey Everyone,
Another smashing day on the charts with our levels being respected perfectly inline with our plans to buy dips.
After completing our bearish 3348 and bullish 3376 target we had the cross and lock above 3376 leaving a gap to 3395, which fell short just by few pips.
We then had the cross and lock below 3348 opening the swing range, which was also hit perfectly. We got the perfect bounce, just like we analysed allowing us to buy dips and now seeing the swing range carry out the move. We will see if this is completed for the full swing range 3348.
We will keep the above in mind when taking buys from dips. Our updated levels and weighted levels will allow us to track the movement down and then catch bounces up.
We will continue to buy dips using our support levels taking 20 to 40 pips. As stated before each of our level structures give 20 to 40 pip bounces, which is enough for a nice entry and exit. If you back test the levels we shared every week for the past 24 months, you can see how effectively they were used to trade with or against short/mid term swings and trends.
The swing range give bigger bounces then our weighted levels that's the difference between weighted levels and swing ranges.
BULLISH TARGET
3376 - DONE
EMA5 CROSS AND LOCK ABOVE 3376 WILL OPEN THE FOLLOWING BULLISH TARGETS
3395
EMA5 CROSS AND LOCK ABOVE 3395 WILL OPEN THE FOLLOWING BULLISH TARGET
3419
EMA5 CROSS AND LOCK ABOVE 3419 WILL OPEN THE FOLLOWING BULLISH TARGET
3440
BEARISH TARGETS
3348 - DONE
EMA5 CROSS AND LOCK BELOW 3348 WILL OPEN THE SWING RANGE
3330 - DONE
3306 - DONE
EMA5 CROSS AND LOCK BELOW 3306 WILL OPEN THE SECONDARY SWING RANGE
3288
3271
As always, we will keep you all updated with regular updates throughout the week and how we manage the active ideas and setups. Thank you all for your likes, comments and follows, we really appreciate it!
Mr Gold
GoldViewFX
Next Week Aims for 3300 Break💎 Last week, gold opened gap-up on Monday 🔼 but then trended lower 🔽. However, the 3290-3300 support zone remained robust from Mon-Thu ⚡. It plunged to ~3255 on Fri before rebounding 🌱. Next week's open may surge to 3290-3300 🔥!
🚀 Sell@3260 - 3270
🚀 TP 3280 - 3290 -3300
Accurate signals are updated every day 📈 If you encounter any problems during trading, these signals can serve as your reliable guide 🧭 Feel free to refer to them! I sincerely hope they'll be of great help to you 🌟 👇
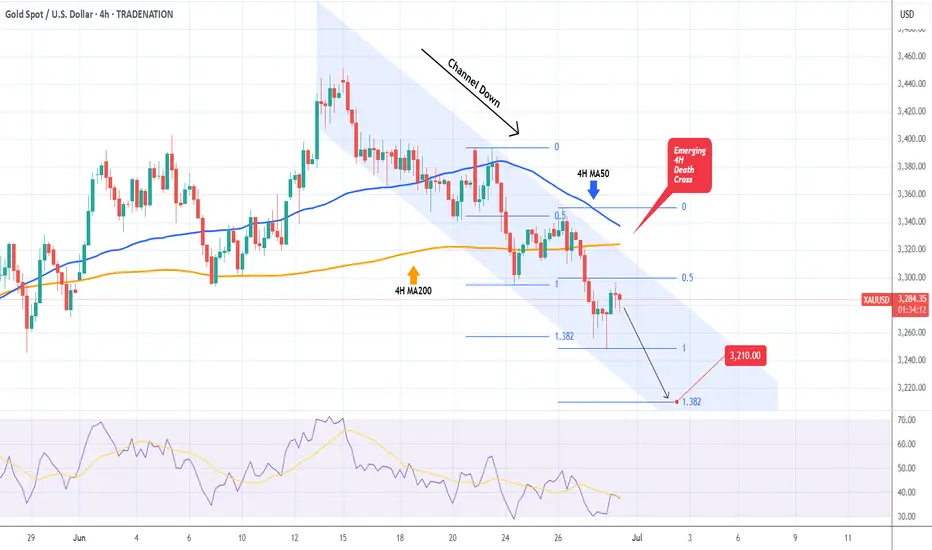
XAUUSD Channel Down starting new Bearish Leg.Gold (XAUUSD) has been trading within a 2-week Channel Down, recently rejected on its 4H MA50 (blue trend-line). The last Lower High was priced on the 0.5 Fibonacci retracement level, so currently we are on the ideal level for a new short.
With a 4H Death Cross emerging, we are targeting the 1.382 Fibonacci extension (as the previous Bearish Leg did) at 3210 for the Channel's new Lower Low.
-------------------------------------------------------------------------------
** Please LIKE 👍, FOLLOW ✅, SHARE 🙌 and COMMENT ✍ if you enjoy this idea! Also share your ideas and charts in the comments section below! This is best way to keep it relevant, support us, keep the content here free and allow the idea to reach as many people as possible. **
-------------------------------------------------------------------------------
Disclosure: I am part of Trade Nation's Influencer program and receive a monthly fee for using their TradingView charts in my analysis.
💸💸💸💸💸💸
👇 👇 👇 👇 👇 👇