Down the road - Gold Outlook June 30 - July 24, 2025FX_IDC:XAUUSD
📰 The past weeks has been a wild ride for gold prices, caught between the fiery conflict in the Middle East and a deluge of crucial economic data from the U.S. 📈 Adding to this, a detailed technical analysis provides a deeper look into gold's immediate future.
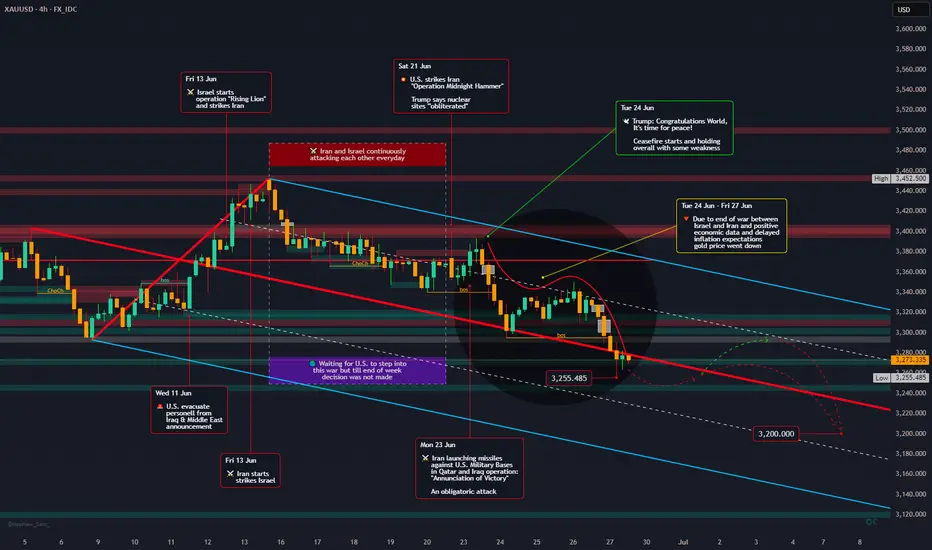
**Geopolitical Drama Unfolds & Peace Prevails!** 🕊️ ceasefire negotiations.
Initially, gold was shrouded in uncertainty 🌫️ due to the Iran-Israel war, with markets bracing for potential U.S. involvement and a full-blown escalation. Daily tit-for-tat attacks between Iran and Israel kept everyone on edge, and the question of U.S. intervention remained a nail-biter 😬, though President Trump did announce a 14-day "timeout".
Then came the dramatic twist on June 21st: "Operation Midnighthammer" saw the U.S. unleash bunker-buster bombs on Iranian uranium enrichment facilities. 💥 Short time later, the U.S. declared mission accomplished, stating their goal of destroying these sites was achieved, and no further attacks would follow.
Iran's response, "Operation Annunciation of Victory," on the following Monday, involved missile strikes on U.S. military bases in Qatar and Iraq. 🚀 Interestingly, these attacks were pre-announced, allowing for safe evacuations and thankfully, no casualties. 🙏
The biggest surprise came from President Trump as he declared, "Congratulations world, it's time for peace!" 🎉 He then brokered a ceasefire between Israel and Iran, which, despite being fragile, largely held, leading to the war's end.🤝 Both nations, as expected, officially claimed victory – a common move to satisfy their citizens. 🏅
Personally, I was genuinely surprised that the U.S.President mediated ceasefire, actually brought the conflict to a close – but it's a welcome outcome! 🙏
**Economic Data & Fed's Steady Hand** 💹🏛️
The cessation of hostilities triggered a steady downward slide in gold prices from June 24th to 27th. ⬇️ This dip initially met some market resistance but it ultimately prevailed, especially with the release of mixed U.S. economic data, which, despite being varied, was generally interpreted positively by the market.
The spotlight also shone on the Federal Reserve, with several representatives speaking and Fed Chair Jerome Powell undergoing a two-day Senate hearing. 🎤👨⚖️ Powell meticulously explained the Fed's rationale for holding interest rates steady, despite market pressures. 🤷 However, recent whispers suggest the Federal Reserve might actually cut rates in September! 😮
## Geopolitical News Landscape 🌍📰
India / Pakistan
Pakistan rejected claims that it supported militant groups active in Indian Kashmir. India issued a formal protest but reported no fresh border clashes during the week.
Outlook 🔮: De-escalation is possible in the short term. However, unresolved disputes over water rights (Indus Treaty) could reignite tensions.
Gaza Conflict
Heavy Israeli airstrikes killed dozens in Gaza, including civilians near aid centers. The UN warned that U.S.-backed aid systems are failing. Humanitarian corridors remain blocked.
Outlook 🔮: Ceasefire talks may resume in July, but success depends on international pressure and safe humanitarian access.
Russia / Ukraine
Russia advanced 36 sq mi in eastern Ukraine, deploying outdated T-62 tanks. Ukraine reinforced defensive lines, aided by Western military packages.
Outlook 🔮: The front remains volatile. Sustained Western support will be key to halting further Russian gains.
U.S. – China Trade War
A breakthrough deal was signed for China to fast-track rare-earth exports to the U.S. Talks on tech transfer and tariffs continue behind closed doors.
Outlook 🔮: A phased de-escalation is possible, but deep trust issues linger, especially over semiconductors and AI.
🌐 Global Trade War
Several countries, including Brazil and Thailand, imposed fresh restrictions on Chinese imports, echoing the U.S. stance. Global supply chains remain fragmented.
Outlook 🔮: Trade blocs like the EU and Mercosur may take on greater importance as countries hedge against rising protectionism.
Trump vs. Powell
Fed Chair Powell resisted political pressure, stating rate cuts are unlikely before September. Trump called him “stubborn” and demanded immediate easing.
Outlook 🔮: The Fed’s independence is under strain. If Trump wins re-election, major policy shifts could follow.
📈 U.S. Inflation
Despite tariffs, core inflation remains elevated. Powell warned of persistent price pressures. Trump insists the Fed should cut rates to boost growth.
Outlook 🔮: A rate cut later in 2025 is possible—if labor market data weakens. Until then, inflation will remain politically explosive.
## Technical View 📐📈
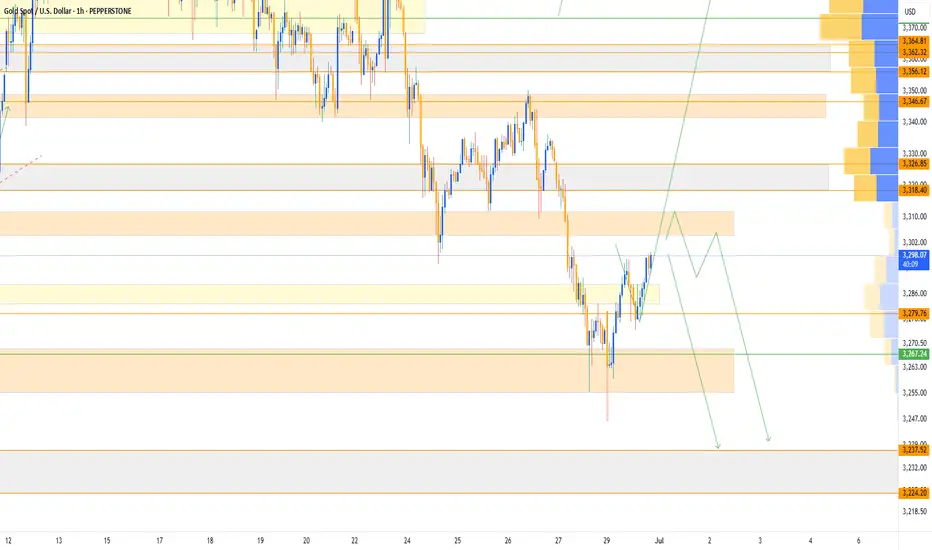
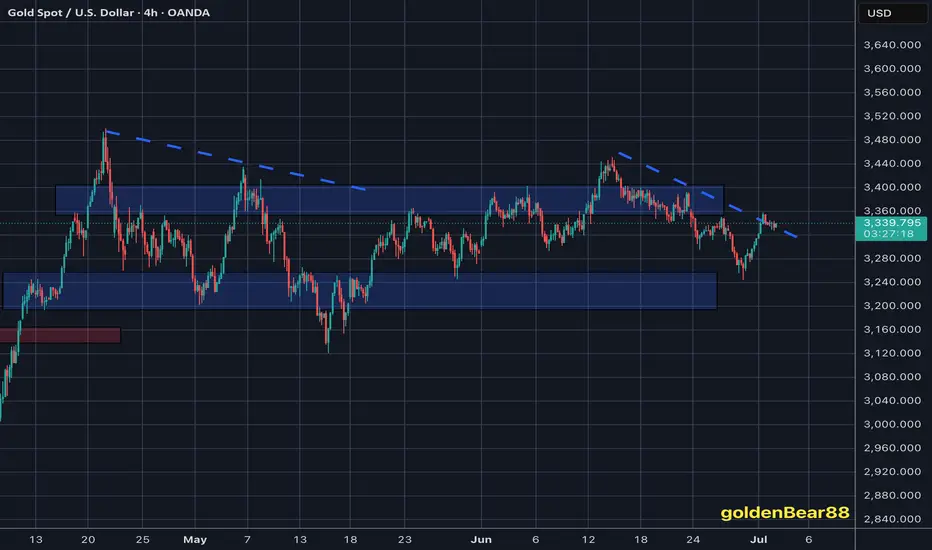
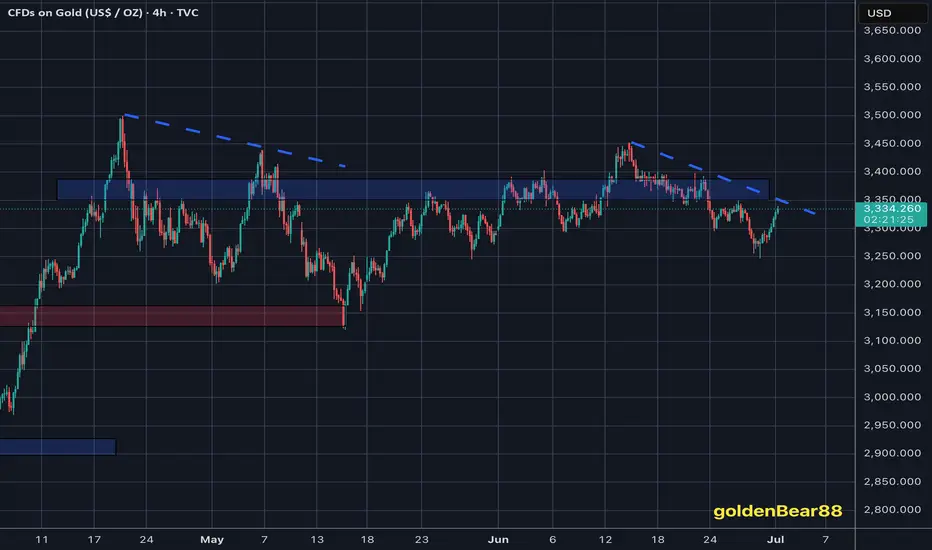
**Current Market Context:** Gold plummeted to $3,273.67 USD/t.oz on June 27, 2025, marking a 1.65% drop from the previous day, which confirms the strong bearish momentum. The price action shows a significant retreat from recent highs around $3,400.
**ICT (Inner Circle Trader) Methodology Analysis:**
* **Market Structure:**
The trend is clearly bearish, with a definitive break of structure (BOS) to the downside.
* **Order Blocks:**
Several bearish order blocks have been identified at prior resistance levels, specifically in the $3,380-$3,400 range.
* **Fair Value Gaps (FVG):**
The aggressive sell-off has created multiple imbalances, particularly in the $3,350-$3,320 range.
* **Liquidity Pools:**
Buy-side liquidity above $3,400 has been swept. Sell-side liquidity is now accumulating below the $3,270 lows, which is the current target zone.
* **Session Analysis:**
The London session showed aggressive selling, followed by a continuation of bearish momentum in the New York session. The Asia session could see consolidation or further declines.
* **Smart Money Concepts:**
Heavy selling pressure suggests "smart money" distribution. There's been strong bearish displacement from $3,380 down to $3,270, indicating the market is currently in a "sell program" phase.
**Gann Analysis:**
* **Gann Angles & Time Cycles:**
The primary 1x1 Gann angle has been broken, pointing to continued weakness. Key price squares indicate resistance at $3,375 (25²) and support at $3,249 (57²). Daily cycles suggest a potential turning point around June 30-July 1, while weekly cycles indicate continued pressure through early July.
* **Gann Levels:**
* Resistance: $3,375, $3,400, $3,481 (59²)
* Support: $3,249, $3,136, $3,025
**Fibonacci Analysis:**
* **Key Retracement Levels (from recent swing high to low):**
* 78.6%: $3,378 (Strong resistance)
* 61.8%: $3,348 (Key resistance zone)
* 50.0%: $3,325 (Psychological level)
* 38.2%: $3,302 (Minor resistance)
* 23.6%: $3,285 (Current area of interest)
* **Fibonacci Extensions (Downside Targets):**
* 127.2%: $3,245
* 161.8%: $3,195
* 261.8%: $3,095
* **Time-Based Fibonacci:**
The next significant time cluster is July 2-3, 2025, with a major cycle completion expected around July 15-17, 2025.
**Institutional Levels & Volume Analysis:**
* **Key Institutional Levels:**
* Major Resistance: $3,400 (psychological + institutional)
* Secondary Resistance: $3,350-$3,375 (order block cluster)
* Primary Support: $3,250-$3,270 (institutional accumulation zone)
* Major Support: $3,200 (monthly pivot area)
* **Volume Profile Analysis:**
* High Volume Node (HVN): $3,320-$3,340 (fair value area)
* Low Volume Node (LVN): $3,280-$3,300 (potential acceleration zone)
* Point of Control (POC): Currently around $3,330
**Central Bank & Hedge Fund Levels:**
Based on recent COT data and institutional positioning, heavy resistance is seen at $3,400-$3,430, where institutions likely distributed. An accumulation zone for "smart money" re-entry is anticipated at $3,200-$3,250.
**Cycle Timing Analysis:**
* **Short-Term Cycles (Intraday):**
Bearish momentum is expected to continue for another 12-18 hours. A daily cycle low is likely between June 29-30, with a potential reversal zone on July 1-2 for the 3-day cycle.
* **Medium-Term Cycles:**
The current weekly cycle is in week 3 of a 4-week decline. The monthly cycle indicates a mid-cycle correction within a larger uptrend. For the quarterly cycle, Q3 2025 could see a major low formation.
* **Seasonal Patterns:**
July-August is typically a weaker period for gold ("Summer Doldrums"). September has historically been strong for precious metals ("September Effect"), setting up for a potential major move higher in Q4 2025 ("Year-End Rally").
**Trading Strategy & Levels:**
* **Bearish Scenario (Primary):**
* Entry: Sell rallies into the $3,320-$3,350 resistance zone.
* Targets: $3,250, $3,200, $3,150.
* Stop Loss: Above $3,380.
* **Bullish Scenario (Secondary):**
* Entry: Buy support at $3,250-$3,270 with confirmation.
* Targets: $3,320, $3,375, $3,400.
* Stop Loss: Below $3,230.
**Key Events to Watch:**
* **US PCE Data:**
Fresh downside risks could emerge ahead of the US Personal Consumption Expenditures (PCE) Price Index data release.
* **Fed Communications:**
Any hawkish rhetoric from the Federal Reserve could further pressure gold.
* **Geopolitical Developments:**
Ongoing global events could trigger safe-haven demand.
**Conclusion:**
The technical picture for gold suggests continued short-term weakness, with the metal testing its 2025 trend line at $3,290 following last week's rejection at the $3,430 resistance. However, the longer-term outlook remains constructive, given gold's robust performance year-to-date. Key support at $3,250-$3,270 will be crucial in determining the next significant price movement.
**Upcoming Week's Economic Calendar (June 29 - July 4, 2025):** 🗓️🌍
🗓️ Get ready for these important economic events (EDT)
* ** Sunday , June 29, 2025**
* 21:30 CNY: Manufacturing PMI (Jun) - Forecast: 49.6, Previous: 49.5
* ** Monday , June 30, 2025**
* 09:45 USD: Chicago PMI (Jun) - Forecast: 42.7, Previous: 40.5
* ** Tuesday , July 1, 2025**
* 05:00 EUR: CPI (YoY) (Jun) - Forecast: 2.0%, Previous: 1.9%
* 09:30 USD: Fed Chair Powell Speaks
* 09:45 USD: S&P Global Manufacturing PMI (Jun) - Forecast: 52.0, Previous: 52.0
* 10:00 USD: ISM Manufacturing PMI (Jun) - Forecast: 48.8, Previous: 48.5
* 10:00 USD: ISM Manufacturing Prices (Jun) - Forecast: 70.2, Previous: 69.4
* 10:00 USD: JOLTS Job Openings (May) - Forecast: 7.450M, Previous: 7.391M
* ** Wednesday , July 2, 2025**
* 08:15 USD: ADP Nonfarm Employment Change (Jun) - Forecast: 80K, Previous: 37K
* 10:30 USD: Crude Oil Inventories - Forecast: -5.836M
* ** Thursday , July 3, 2025**
* Holiday: United States - Independence Day (Early close at 13:00) 🇺🇸⏰
* 08:30 USD: Average Hourly Earnings (MoM) (Jun) - Forecast: 0.3%, Previous: 0.4%
* 08:30 USD: Initial Jobless Claims - Forecast: 239K, Previous: 236K
* 08:30 USD: Nonfarm Payrolls (Jun) - Forecast: 129K, Previous: 139K
* 08:30 USD: Unemployment Rate (Jun) - Forecast: 4.2%, Previous: 4.2%
* 09:45 USD: S&P Global Services PMI (Jun) - Forecast: 53.1, Previous: 53.1
* 10:00 USD: ISM Non-Manufacturing PMI (Jun) - Forecast: 50.3, Previous: 49.9
* 10:00 USD: ISM Non-Manufacturing Prices (Jun) - Forecast: 68.7
* ** Friday , July 4, 2025**
* All Day: Holiday - United States - Independence Day 🎆
**Gold Price Forecast for the Coming Week** 🔮💰
Given last week's market movements, there's a strong likelihood that the downward trend in gold prices will continue.🔽 However, fresh news can always flip the script! 🔄 As of now, I expect gold to dip further to $3255 by mid-next week. Yet, a brief rebound towards $3300 isn't out of the question before a potential drop to $3200 by week's end or early the following week. 🤞
Please take the time to let me know what you think about this. 💬
-------------------------------------------------------------------------
This is just my personal market idea and not financial advice! 📢 Trading gold and other financial instruments carries risks – only invest what you can afford to lose. Always do your own analysis, use solid risk management, and trade responsibly.
Good luck and safe trading! 🚀📊
XAUUSDK trade ideas
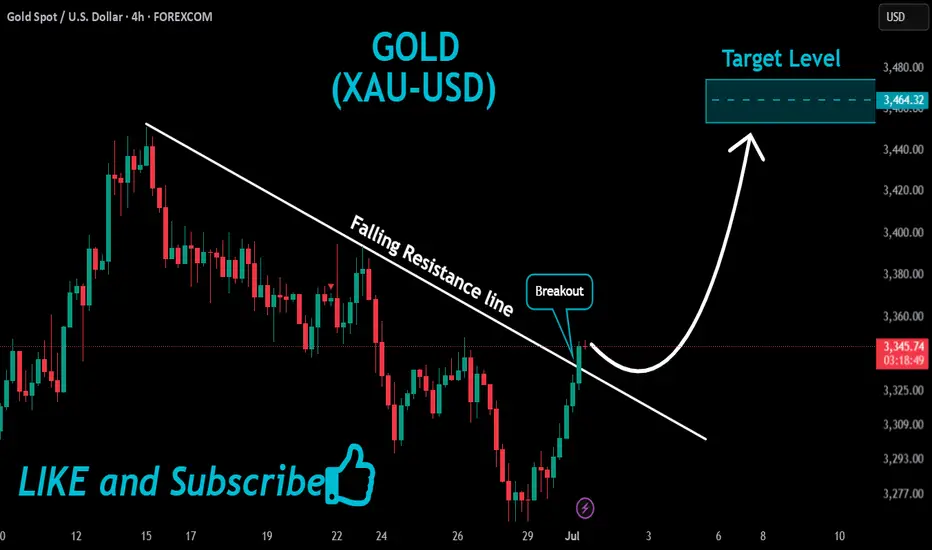
GOLD Massive Bullish Breakout!
HI,Traders !
#GOLD is trading in a strong
Uptrend and the price just
Made a massive bullish
Breakout of the falling
Resistance line and the
Breakout is confirmed
So after a potential pullback
We will be expecting a
Further bullish continuation !
Comment and subscribe to help us grow !
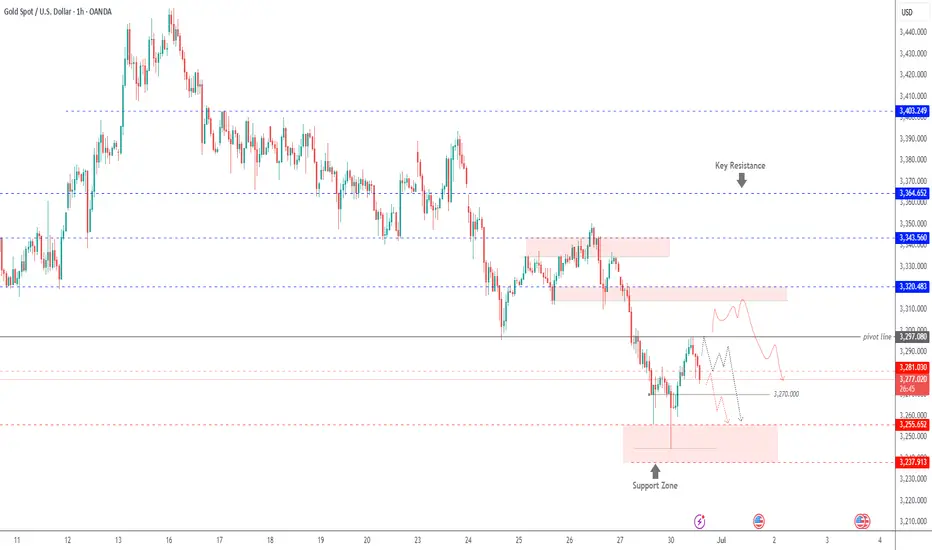
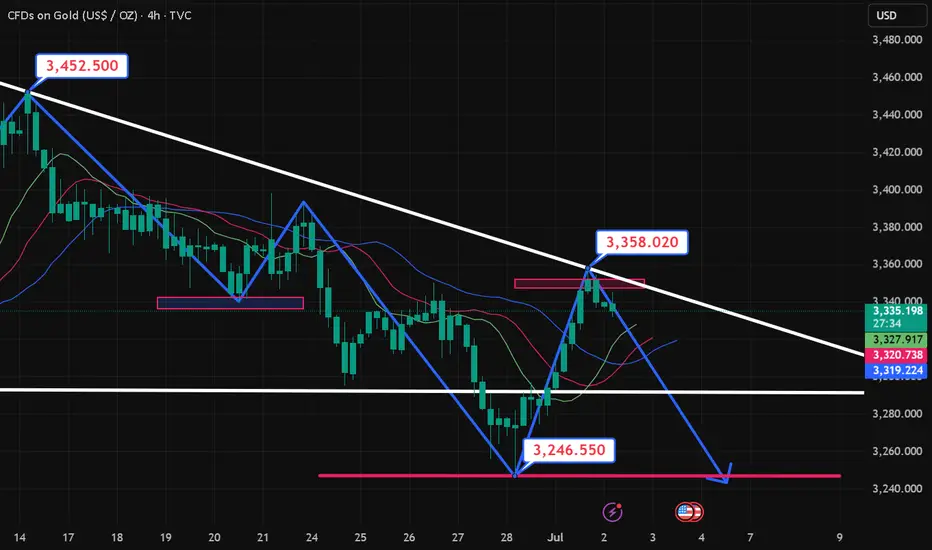
GOLD MARKET ANALYSIS AND COMMENTARY - [Jun 30 - Jul 04]Last week, OANDA:XAUUSD fell sharply from an opening price of $3,392/oz to a low of $3,255/oz and closed at $3,274/oz. The reason was that Israel and Iran had officially ceased fire, although negotiations with the US remained difficult. In addition, FED Chairman Jerome Powell reaffirmed that there was no rush to cut interest rates due to high inflation risks. In addition, summer is a period of weak demand for physical gold, continuing to put pressure on gold prices.
In addition, summer is typically the low season for physical gold demand, which could continue to weigh on gold prices.
In addition to the seasonal lull in trading that has affected the gold market, improving economic sentiment as the Trump administration has said there is progress in trade agreements, especially the framework agreement on trade with China, will also continue to negatively impact gold prices next week.
Thus, gold prices next week may continue to be under downward pressure, but the decline may not be too large as gold prices next week are still supported by some fundamental factors.
This week, the US will release the non-farm payrolls (NFP) report and the unemployment rate for June. According to forecasts, NFP may reach 120,000 jobs. If NFP increases higher than expected, the FED will continue to delay cutting interest rates, negatively affecting gold prices next week. On the contrary, if NFP drops sharply below 100,000 jobs, it will increase the possibility of the FED cutting interest rates, helping gold prices rise again next week, but not too strongly.
📌Technically, the gold price closed below $3,300/oz this week, which could pave the way for a drop to $3,200/oz next week, or below that to $3,120/oz. If the gold price rebounds above $3,300/oz next week, it could trigger a recovery to $3,330-$3,360/oz.
Notable technical levels are listed below.
Support: 3,246 – 3,228USD
Resistance: 3,292 – 3,300USD
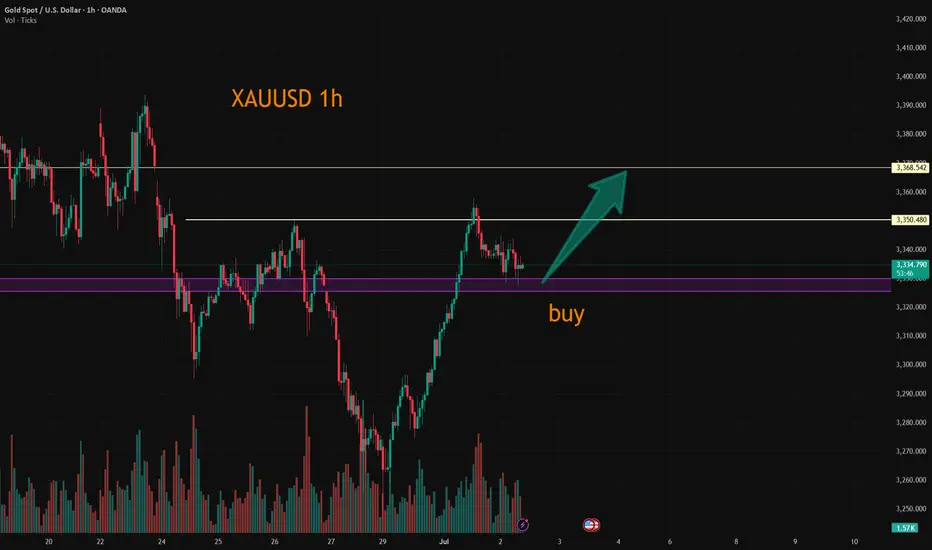
SELL XAUUSD PRICE 3367 - 3365⚡️
↠↠ Stop Loss 3371
BUY XAUUSD PRICE 3178 - 3180⚡️
↠↠ Stop Loss 3174
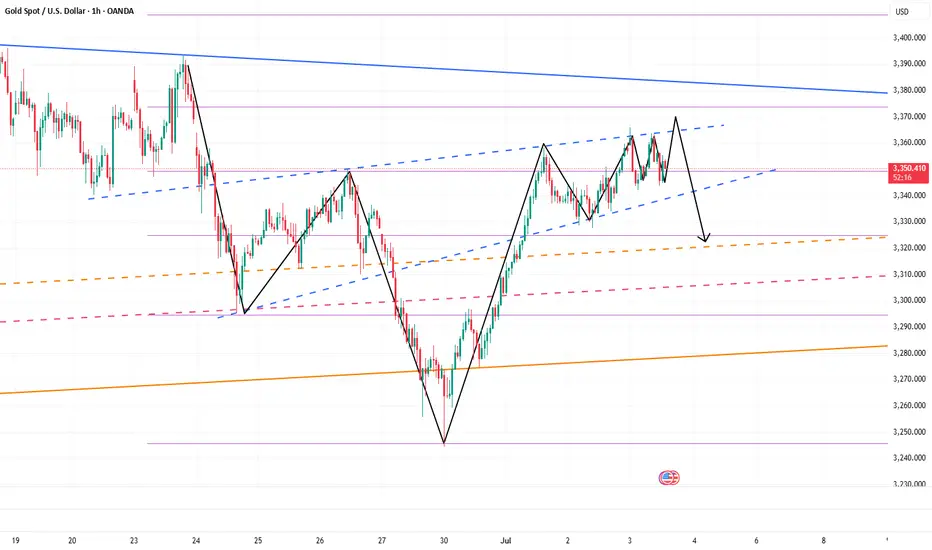
Gold 1H Intra-Day Chart 39.06.2025Option 1: Gold rejects from CMP or from $3,346 & drops towards $3,240.
Option 2: Gold keeps moving higher into another strong demand zone of $3,416.
Which scenario do you find more likely?
GOLD | Pressure Below Pivot – Eyes on 3255 and 3238GOLD | Market Outlook
The overall momentum remains bearish as long as the price trades below the pivot line at 3297.
Currently, the price is attempting to stabilize below 3281, suggesting a potential continuation of the downtrend toward 3270 and 3255.
A confirmed 1H close below 3255 would further strengthen the bearish scenario, opening the way toward 3238.
Sell Setup:
Valid if 1H candle closes below 3281→ Targets: 3270 and 3255
Buy Setup:
Valid if 1H candle closes above 3297→ Targets: 3314
Key Levels:
• Pivot: 3281
• Support: 3255 / 3238
• Resistance: 3297 / 3314
GOLD Support Ahead
HI,Traders !
#GOLD is going down
Now but the pair will soon
Hit a horizontal support
Of 3241.70 from where
We will be expecting a
Local bullish rebound !
Comment and subscribe to help us grow !
Excellent start of E.U. sessionAs discussed throughout my yesterday's session commentary: "My position: I am Highly satisfied with my Profit and will take early weekend break, not catching a Falling knife."
I have monitored the Price-action from sidelines throughout Friday's session as explained above however mid E.U. session I have engaged two #100 Lot Buying orders on #3,278.80 few moments ago and closed both of my Scalps on #3,285.80 with excellent Profit.
Quick update: No Swing orders today, only aggressive Scalps similar to Scalp orders I mentioned above from my key re-Buy points. If #3,300.80 is recovered, newly formed Bullish structure will push for #3,313.80 and #3,327.80 test. If #3,300.80 benchmark is preserved, I will still keep Buying (Scalp only however). I will have Gold's major move revealed after today's session.
Excellent opportunities on GoldAs discussed throughout my yesterday's session commentary: "My position: I have engaged #4 Scalp orders throughout yesterday's session (all in Profit) and will continue to do so however on the other side (Buying) from my key entry points. Keep in mind that overall trend remains Bullish and Trade accordingly."
As I expected upside extension as per above, I have waited for #3,352.80 - #3,357.80 my local Top's for the sequence and started aggressively Selling Gold from #3,348.80 first, then #3,352.80 #4 aggressive Selling Scalps and #3,357.80 final two Scalps which I held all the way towards #3,345.80 Support for the fractal (cca #130k Profits Intra-day).
My position: Since #3,337.80 was neckline for upside Bull structure, I was aware if it gets invalidated to the downside, it will open doors for #3,327.80 extension (which held twice throughout late U.S. and Asian session). I don't expect much Selling action today however Bulls need another Fundamental push to invalidate wall of Resistances at #3,340's and #3,350's. I will continue Scalping as opportunity arise / no Swing orders.
Gold on relief rallyAs discussed throughout my yesterday's session commentary: Quick update: No Swing orders today, only aggressive Scalps similar to Scalp orders I mentioned above from my key re-Buy points. If #3,300.80 is recovered, newly formed Bullish structure will push for #3,313.80 and #3,327.80 test. If #3,300.80 benchmark is preserved, I will still keep Buying (Scalp only however). I will have Gold's major move revealed after today's session."
Technical analysis: I have been aware that another failed attempt to invalidate #3,272.80 - #3,278.80 local Support zone will most likely result into firm rejection and yet another push towards #3,302.80 psychological benchmark and ultimately the #3,327.80 level which represents Short-term Resistance line which is now invalidated to the upside (as discussed above already). Keep in mind that the current Bullish Short-term set-up can offer a great opportunity for those who missed the last rally to enter at almost (# +1.00%) of the Price so many Sellers which were liquidated will now engage multiple Buying orders so Buying pressure will be significantly Higher. Gold is extending the Trade nicely inside the healthy Hourly 4 chart's Ascending Channel and after failed Support zone reversal. Price-action has even more probabilities now to test #3,352.80 psychological benchmark. Gold is Fundamentally Bullish as well due Tariffs announcement.
My position: I have engaged #4 Scalp orders throughout yesterday's session (all in Profit) and will continue to do so however on the other side (Buying) from my key entry points. Keep in mind that overall trend remains Bullish and Trade accordingly.
GOLD, back at higher base. BUY at 3250 enroute to ath 3500 / 4k.GOLD had a wonderful run this past few seasons grinding up a series of ATH taps every higher baselines since 1500.
After goin to a new parabolic highs of 3500 ATH, GOLD did hibernate a bit and got trimmed back to 3240 levels -- a precise 61.8 FIB tap. This is where most buyers converge, and position themselves on the next run up.
The next ascend series will be far more generous eyeing new higher numbers never before seen. Ideal seeding zone is at the current price range of 3250.
Current higher lows on momentum metrics has been spotted conveying intense upside pressure as it moves forward.
Spotted at 3250
Interim target at 3500 ATH
Long term: 4000
TAYOR.
Trade safely. Market will be market.
Not financial advice.
Revealed: Beware of a strong counterattack from gold bears!Perhaps due to the impact of the NFP market later, gold fluctuated relatively cautiously today, and neither the long nor the short side showed signs of breakthrough, and the overall trend remained volatile. However, as gold rebounded, the market bullish sentiment gradually tended to be optimistic. In the short term, the lower support area was relatively obvious, that is, the second pull-up point 3335-3325 area, followed by 3315-3305 area;
However, as gold rebounded twice and fell after touching 3365, the suppression above was also obvious. In the short term, it faced the suppression of 3375-3385 resistance. If gold cannot effectively break through this area, gold bears may make a stronger counterattack, so I don’t think gold bears have no chance at all.
Therefore, I think there is still a good profit opportunity to try to touch the top and short gold. You can consider trying to short gold in the 3365-3375-3385 area and look at the target: 3340-3330-3320.
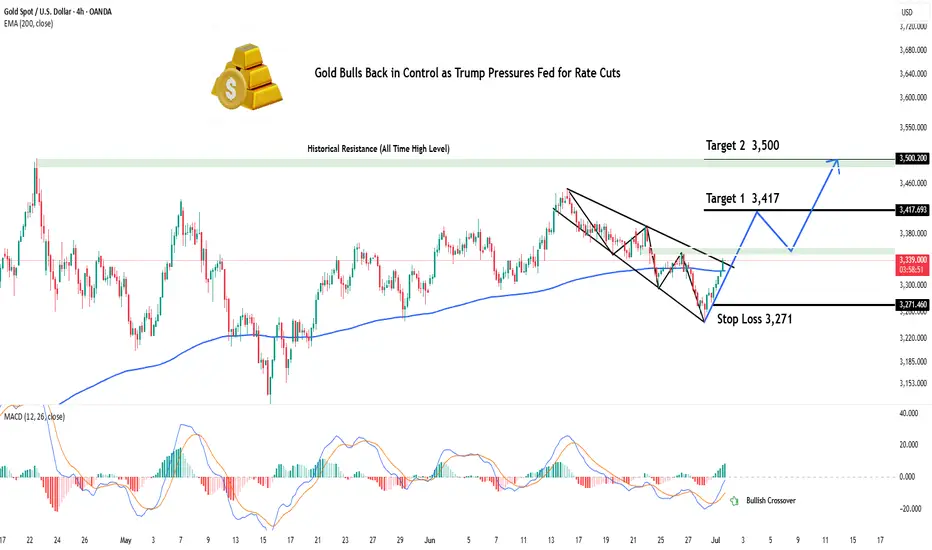
Gold Bulls Back in Control as Trump Pressures Fed for Rate CutsHey Realistic Traders!
President Trump is ramping up pressure on the Fed to cut interest rates , saying the U.S. is falling behind countries with looser policies. As several Fed officials begin to shift their stance, expectations for rate cuts are growing. That’s putting pressure on the dollar and giving gold a fresh boost.
We’ll take a closer look at what this means for OANDA:XAUUSD (Gold) through technical analysis and explore its upside potential.
Technical Analysis
On the 4-hour chart, Gold has moved above the EMA-200, signaling a shift in momentum to the upside. Price has also broken out of a Descending Broadening Wedge (DBW) pattern, which often indicates the start of a bullish trend.
The breakout was confirmed by a Bullish Marubozu candle, reflecting strong buying pressure. To add further confirmation, the MACD has formed a bullish crossover, reinforcing the upward momentum.
Looking ahead, the first target is seen at 3417. If reached, a minor pullback toward the historical resistance zone (green area) may occur, with a potential continuation toward the second target at 3500.
This bullish outlook remains valid as long as the price stays above the stop-loss level at 3271 . A break below this level would invalidate the setup and shift the outlook back to neutral.
Support the channel by engaging with the content, using the rocket button, and sharing your opinions in the comments below.
Disclaimer: "Please note that this analysis is solely for educational purposes and should not be considered a recommendation to take a long or short position on XAUUSD.
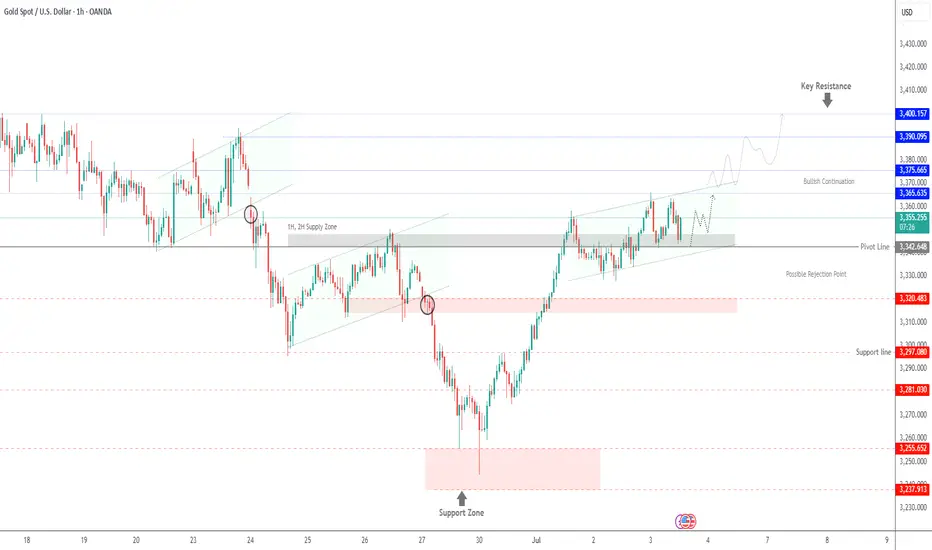
Gold Holds Above 3342 Ahead of Key U.S Data –Bullish Bias IntactGold Rises as Market Awaits Key U.S. Economic Data
Gold prices are pushing higher as investors position ahead of today’s major U.S. economic releases, including NFP and unemployment figures. Expectations of weaker data are supporting bullish sentiment.
Technical Outlook (XAU/USD):
Gold maintains a bullish structure as long as it trades above 3,342.
→ A push toward 3,365 is likely
→ A 1H close above 3,365 would open the path toward 3,375
However, if price closes below 3,342 on the 1H chart, bearish momentum may build, targeting 3,331 and 3,320
Key Levels:
• Resistance: 3,365 / 3,375 / 3,390
• Support: 3,341 / 3,331 / 3,320
June Nonfarm Data: Gold PlungesThe US June nonfarm payrolls data is out: 147,000 jobs were added, exceeding the expected 106,000 and the previous 139,000, with slight upward revisions to the prior two months’ figures. The unemployment rate dipped from 4.2% to 4.1%, beating the forecast of 4.3%. While the US economy slows, the job market remains robust. 🌟
Post-data release, market bets on a July rate cut have evaporated, with the probability of a September cut dropping to around 75%. US stock futures extended gains, Treasury yields rose across the board, the US Dollar Index surged, and gold plunged nearly $40 in a short squeeze—signaling an unexpected major bearish hit to gold. Weng Fuhao advises trading with the trend, focusing on shorting on rebounds. 😲
Gold, jolted by the nonfarm data, slid sharply in the short term before a minor rebound, with bearish signals across all timeframes. The data triggered an immediate breakdown, shifting the short-term trend to downward: on the 3-hour chart, moving averages formed a death cross, MACD showed a death cross with expanding volume, and gold prices fell below the Bollinger Band lower track, confirming a clear bearish momentum. 📉
🚀 Sell@3355 - 3345
🚀 TP 3335 - 3325 - 3315
Accurate signals are updated every day 📈 If you encounter any problems during trading, these signals can serve as your reliable guide 🧭 Feel free to refer to them! I sincerely hope they'll be of great help to you 🌟 👇
7.2 Gold price continues to fluctuate! Non-agricultural positionGold is still temporarily maintaining a wide range of fluctuations in the daily trend, and the price is temporarily under pressure around 3360. In the 4-hour level trend, after continuous high-level narrow fluctuations, the technical pattern has begun to weaken. The short-term moving average has gradually flattened from the previous upward divergence. After the continuous small-scale high-rise and fall back, the upward momentum in the short-term trend is insufficient. In the hourly level trend, the current running space is very compressed, but in the small-level cycle trend, after continuous fluctuations, the technical pattern has begun to weaken. The price has begun to slowly move out of the narrow range of fluctuations. Pay attention to the short-term adjustment and repair.
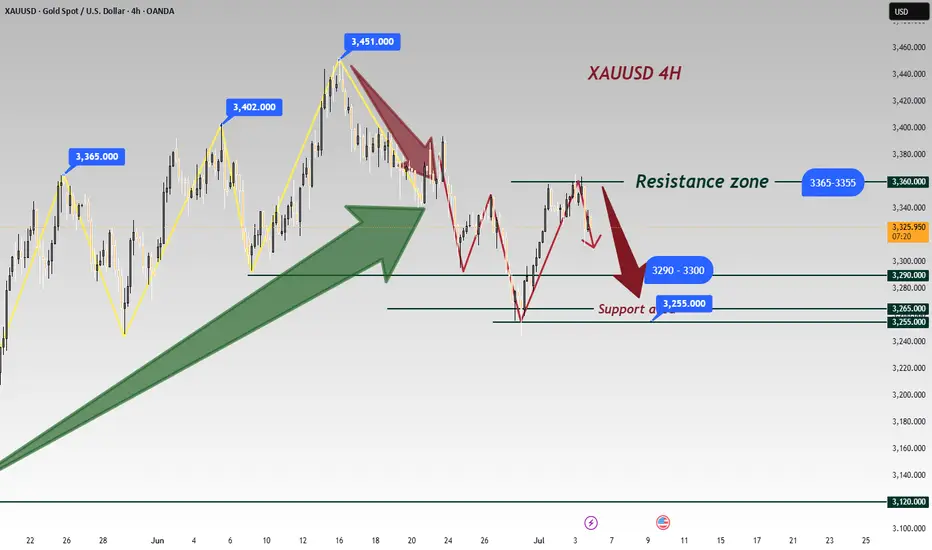
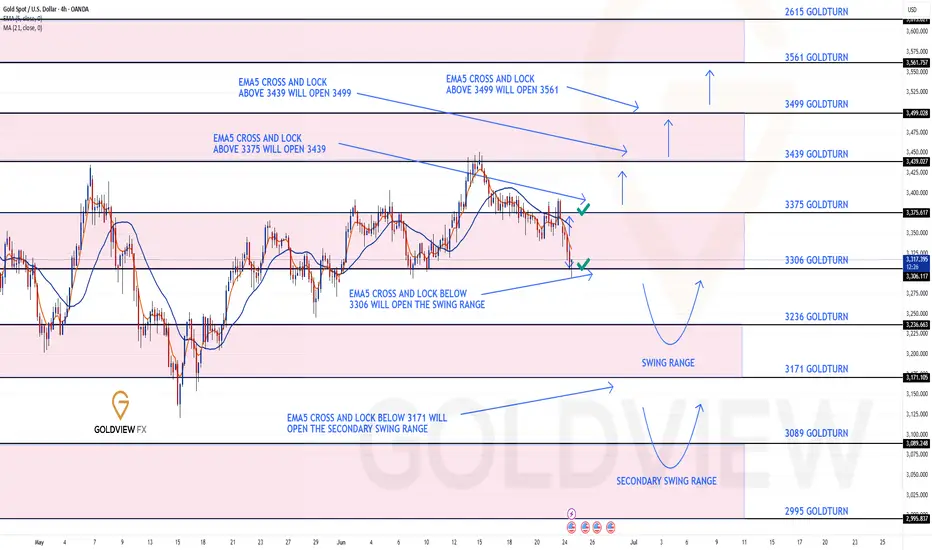
GOLD 4H CHART ROUTE MAP UPDATEHey Everyone,
Great day on the markets once again. This is an update on our 4H chart idea from Sunday, also playing out perfectly.
We started with our bullish target hit at 3375 with no cross and lock confirming the rejection into completing our bearish target at 3306. We will now need to see ema5 cross and lock on either weighted level to determine the next range.
We will keep the above in mind when taking buys from dips. Our updated levels and weighted levels will allow us to track the movement down and then catch bounces up.
We will continue to buy dips using our support levels taking 20 to 40 pips. As stated before each of our level structures give 20 to 40 pip bounces, which is enough for a nice entry and exit. If you back test the levels we shared every week for the past 24 months, you can see how effectively they were used to trade with or against short/mid term swings and trends.
The swing range give bigger bounces then our weighted levels that's the difference between weighted levels and swing ranges.
BULLISH TARGET
3375 - DONE
EMA5 CROSS AND LOCK ABOVE 3375 WILL OPEN THE FOLLOWING BULLISH TARGETS
3439
EMA5 CROSS AND LOCK ABOVE 3439 WILL OPEN THE FOLLOWING BULLISH TARGET
3499
EMA5 CROSS AND LOCK ABOVE 3499 WILL OPEN THE FOLLOWING BULLISH TARGET
3561
BEARISH TARGETS
3306 - DONE
EMA5 CROSS AND LOCK BELOW 3306 WILL OPEN THE SWING RANGE
3236
3171
EMA5 CROSS AND LOCK BELOW 3171 WILL OPEN THE SECONDARY SWING RANGE
3089
2995
As always, we will keep you all updated with regular updates throughout the week and how we manage the active ideas and setups. Thank you all for your likes, comments and follows, we really appreciate it!
Mr Gold
GoldViewFX
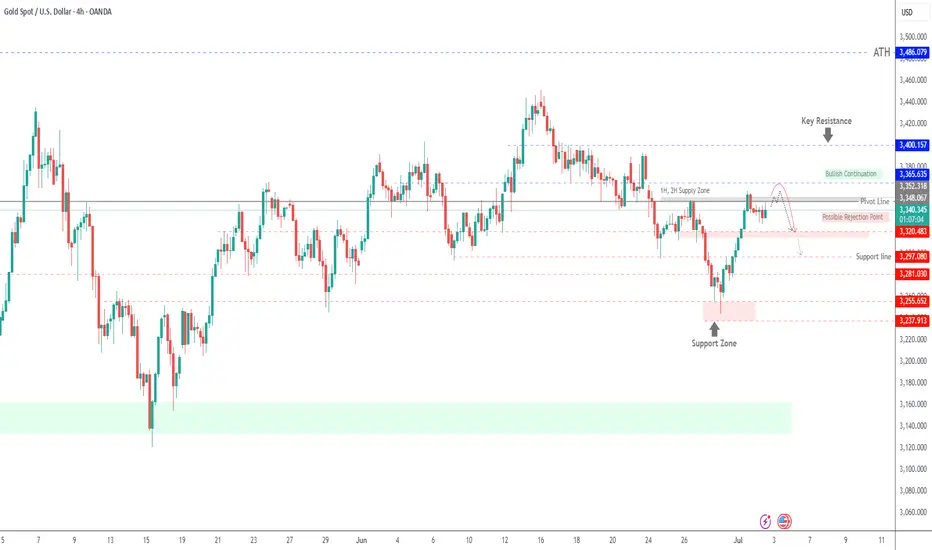
XAU/USD Struggles Below 3352, Bearish Pressure Remains ActiveXAU/USD Below Pivot, Watching 3352 for Bullish Confirmation
Gold prices edged up today as investors shifted their focus to the U.S. fiscal situation and lingering uncertainty ahead of the July 9 deadline when U.S. tariffs are set to take effect. But at the same time, we have strong resistance on the way.
The price continues to move below the pivot level and the 3352 resistance, which together form a strong supply zone.
A confirmed breakout above 3352 on the 4H candle is needed to validate a bullish move toward 3365. However, the possibility of a renewed decline remains unless the price also breaks above 3365, which would confirm a continuation of the upward trend.
The bearish trend remains active as long as the price trades below the pivot at 3348 and the 3352 level. Sustained trading below this zone would likely lead to a decline toward 3320 and 3313.
Key Technical Levels
Resistance: 3352 - 3365 - 3400.
Support Levels: 3320 - 3313 - 3218.
Pivot Line: 3348
XAU/USD M5 – Bearish Fib Retracement & Downtrend Continuation SeXAU/USD M5 – Bearish Fib Retracement & Downtrend Continuation Setup
Gold is currently testing the Fibonacci 0.236–0.382 retracement zone after a clean bearish leg, aligning with the descending channel structure. Price is now forming a possible lower high, hinting at a potential continuation of the intraday downtrend.
🔍 Key Technical Highlights:
Bearish Market Structure: Price remains inside a well-respected descending channel, respecting both lower highs and lower lows.
Fibonacci Confluence: Retracement into the 0.236–0.382 zone (around $3,345 – $3,347) may act as a resistance.
Rejection Expected: Small distribution forming near $3,347 inside the channel resistance.
Downside Targets:
1.0 extension: ~$3,338
1.618 extension: ~$3,330
Extended target: Lower channel boundary
📊 Trade Setup:
Bias: Short (scalp/intraday)
Sell Area: $3,345 – $3,347 (Fibonacci + structure confluence)
Stop Loss: Above $3,350
Target: $3,330
Risk:Reward: ~1:3 (depending on entry)
🧠 Tactical Note:
Watch for a break and retest below $3,343–3,342 demand zone (purple box) to confirm continuation. A breakout from the descending channel would invalidate this scenario.

Gold Trade Plan 02/07/2025ِDear Traders,
On the 1-hour chart of XAUUSD (Gold vs. USD), we observe a breakout of the descending trendline, followed by a successful pullback and continuation to the upside.
The blue demand zone around 3295–3310 acted as a strong support and triggered a bullish move.
As long as the price holds above this support, we expect the uptrend to continue, targeting the resistance areas between 3360–3375 and potentially up to 3390–3400.
The RSI has pulled back from the overbought zone but is still holding above the 50 level, supporting the bullish sentiment.
📌 Conclusion:
If the price holds above the support zone, further upside towards the resistance zones is likely. If the support fails, the bullish scenario may be invalidated for now.
Regards,
Alireza!
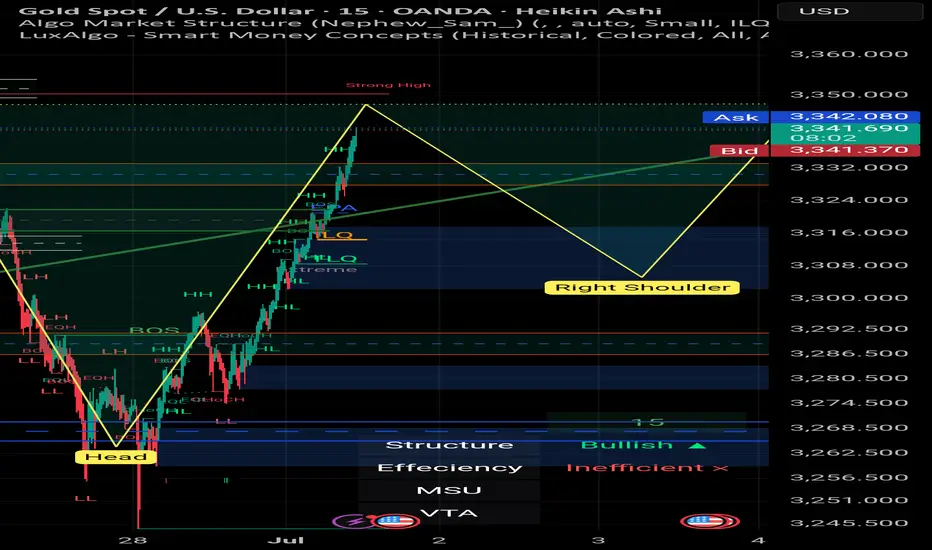
Below of last update of reverse head and shoulder post XAU/USD | 30min | by Mohsen Mozafari Nejad
🔸 **Instrument:** Gold / USD (XAU/USD)
🔸 **Timeframe:** 30min
🔸 **Methodology:** Smart Money Concepts (SMC) + Liquidity + OB + Market Structure
🔸 **Focus:** New Monthly Open Setup
🔍 Market Context:
---
## 🧠 Technical Breakdown:
1. **Strong recovery** after clearing deep liquidity sweep (Head zone)
2. **Bullish BOS** structure confirmed on LTF → Multiple HH and HL formed
3. Price now testing **Key Supply/OB zone at 3300–3315**
4. Above this zone lies a **Strong High (SH) around 3,350**, a potential liquidity magnet
5. Overall bias is bullish unless strong rejection appears from upper OB
---
## 📌 Trade Plan:
| Position | Entry Confirmation Zone | Stop Loss (SL) | Take Profit (TP) |
|----------|--------------------------|----------------|------------------|
|
| Short (scalp only) | Bearish reaction from 3,345–3,350 | Above 3,353 | TP1: 3,310 / TP2: 3,290 |
---
## ⚠️ Risk Factors to Watch:
- 🔺 High-impact USD news (July 1st releases: Manufacturing PMI / employment preview)
- 🔺 Overextension above supply zone without support → trap risk
- 🔺 Bull trap risk if price spikes above 3,340 then sharply reverses
---
## ✅ Summary:
> **Start of July** could fuel volatility and directional momentum.
> The structure is clearly bullish short-term, but upper liquidity zones remain **highly reactive**.
> Smart traders will wait for reaction at the 3,340–3,350 SH zone before overcommitting.
**Structure:** 🔴 bearish momentum
**Efficiency:** ✅ Clean
**Liquidity:** 🔺 Above SH & Below recent HL
📊 Prepared by: **Mohsen Mozafari Nejad**
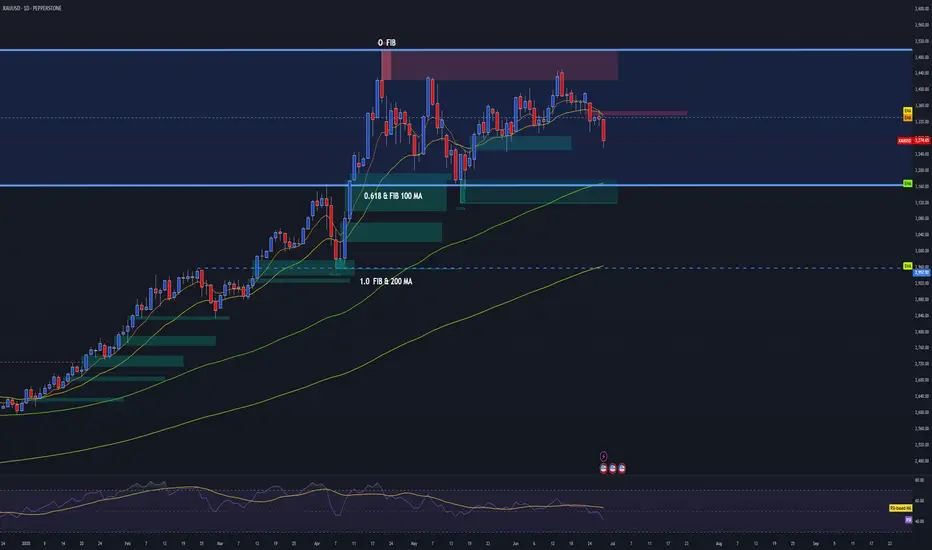
GOLD DAILY OUTLOOK | BEAR MARKET STRUCTURE CONFIRMED 📉 Trend Reversal Underway – Prepare for Lower Levels
The daily structure on Gold (XAUUSD) confirms a shift from accumulation to distribution.
Here's what stands out:
🔻 Key Breakdown Factors:
Failure at O_FIB Rejection Zone
The price failed to sustain above the upper Fib extension and supply zone (marked in red). Multiple attempts at reclaiming this level have resulted in sharp rejections, signaling exhaustion of buyers.
Break of Mid-Range Structure
We've decisively closed below the range midpoint, with strong bearish daily candles. This confirms loss of control by bulls and opens the door for a move toward deeper retracement zones.
Support Zones Exposed
The 0.618 FIB & 100 MA area around ~3160 is now a primary target. This zone held previously, but repeated touches weaken structure.
The 1.0 FIB & 200 MA zone around ~2960 is the macro support target. If sentiment continues to deteriorate, this will be the magnet.
EMA Crosses Rolling Over
Price has decisively lost the 9/21 EMA zone. Until a daily close reclaims this zone (~3335+), bearish momentum remains valid.
📉 Bearish RSI Momentum
While not a primary signal, RSI confirms momentum divergence and bear control below the midline. No sign of reversal.
🎯 Bearish Bias Until Reclaim of 3335 Zone
📌 Next Target = 3160, then 2960
🛑 Invalidation = Daily close above 3340 with strong volume and reclaim structure
This is not a short-term pullback — it's the beginning of a deeper correction. Gold is no longer in the “safe-haven” trade. Be patient, position with structure, and let the trend do the work.
Focus will be on fading the traps on pullbacks into structure.
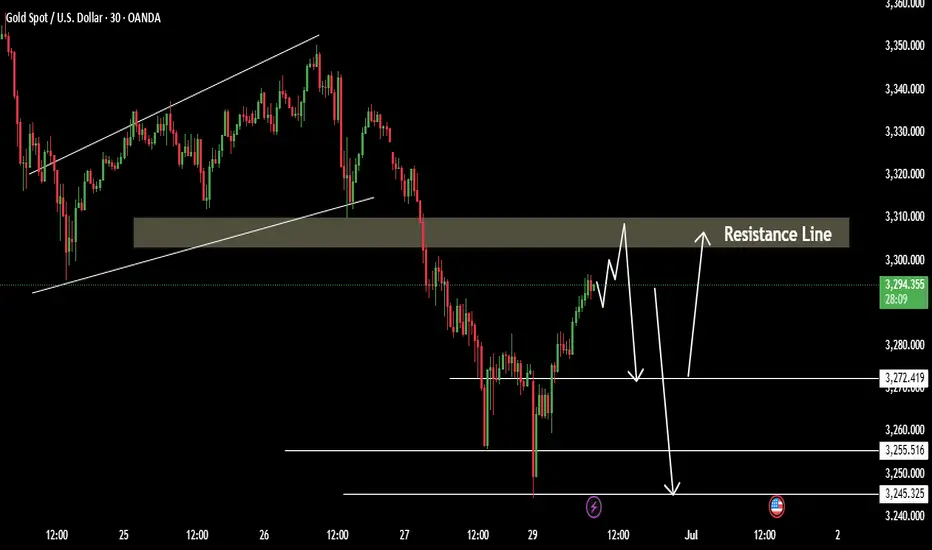
Gold has shown signs of recovery DowntrendXAUUSD Gold Technical Outlook – June 30
Gold has shown signs of recovery at the start of the session, largely supported by a weaker U.S. dollar. However, the upside remains uncertain as long as the price stays below key resistance zones.
Gold is still in a downtrend Price action suggests a potential correction phase Key resistance area lies between 3294 – 3312 Failure to break this zone keeps the bearish pressure intact.
If the price fails to hold above 3272, further downside targets are
Key Levels:
Resistance: 3294 / 3305 / 3312
Support: 3272 / 3255 / 3245
You may find more details in the chart Ps Support with like and comments for better analysis share with you.
XAUUSD:Today's Trading Strategy
Gold retreated in the sub-session, I have personally increased my long position near 3331, the overall trend is bullish unchanged, the median strategy is patient to rise. If you are trading short, you can go long at 3325-3330 and leave at 3340-45. The same can be said if you want to solve the problem; Trade according to your trading preferences and risk tolerance.
More detailed strategies and trading will be notified here ↗↗↗
Keep updated, come to "get" ↗↗↗