XAUUSD/GOLD Geopolitical conflicts have escalated again. Next week is a week of heavy news. How will the gold price focus next week? How to trade? Look at the news preview first.
1. Geopolitics, Russia-Ukraine conflict, Palestine-Israel conflict, Iran-Israel conflict.
2. ADP data, NFP data.
3. Tariff deadline.
The above three news are enough to cause drastic fluctuations in the gold price.
On Friday, the New York market followed my expectations. After rebounding around 3282, it fell back. Finally closed around 3274.
The impact of the weekend news is huge. From the news perspective, the opening price of next Monday will be higher than the closing price on Friday. In terms of operation, you can pay attention to buying at a low price after the market opens.
XAUUSDK trade ideas
XAUUSD Nears Key Rejection ZoneHello all dear traders!
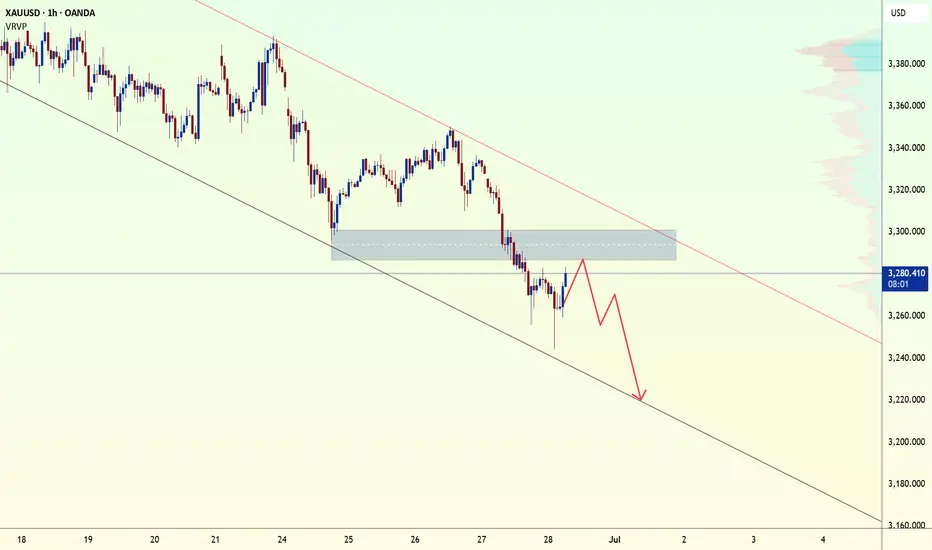
Currently, XAUUSD is still in a clear downtrend, with lower highs and lower lows – a characteristic of a market controlled by sellers. Now the price is rebounding to an important resistance zone – which was previously a demand zone but was broken. It coincides with the EMA cluster and falls right into a technical confluence area. This is a very typical "retest" before the price continues to fall.
If you have experience, you will know: there is nothing more dangerous than buying in a downtrend, just because the price is recovering.
On the macro side, the current context is not favorable for gold: Middle East tensions have temporarily subsided, the USD is recovering slightly, US bond yields are still high, and US inflation data is showing signs of cooling down. That is: gold is losing its role as a haven and a hedge against risks – money will gradually withdraw from gold if there are no more unexpected fluctuations.
Given the convergence of these technical and fundamental factors, I am leaning strongly towards a continuation of the downside, with the possibility of a further decline towards the lower boundary of the channel. Traders should wait for a clear price reaction at the resistance zone – if they see a strong rejection signal (e.g. pinbar, engulfing candle, or exhausted volume), it is a very good opportunity to enter a position.
The rebound short-selling trend remains unchangedFrom the 4-hour analysis, the upper short-term resistance is around 3297-3301, and the pressure at 3315-3316 is paid attention to. The pressure at 3324 is focused on. In terms of operation, the rebound continues to be the main short and the trend is downward. The short-term support below is around 3250-3255. The overall main tone of high-altitude participation remains unchanged relying on this range.

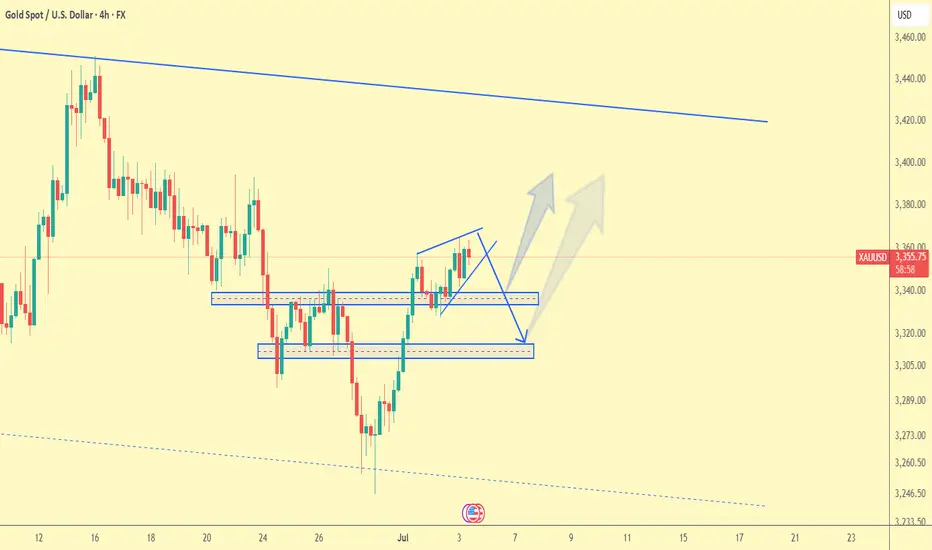
XAU / USD 4 Hour ChartHello traders. We have the 4th of July holiday tomorrow, so today is the last day open for the NY market. Saying that, we have bing (red flag) news today here in the US in about 2 hours from now. I am just posting a quick 4 hour chart with the areas / candle I am currently watching. I will most likely wait to see what the news brings. I will post a lower time frame chart. Let's see how things play out. Big G gets all my thanks. Be well and trade the trend.
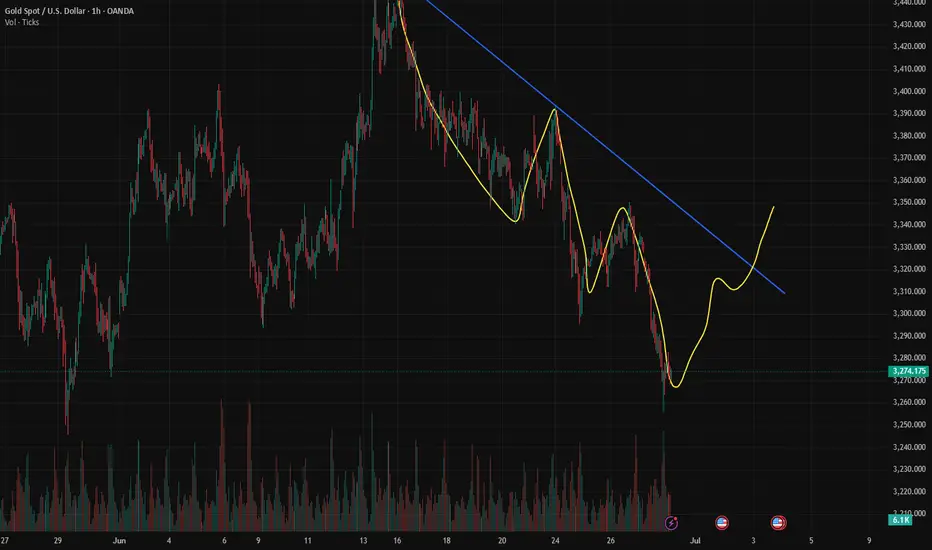
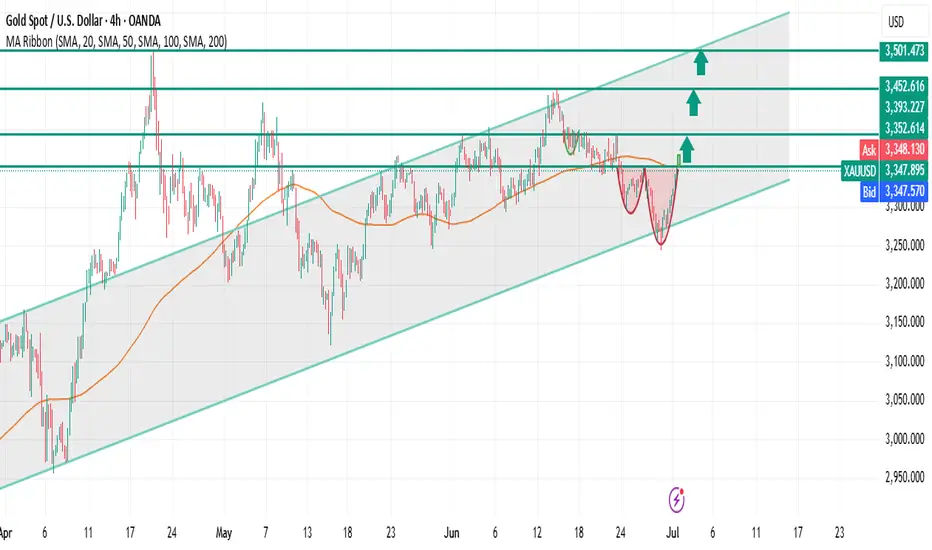
Gold (XAUUSD) – FRL Classic Double Bottom After CorrectionGold forms a clean double bottom after a correction within an upward channel.
The neckline aligns precisely with the 100 MA – a classic Fractal Reversal Law (FRL) setup, indicating a phase shift back into the bullish structure.
Why This Setup:
✅ Trend Structure:
Gold remains inside its upward channel, respecting each phase with corrective trends that end with clear reversal patterns.
✅ FRL Double Bottom:
• The corrective downtrend completes with a double bottom.
• The neckline is strictly horizontal, matching the start of the last impulse (FRL principle).
• Alignment with the 100 MA confirms the phase and scale.
✅ Confirmation:
We wait for a full H4 candle close above the neckline for entry confirmation.
Trade Plan:
📈 Entry:
After H4 confirmation above the neckline or on a retest of the neckline.
🎯 Targets:
Take Profits are aligned with the key levels from the chart:
• TP1: First resistance in the mid-channel zone.
• TP2: Next resistance level within the channel.
• TP3: Upper channel boundary.
🛑 Stop Loss:
Placed just below the smaller low of the double bottom, maintaining a clean and logical risk structure.
FRL Key Notes:
Every correction is also a trend that ends with a reversal pattern.
The neckline = the beginning of the last impulse, always horizontal.
The 100 MA is used to align the timeframe with the market phase.
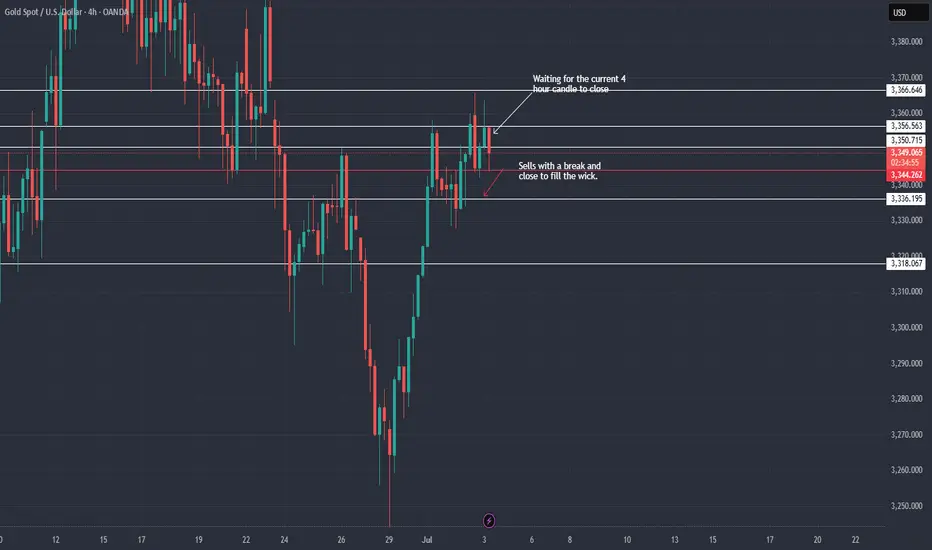
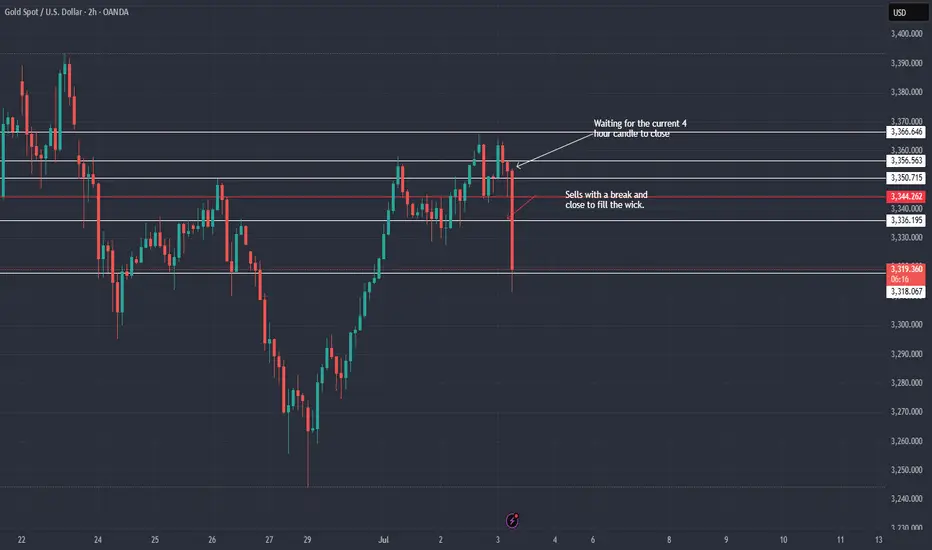
XAU / USD 4 Hour ChartHello traders. Just a quick post with a revised area of interest on the 4 hour chart. I will check to see how the overnight charts do for gold's direction. I will post during the end of the London session or when the Pre NY volume comes in tomorrow morning. Be well and trade the trend. Big G gets a shout out and all my thanks. Thank you so much and don't get caught trading in the range, wait for a break and close and if the lower time frames match up, see if the set up plays out. DYOR and never try to force or rush a trade. I did all that years ago and just lost money and / or blew threw the account.

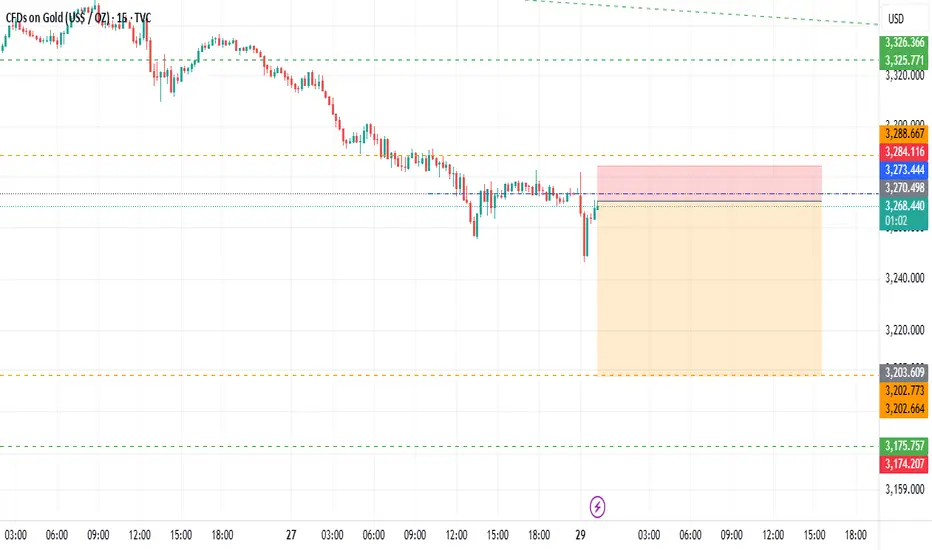
GOLD ANOTHER 15M SELL OPPORTUNITYHope all well, GOLD look to cover the bottom side earlier this week before we go back up again
I can see 3203 first before we BUY
If this plays out its good risk reward trade
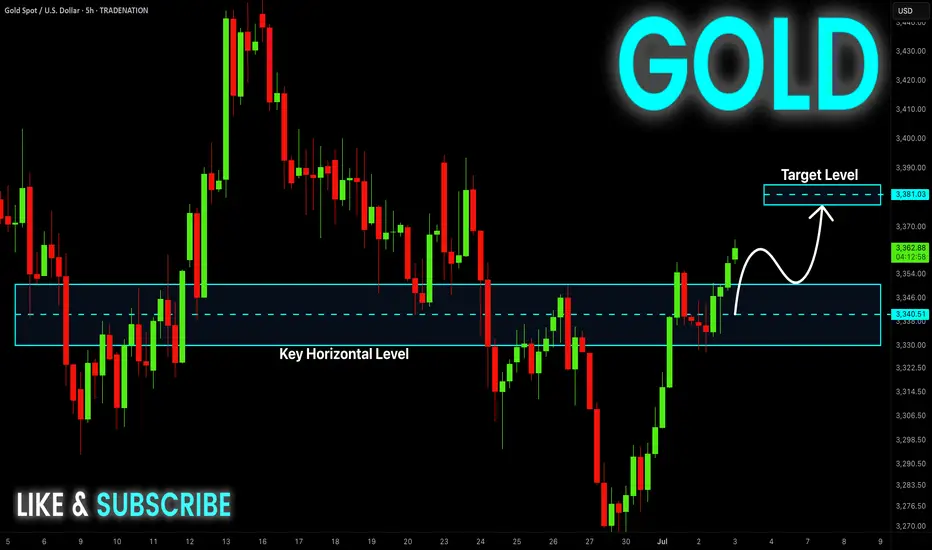
GOLD Bullish Breakout! Buy!
Hello,Traders!
GOLD is going up now
And the price broke the
Key horizontal level
Around 3,346$ and
The breakout is confimred
So we are bullish biased
And we will be expecting
A further bullish move up
Buy!
Comment and subscribe to help us grow!
Check out other forecasts below too!
Disclosure: I am part of Trade Nation's Influencer program and receive a monthly fee for using their TradingView charts in my analysis.
Excellent opportunities on GoldAs discussed throughout my yesterday's session commentary: "My position: I have engaged #4 Scalp orders throughout yesterday's session (all in Profit) and will continue to do so however on the other side (Buying) from my key entry points. Keep in mind that overall trend remains Bullish and Trade accordingly."
As I expected upside extension as per above, I have waited for #3,352.80 - #3,357.80 my local Top's for the sequence and started aggressively Selling Gold from #3,348.80 first, then #3,352.80 #4 aggressive Selling Scalps and #3,357.80 final two Scalps which I held all the way towards #3,345.80 Support for the fractal (cca #130k Profits Intra-day).
My position: Since #3,337.80 was neckline for upside Bull structure, I was aware if it gets invalidated to the downside, it will open doors for #3,327.80 extension (which held twice throughout late U.S. and Asian session). I don't expect much Selling action today however Bulls need another Fundamental push to invalidate wall of Resistances at #3,340's and #3,350's. I will continue Scalping as opportunity arise / no Swing orders.
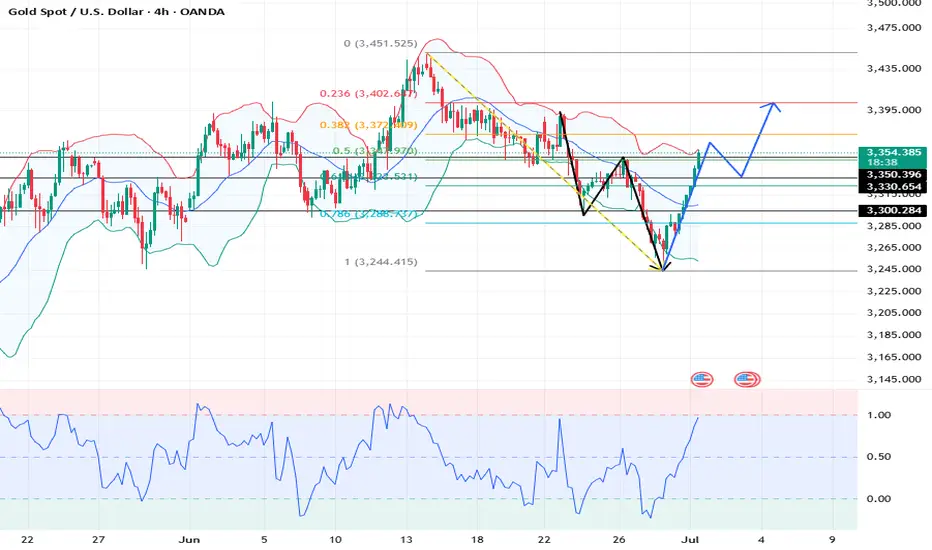
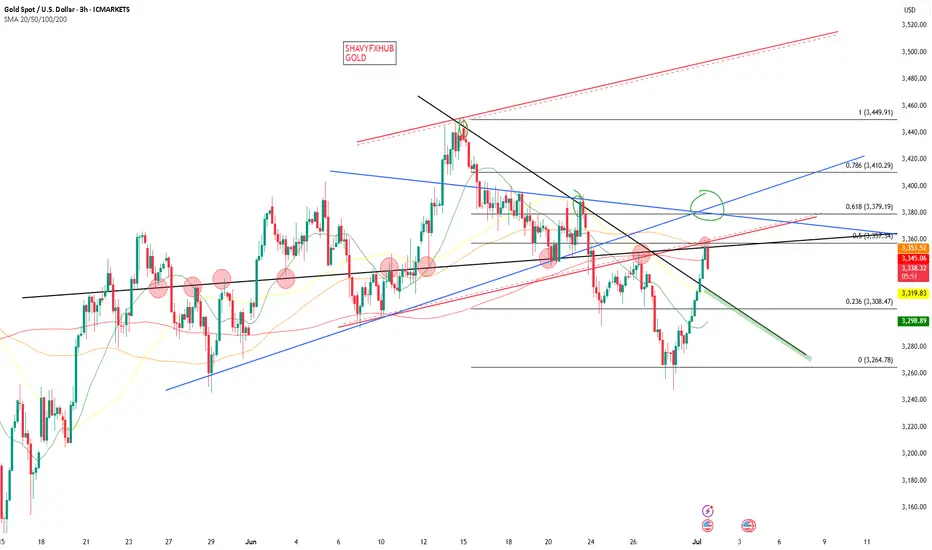
XAUUSD: Market analysis and strategy for July 1.Gold technical analysis
Daily chart resistance 3400, support 3250
4-hour chart resistance 3374, support 3300
1-hour chart resistance 3355, support 3330
4-hour chart bearish, but 1H chart has reversed bullish. Technically, gold formed a double bottom support near 3247 and has entered the B wave rebound, but beware of the C wave decline that may start at any time.
Gold price accelerated upward after breaking through the key resistance of 3300. 3300 is the 0.50 position of the previous decline. Today's market rose slowly by 50 dollars without a callback. The bullish rally will continue at least until the second half of the NY market before a callback occurs.
The risky approach is to follow the trend and buy at the current price. The safe way is to wait for the callback to around 3325~3330 before buying.
BUY: 3350
BUY: 3330
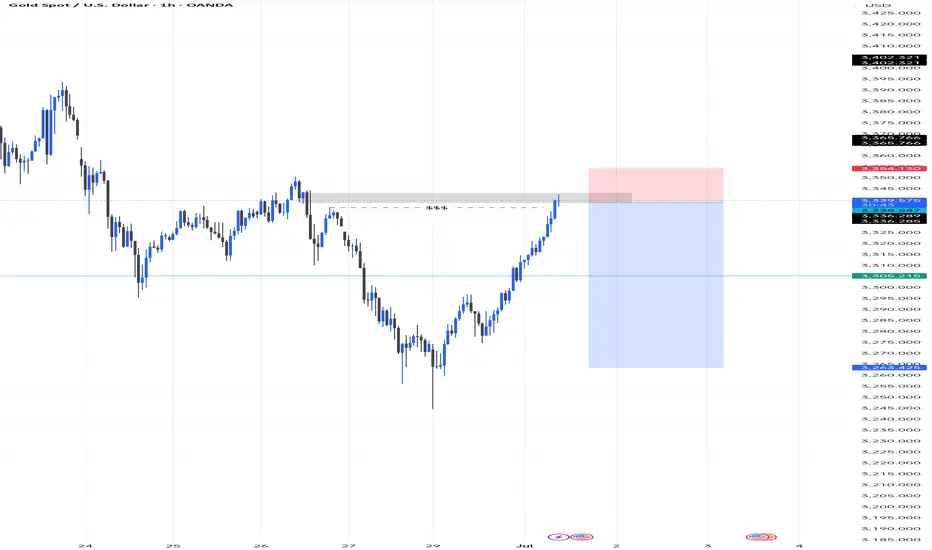
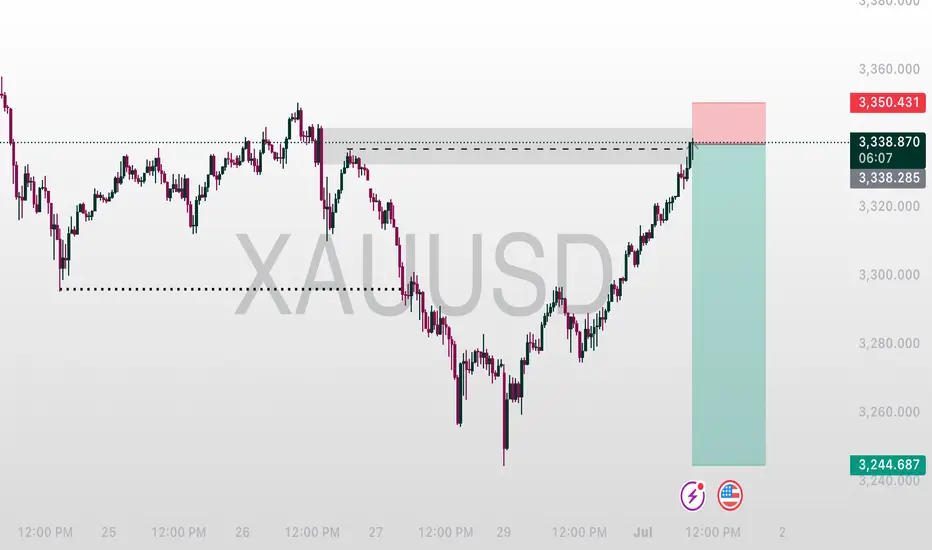
Gold (XAUUSD) short trade idea based on 1H chart 🪙 GOLD (XAUUSD) SHORT SETUP – Liquidity Grab Play 📉🔥
Here’s a potential short setup forming on Gold (1H timeframe):
🔹 Liquidity Sweep:
Price just tapped into a key supply zone after an aggressive bullish move, grabbing liquidity above recent highs (marked $$$). This is a classic setup for a potential reversal or retracement.
🔹 Premium Zone Entry:
The short position is taken right after price tapped the supply zone between 3340–3354, showing early signs of exhaustion.
🔹 Trade Setup:
Entry: Near 3341.30
SL: Just above supply at ~3354.13
TP: Down near the recent demand/imbalance at 3263.42
RRR: High reward potential with minimal risk.
🔹 Confluence Factors:
Price filled imbalance with strong momentum.
Reversal likely if no continuation above supply.
Key psychological levels and liquidity engineered below price.
📊 Execution Plan:
Watch lower timeframe confirmations (M15/M5 rejection or engulfing).
Manage stop based on how price behaves around 3350.
⚠️ As always, risk smart. Let the market confirm your bias before committing fully.
Note: wait for confirmation
Gold on relief rallyAs discussed throughout my yesterday's session commentary: Quick update: No Swing orders today, only aggressive Scalps similar to Scalp orders I mentioned above from my key re-Buy points. If #3,300.80 is recovered, newly formed Bullish structure will push for #3,313.80 and #3,327.80 test. If #3,300.80 benchmark is preserved, I will still keep Buying (Scalp only however). I will have Gold's major move revealed after today's session."
Technical analysis: I have been aware that another failed attempt to invalidate #3,272.80 - #3,278.80 local Support zone will most likely result into firm rejection and yet another push towards #3,302.80 psychological benchmark and ultimately the #3,327.80 level which represents Short-term Resistance line which is now invalidated to the upside (as discussed above already). Keep in mind that the current Bullish Short-term set-up can offer a great opportunity for those who missed the last rally to enter at almost (# +1.00%) of the Price so many Sellers which were liquidated will now engage multiple Buying orders so Buying pressure will be significantly Higher. Gold is extending the Trade nicely inside the healthy Hourly 4 chart's Ascending Channel and after failed Support zone reversal. Price-action has even more probabilities now to test #3,352.80 psychological benchmark. Gold is Fundamentally Bullish as well due Tariffs announcement.
My position: I have engaged #4 Scalp orders throughout yesterday's session (all in Profit) and will continue to do so however on the other side (Buying) from my key entry points. Keep in mind that overall trend remains Bullish and Trade accordingly.
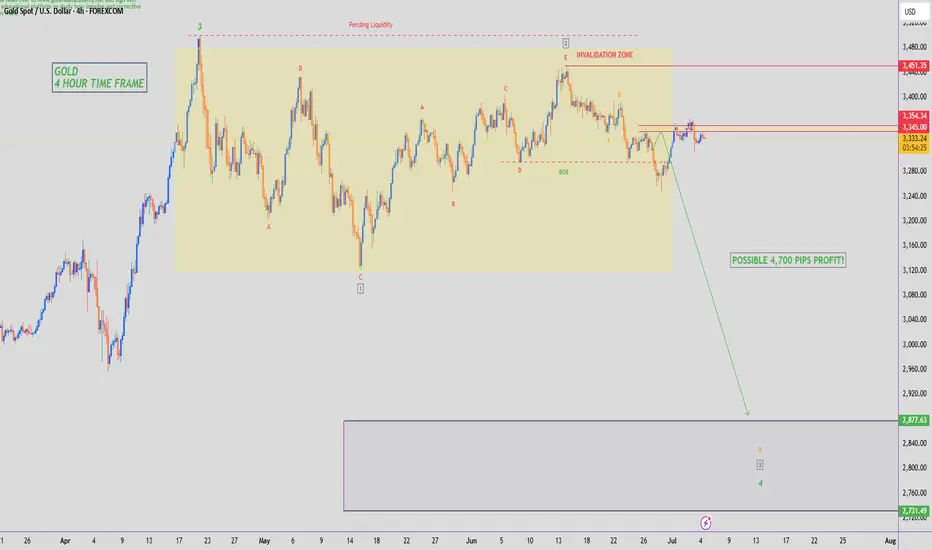
GOLD - SHORT TO $2,800 (UPDATE)Gold closing the week below our 'premium resistance zone', running roughly 170 PIPS in profit. Hope you all are in sells & running in profit like my Gold Fund investors as this was called live for you.
Don't forget we could also have a possible liquidity zone sitting just above $3,400 like I told you all earlier this week. Just something to be careful of & stay prepared in advance.
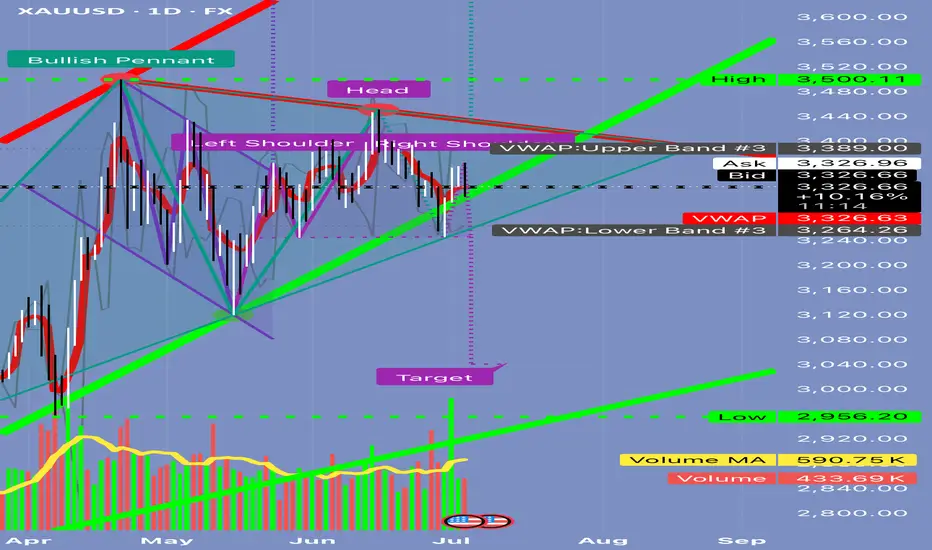
From Congestion to Collapse: Understanding Distribution and H&S A Simple Lesson: How to Identify Congestion Zones in the Market — Schabacker’s Approach and the Head and Shoulders Pattern
⸻
👤 Who Was Schabacker?
🔹 Richard Schabacker was one of the pioneers who authored seminal works on technical analysis.
🔹 He lived over 90 years ago and served as Editor-in-Chief of Financial World magazine.
🔹 His most notable book is:
Technical Analysis and Stock Market Profits
🔹 Published around 1932 in the United States.
🔹 Schabacker is often considered the “grandfather” of technical analysis, and much of the methodology traders use today can be traced back to his insights.
⸻
🟢 What Did He Teach?
🔹 Schabacker introduced a critical concept:
✅ The Congestion Zone
🌟 What Does It Mean?
When the market makes a strong move—either a sharp rally or a steep decline—price often becomes trapped in a range:
• Buyers at higher levels wait for further gains.
• Sellers at lower levels expect more downside.
But in reality, retail traders aren’t moving the market. Large institutions and funds—the so-called smart money—are in control.
👈 When these big players want to exit positions, they avoid selling everything at once to prevent a sudden collapse in price and to avoid revealing their hand.
✅ Their Playbook:
• Keep price contained within a narrow band between support and resistance.
• Gradually increase volume over time.
• Attract new buyers who believe the trend is still intact.
• Quietly distribute their holdings without alarming the market.
🌟 Why Do They Do This?
If they were to dump all at once:
• Price would drop rapidly.
• Everyone would realize a large seller was active.
• Institutions would get stuck, unable to exit at favorable prices.
🔻 So They Create Congestion and Distribution:
1️⃣ Sell discreetly over time.
2️⃣ Maintain the illusion that the trend is healthy.
3️⃣ Trap latecomers who buy into the range.
⸻
🟢 How Do You Recognize This on a Chart?
🎯 A Simple Example:
• Price climbs steadily from 3,000 to 3,300.
• Suddenly, it surges to 3,450.
✅ Most traders think the rally will continue.
🌟 What happens next:
• Price stalls between 3,380 and 3,450.
• Numerous candles form in this area.
• Volume remains elevated.
🔥 Inside this range:
1️⃣ Institutions sell into every upward move.
2️⃣ Early buyers remain committed, hoping for new highs.
3️⃣ New participants enter, unaware of the distribution.
🔻 What Do You See?
• Repeated candles oscillating within the same band.
• Failed breakouts above resistance.
• Sustained high volume.
✅ This is the classic Congestion Zone.
⸻
💡 How Can You Tell If It’s Distribution, Not Accumulation?
• Persistent high volume indicates steady selling.
• Price struggles to make fresh highs.
• Long upper wicks signal selling pressure.
• A Head and Shoulders pattern may start forming.
⸻
🎯 What Happens After Congestion?
• Institutions complete their distribution.
✅ Price breaks sharply below the range.
✅ The market drops quickly.
✅ Late buyers are forced to sell at losses.
⸻
🟢 Practical Illustration:
Visualize the range like this:
| |
| The Range |
| |
3380 ————> Resistance
| Multiple Candles |
| Multiple Candles |
| Multiple Candles |
3300 ————> Support and Neckline
✅ If price breaks below 3,300 on heavy volume:
• The distribution is complete.
• Price declines rapidly.
⸻
📌 Key Takeaway:
After any strong move, expect congestion as large players exit. Once they’re done, the trend often reverses.
⸻
🎯 Quick Tips:
✅ Never rush to buy inside congestion after a big rally.
✅ Watch volume—if it’s high, it’s likely distribution.
✅ Wait for a clear breakdown before shorting.
✅ Your target should at least match the size of the preceding move.
⸻
🔥 Let’s Cover the Head and Shoulders Pattern:
✅ What Is It?
A reversal pattern appearing after a strong uptrend, signaling the end of bullish momentum.
⸻
✅ Pattern Components:
1️⃣ Left Shoulder:
• Price makes a high.
• Pulls back.
2️⃣ Head:
• Rallies to a higher high.
• Declines again.
3️⃣ Right Shoulder:
• Attempts to rise but fails to exceed the head’s high.
4️⃣ Neckline:
• Connects the lows between the shoulders and the head.
🔻 When the Neckline Breaks Down:
It’s a strong sell signal. The market often drops decisively.
⸻
💡 Example in Numbers:
• Price moves from 3,200:
1️⃣ Up to 3,350 (Left Shoulder)
2️⃣ Down to 3,300
3️⃣ Up to 3,400 (Head)
4️⃣ Down to 3,300
5️⃣ Up to 3,350 (Right Shoulder)
6️⃣ Down to 3,300
✅ If price closes below 3,300 on strong volume, the pattern is confirmed.
🎯 Target Calculation:
• Head = 3,400
• Neckline = 3,300
• Distance = 100 points
• Target = 3,200
⸻
🟢 How To Trade It:
1️⃣ Don’t preemptively sell during the right shoulder.
2️⃣ Wait for a confirmed breakdown.
3️⃣ Enter a short position targeting 3,200.
4️⃣ Set your stop loss above the right shoulder.
⸻
🟢 Final Advice:
✅ The Head and Shoulders is powerful if confirmed by volume.
✅ Always wait for the neckline break—otherwise, it could be a false signal.
✅ Keep monitoring volume for confirmation.
⸻
🔥 Be disciplined in your analysis and decisive in your execution.
🔥 As Warren Buffett said:
“The stock market is a device for transferring money from the impatient to the patient.”
⸻
If you found this valuable, let me know—I’d be glad to prepare more lessons. 🌟
XAU / USD 2 Hour ChartHello traders. Although I didn't take the trade, you can see the analysis was spot on. A shout out to Big G. I am not trading today, but I will post another chart in a bit. We have the NY open in half an hour or so, let's see how that plays out. Most of the news was good for the US dollar. If you wonder where to watch the numbers to trade spot gold, I use forex factory calendar. Be well and trade the trend.
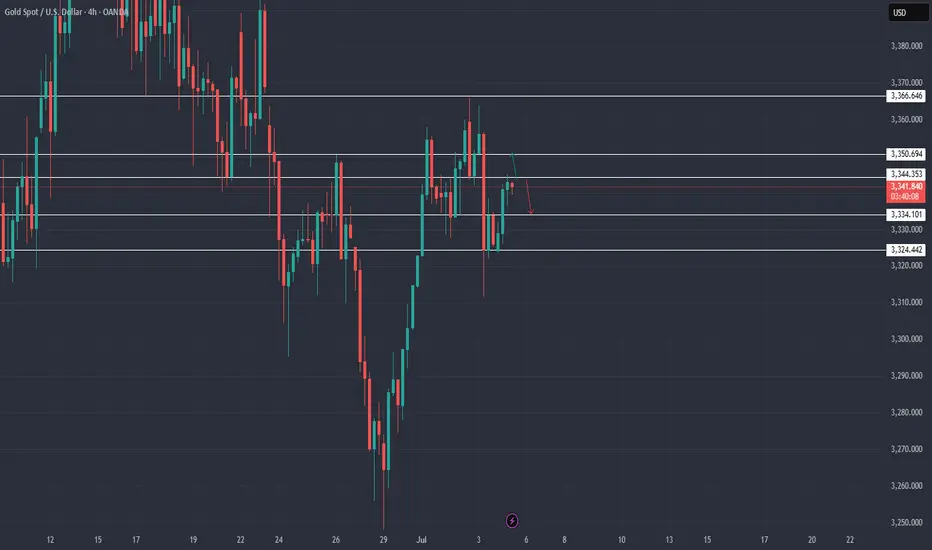
Gold Trade plan 03/07/2025Dear Trader,
On the 4H chart of XAU/USD, a rising wedge pattern is forming, which is typically a bearish reversal signal. After a significant upward movement, price is currently testing the 3360–3365 resistance area. If the lower boundary of the wedge breaks, the price is likely to drop toward the key support zones:
First support zone: 3330–3340
Second support zone: 3305–3315
If buyers defend these areas, a rebound to the upside may occur. But if the second support also breaks, deeper bearish pressure is likely.
Scenarios:
Bullish: If the price holds above 3365, it may rally toward 3380–3400 resistance.
Bearish: A breakdown from the wedge and loss of 3330 support could trigger a move down to 3310 or lower.
Regards,
Alireza!
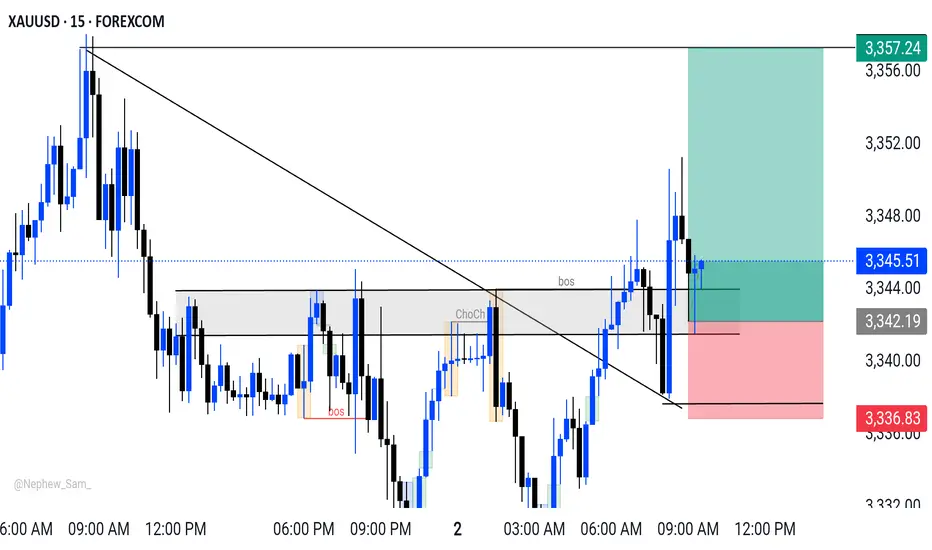
XAUUSD 15M Outlook XAUUSD M15 Outlook 🚀⤴️
* Entry: ~3342 📊
* Take Profit: ~3350
* Take Profit: ~3357
* Stop Loss: ~3335
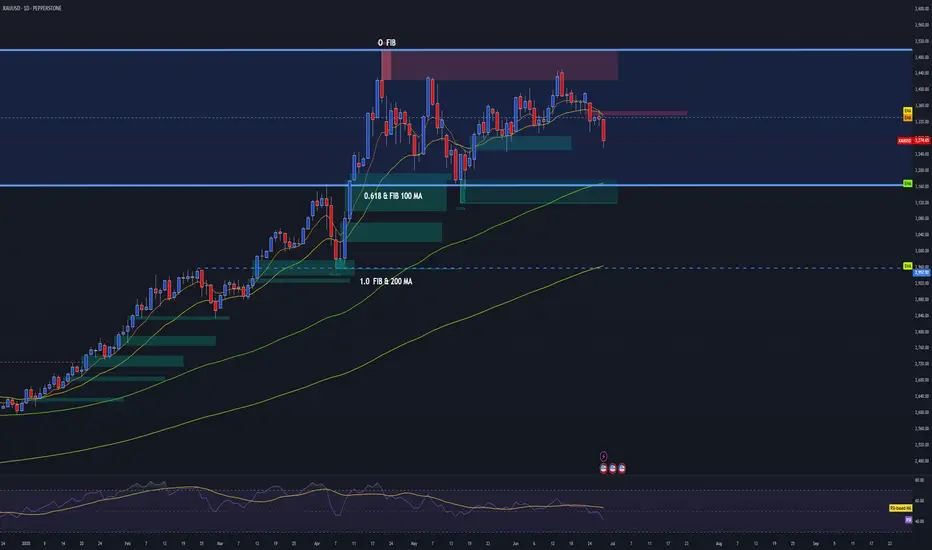
GOLD DAILY OUTLOOK | BEAR MARKET STRUCTURE CONFIRMED 📉 Trend Reversal Underway – Prepare for Lower Levels
The daily structure on Gold (XAUUSD) confirms a shift from accumulation to distribution.
Here's what stands out:
🔻 Key Breakdown Factors:
Failure at O_FIB Rejection Zone
The price failed to sustain above the upper Fib extension and supply zone (marked in red). Multiple attempts at reclaiming this level have resulted in sharp rejections, signaling exhaustion of buyers.
Break of Mid-Range Structure
We've decisively closed below the range midpoint, with strong bearish daily candles. This confirms loss of control by bulls and opens the door for a move toward deeper retracement zones.
Support Zones Exposed
The 0.618 FIB & 100 MA area around ~3160 is now a primary target. This zone held previously, but repeated touches weaken structure.
The 1.0 FIB & 200 MA zone around ~2960 is the macro support target. If sentiment continues to deteriorate, this will be the magnet.
EMA Crosses Rolling Over
Price has decisively lost the 9/21 EMA zone. Until a daily close reclaims this zone (~3335+), bearish momentum remains valid.
📉 Bearish RSI Momentum
While not a primary signal, RSI confirms momentum divergence and bear control below the midline. No sign of reversal.
🎯 Bearish Bias Until Reclaim of 3335 Zone
📌 Next Target = 3160, then 2960
🛑 Invalidation = Daily close above 3340 with strong volume and reclaim structure
This is not a short-term pullback — it's the beginning of a deeper correction. Gold is no longer in the “safe-haven” trade. Be patient, position with structure, and let the trend do the work.
Focus will be on fading the traps on pullbacks into structure.
XAU / USD 4 Hour ChartHello traders. Taking a look at the 4 hour chart, I have marked the potential scalp sell / buy trade set ups. Lower time frame confirmation is a must. I am not trading today as the NY market is closed. I am not trying to do any range trading. Be well and have a great weekend. Today is a holiday here in the USA. We are celebrating breaking away from England, which we see today is George Orwell's 1984. Shout out for freedom and to Big G. Be well and trade the trend.
GOLD ON break and retest ,we have seen market reacting before my preferred sell zone.
trading is 100% probability
GOLD SELL IDEAPrice mitigated the 3244 liquidity and retraced into the 3344 OB. Using the RTO approach, we can take the sell from this premium back into the 3244 liquidity before looking for a buy from the 3215 zone targeting 3500.
Always use a confirmation entry and risk management.
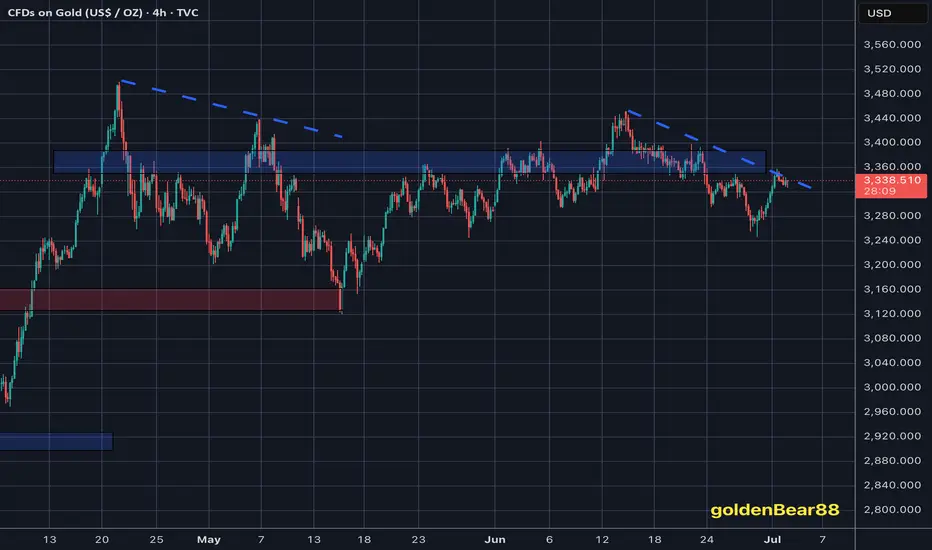
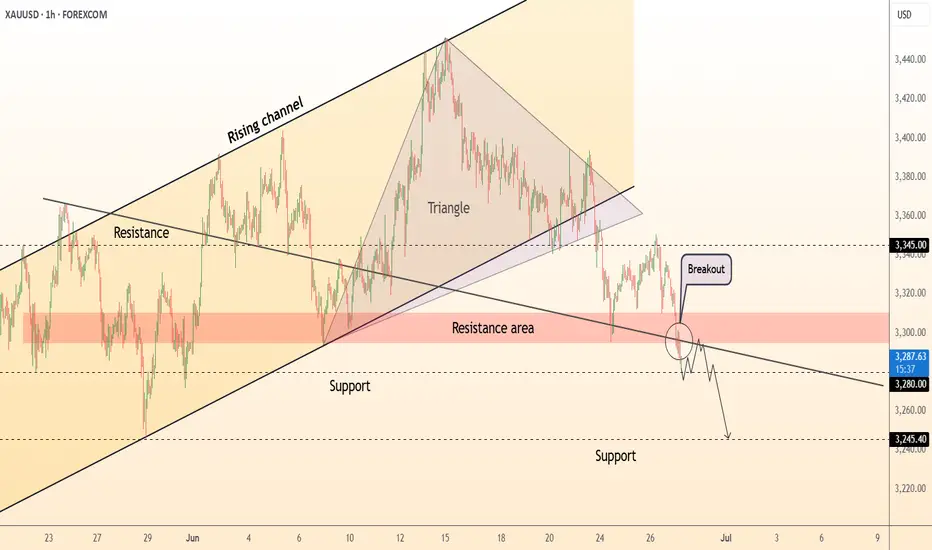
DeGRAM | GOLD broke the demand zone📊 Technical Analysis
● Price sliced beneath the long-term rising‐channel base and the triangle apex, turning 3 300-3 310 into fresh supply; the current pull-back is a textbook bearish retest of the break zone.
● Hourly structure now tracks a new descending trend-line; failure to reclaim 3 300 keeps momentum pointed to the next fib / horizontal shelf at 3 280, with the channel width projecting 3 245 support.
💡 Fundamental Analysis
● Rebound in US 2-yr yields after hawkish Fed speakers and a stronger-than-expected durable-goods print lifted the DXY, reducing short-term bullion appeal.
-------------------
Share your opinion in the comments and support the idea with a like. Thanks for your support!
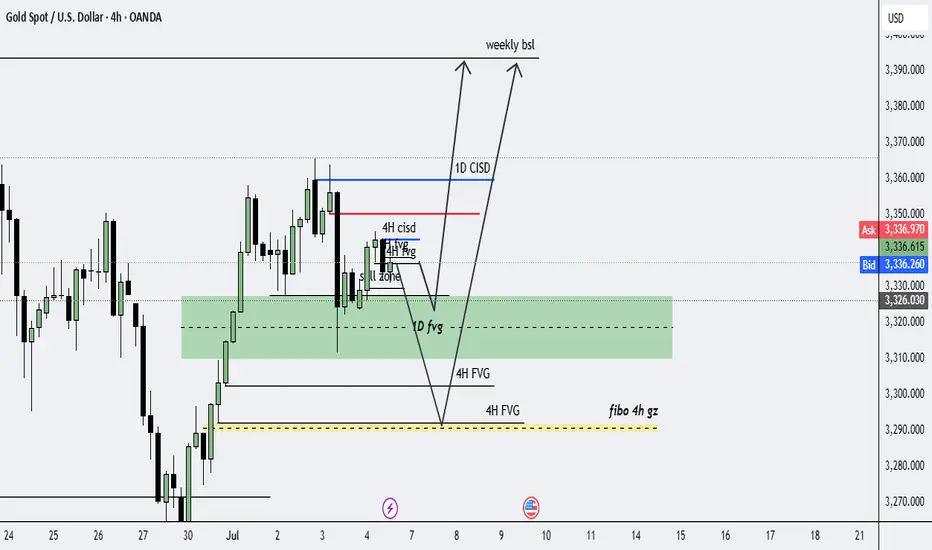
gold to 3393weekly ssl is taken so our weekly bias is bullish just wait for correction to 3290/3293 and wait for confirmation bullish setup to go long good luck