Gold lacks downside momentum: Next week's analysis & adviceGold trading is relatively light today due to the U.S. Independence Day holiday. On the downside, we continue to focus on the short-term support at the 3325 level, while the key resistance above remains in the 3345-3350 range, which was yesterday's breakdown point. The market has closed early today, and price action has been stuck in a range-bound consolidation.
After plunging $40 on the back of bearish non-farm payroll data, gold stabilized and rebounded, recouping nearly half of the losses. This performance confirms that the downside space is limited. Currently, the market has returned to a oscillating upward pattern, and the weekly chart is likely to continue range-bound fluctuations. From a technical perspective, the 3325 level has formed a key support. The secondary retest overnight confirmed the bottom structure, and the gradual lifting of early session lows has also released a bullish signal. Looking ahead to next week, gold is expected to continue its bullish trend. If the 3325 support level below remains unbroken, one can look for opportunities to establish long positions.
XAUUSD
buy@3325-3330
tp:3340-3360-3380
Investment itself is not the source of risk; it is only when investment behavior escapes rational control that risks lie in wait. In the trading process, always bear in mind that restraining impulsiveness is the primary criterion for success. I share trading signals daily, and all signals have been accurate without error for a full month. Regardless of your past profits or losses, with my assistance, you have the hope to achieve a breakthrough in your investment.
XAUUSDK trade ideas
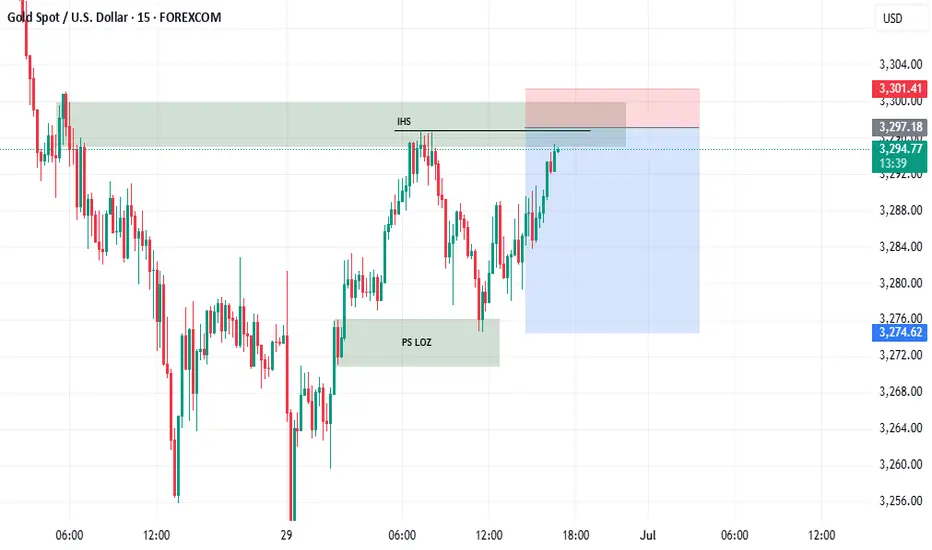
(Probably) Sell!Hello all. market needs some rest and it is possible to go short after breaking the IHS. Lets for conformation and then enter. (winK)
Gold continues to fluctuate, where will it go next week?Fundamental analysis:
With the Trump administration's massive tax cut and spending bill officially implemented, the U.S. Treasury may start a "supply flood" of short-term Treasury bonds to make up for the trillions of dollars in fiscal deficits in the future. The market has begun to respond to future supply pressures. Concerns about the oversupply of short-term Treasury bonds have been directly reflected in prices - the yield on 1-month short-term Treasury bonds has risen significantly since Monday this week. A closer look at non-agricultural new jobs exceeded expectations, but nearly half came from government departments, which is likely to reverse in July. Slowing wage growth, declining total working hours, stagnant wage income growth, and worrying consumer spending are all signs of support for gold.
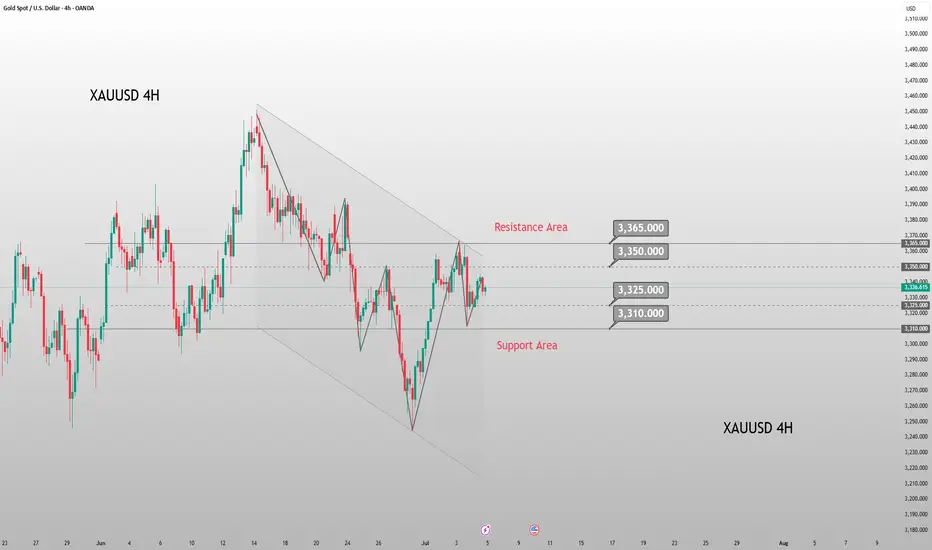
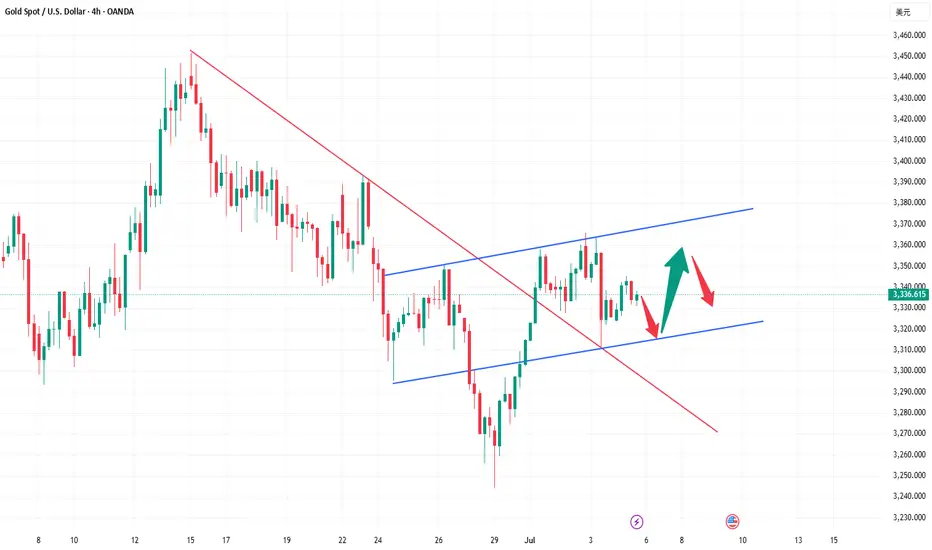
Gold bottomed out and rose from the low of 3245 this week, and then soared all the way to 3365. Finally, the weekly line closed with a positive line with an upper shadow. From the overall trend, after the data is digested, next week will still be treated with a volatile mindset. The large range will focus on the 3280-3393 area. If it does not break, it will still be mainly a sweeping operation. On the daily line, it also closed with a positive line with a long upper shadow, and closed firmly above 3323. It repeatedly tested the pressure of 3345 and did not break and fell back. The structure still maintained an oscillation rhythm within a small range. From the 4-hour cycle, the Bollinger Bands closed significantly. If it opens normally next week, pay attention to the 3325-3315 and 3311 areas when it falls back to support, and pay attention to the 3357 and 3365 positions when it hits the high pressure. It is recommended to maintain the strategy of selling high and buying low in operation and respond to the trend.For more specific operational details and strategy updates, please pay attention to the notifications at the bottom 🌐 and follow them in time.
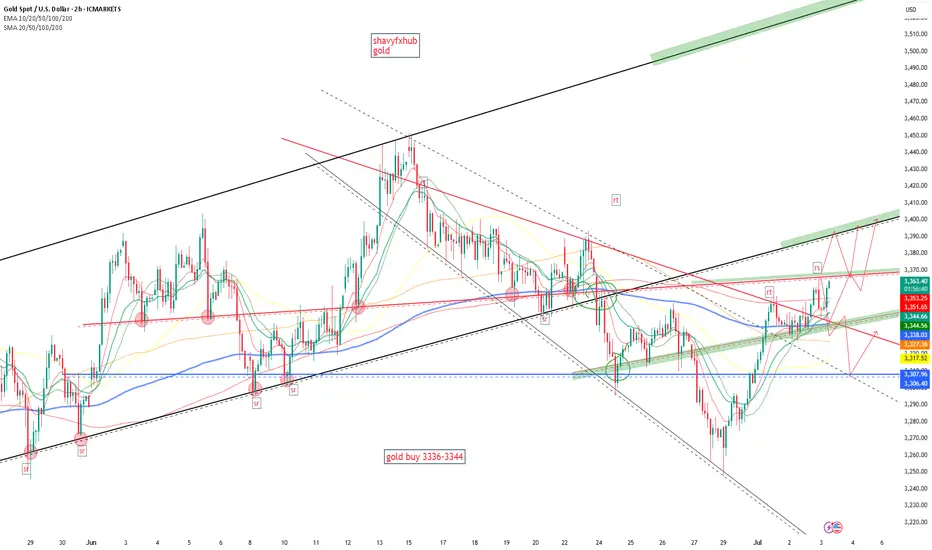
GOLD BEFORE AND AFTERGOLD ,we shared 2 zone ,daily and 4hr buy floor ,the daily was giving us 3322-3318 and 4hr/3hr 3336-3344 and 4hr came and played into a perfect retest of a broken descending trendline and we are holding lower layer hoping that london market could take us to 3400 soon.
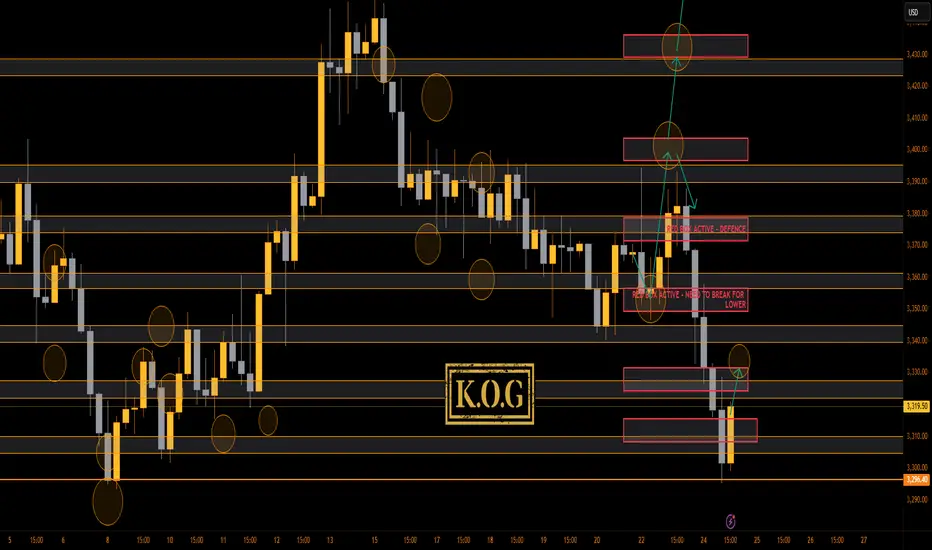
THE KOG REPORT - Update End of day update from us here at KOG:
Well, we actually did want higher but there was no break above, instead, we got the break below and then the move commenced overnight, most of which we missed. We did capture part of it on the tap and bounce, then another trade now on a RIP from lower Excalibur which was hit. Not bad, not amazing, just another day on the markets.
Now, we have support at the 3310-6 level with resistance at 3330 which could be the target over the sessions to come. As long as support holds, we'll hold as well.
As always, trade safe.
KOG
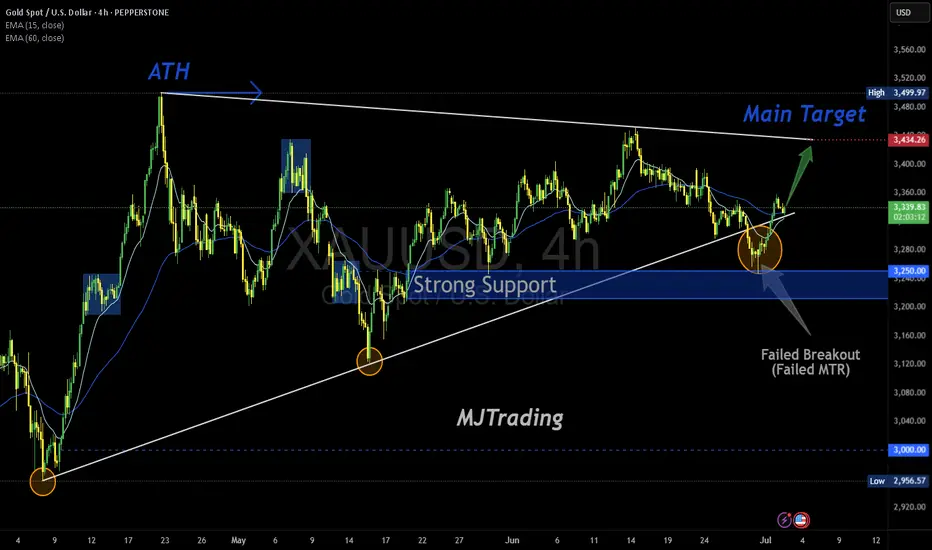
Failed Breakout Sets the Stage for Bullish Continuation"Boost it, if you like it (Thanks)"
Gold is showing resilience after a failed breakout attempt, bouncing strongly off the 3,250 support zone. This 4H chart suggests bulls are regaining control, with momentum building toward the next key resistance.
🔍 Technical Breakdown:
Failed Breakout (Failed MTR Structure): Price briefly dipped below the trendline but reversed sharply, invalidating the bearish move.
Dynamic Support: The ascending trendline near 3,250 has held firm, reinforcing bullish structure.
EMA Structure:
15 EMA: 3,323.84
60 EMA: 3,331.61 Price is now trading above both EMAs, signaling bullish momentum.
Current Price: 3,339.0
Target: 3,434.34 – the first major resistance zone before ATH retest.
🧠 Market Psychology:
This setup reflects a classic “shakeout” – weak hands were flushed out below support, only for price to reclaim the level with strength. This often precedes a strong directional move as confidence returns.
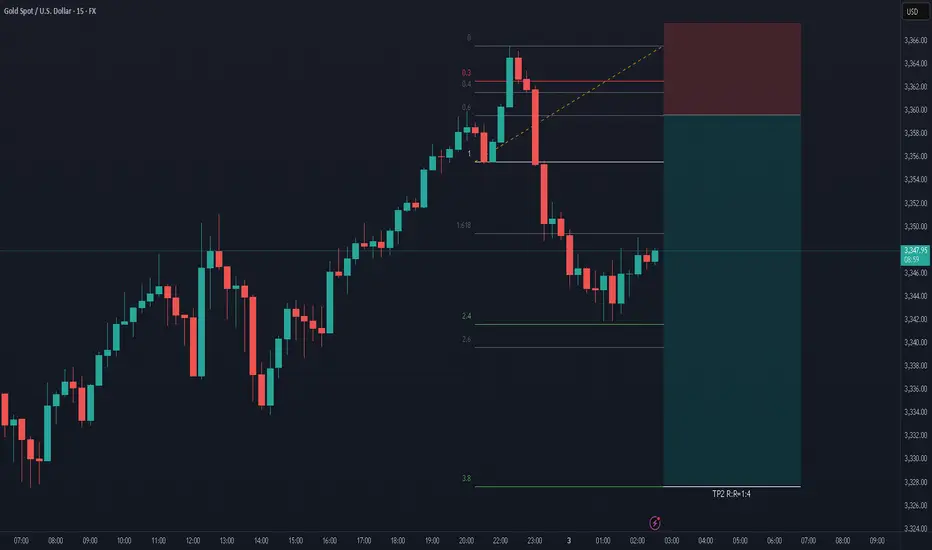
🎯 Trade Setup:
Entry: On a confirmed break above 3,345–3,350
Stop Loss: Below 3,325
TP1: 3365
TP2: 3385
Final TP(x): 3,434.34
⚠️ Watchlist:
Monitor price action near 3,360–3,370 for signs of rejection or continuation.
A clean break above 3,434 opens the door for an ATH retest.
#MJTrading
#Gold #XAUUSD #TechnicalAnalysis #TradingView #FailedBreakout #SupportAndResistance #EMA #BullishSetup #PriceAction #ForexTrading #GoldBulls #MarketPsychology
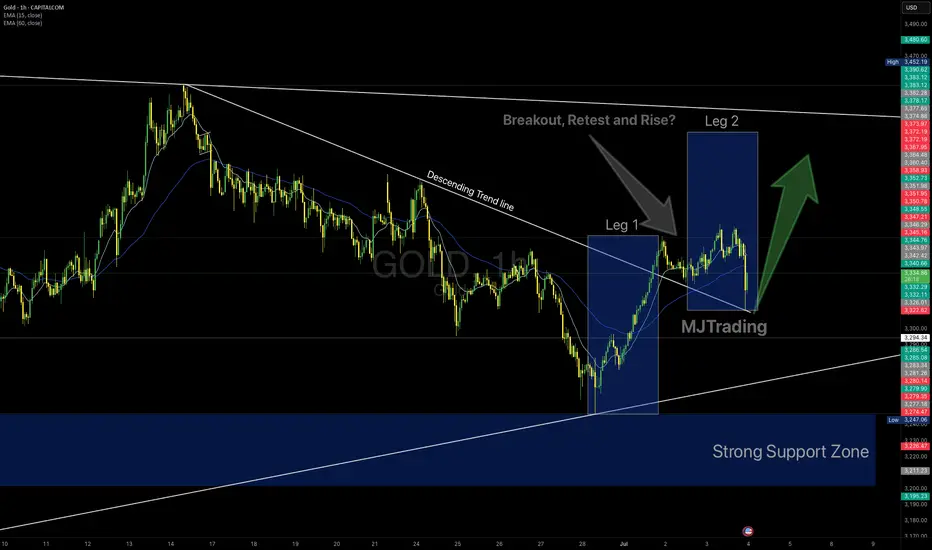
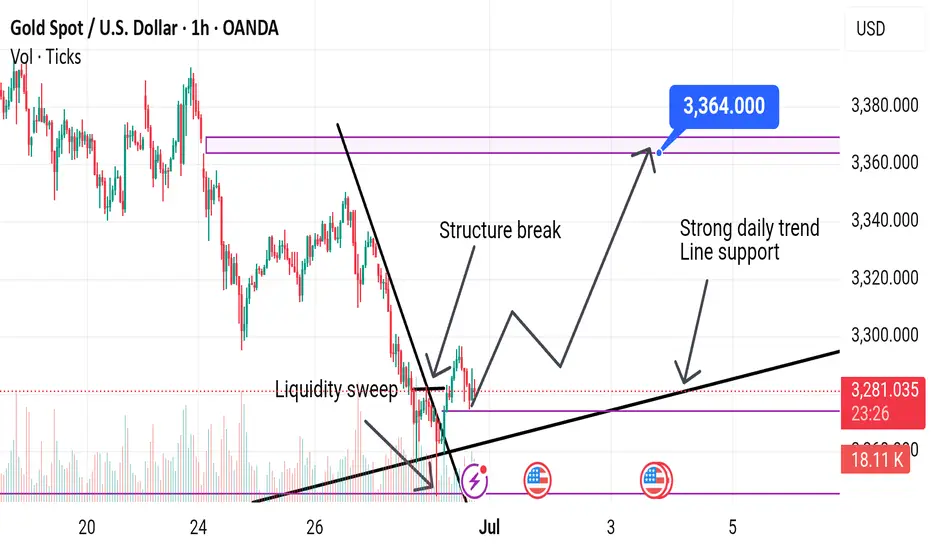
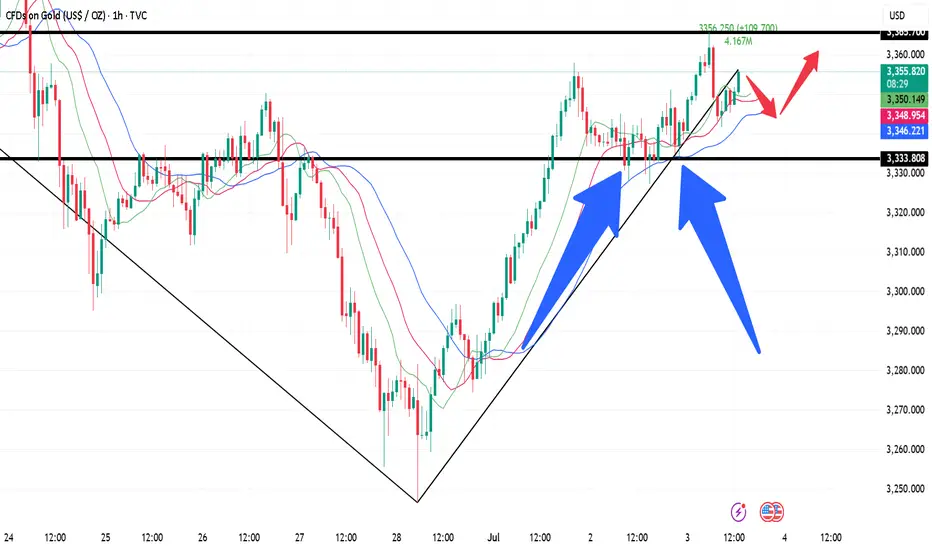
GOLD 1H – Breakout Retest or a Fragile Bullish Hope?👆🚀Boost it if you like it... (Thank you) 🚀👆
Gold has finally broken out above the descending trendline that has capped price for weeks. We’ve already seen Leg 1, an impulsive rally from the strong support zone, and a textbook retest of the broken trendline.
If bulls hold this level, a Leg 2 continuation could unfold.
Key Factors to Watch:
✅ Strong demand zone fueling the first leg up
✅ Clean breakout and retest of descending resistance
✅ Price still hovering around EMAs (15/60)
⚠️ However, the structure is fragile – lack of follow-through could trap late buyers
⚠️ If price loses the retest area decisively, sellers may reclaim control
Trading Insight:
This is a fascinating setup for bulls—but don’t fall in love with it. Stay adaptive. The market doesn’t owe us a second leg higher. Manage risk carefully and remember: probabilities, not certainties.
Trade Safely...
#MJTrading
#Gold #XAUUSD #TradingView #TechnicalAnalysis #BreakoutTrading #SupportResistance #PriceAction
Goes to 3400 and drop to 3000It can reach 3400 and then it will be rejected and come to 3000 dollars
So if you are thinking of investing this is not a good place. Let it come lower then enter at a better price
Daily live trade with XAUUSD in 15m/30m/1h 20250702Daily live trade with XAUUSD in 15m/30m/1h 20250702
Bullish in H1 time frame inside the D1 range Liquidity has been taken from the downside of the current daily timeframe range, and the price is likely to rise.
GOLD WATCH buy floor at 3200-3214 and the sell zone which will retest the broken ascending trendline is 3330-3345 zone

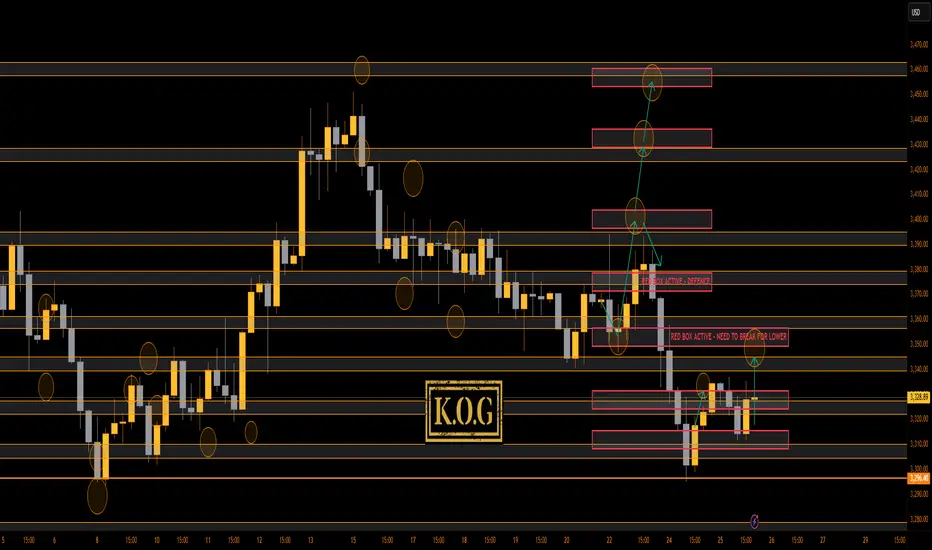
THE KOG REPORT - UpdateEnd of day update from us here at KOG:
A ranging day and honestly, very frustrating for traders due to the up and down which hasn't allowed us to really hold without ridiculous stop losses. We hit the target yesterday, we're still not retesting that low so those entries are still active, but we really need to see this break above the 3335 level to go higher.
For that reason, we will say if red box active continues to support the price we can look for this to go a little higher but that 3340-45 level is the one to watch. The daily has flipped for lower pricing so tomorrow a high may be put in before further declines.
As always, trade safe.
KOG
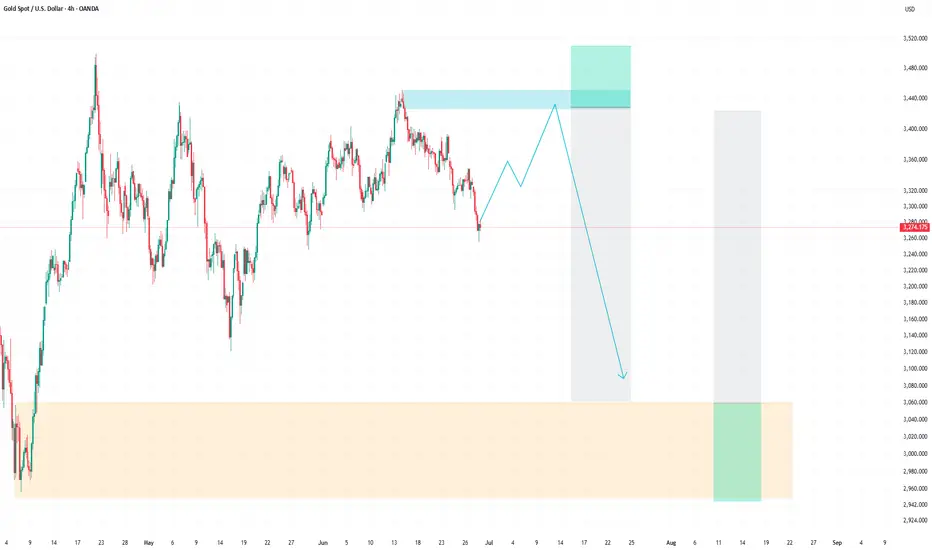
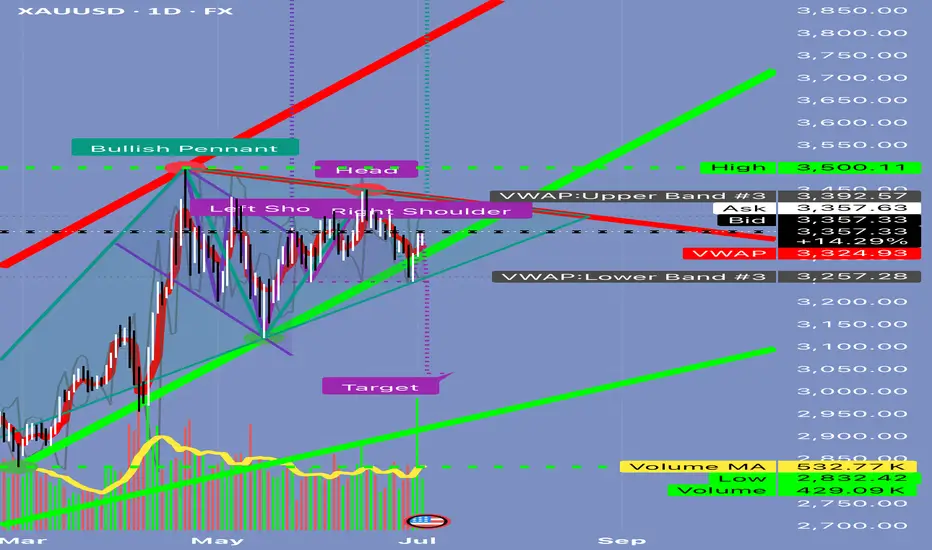
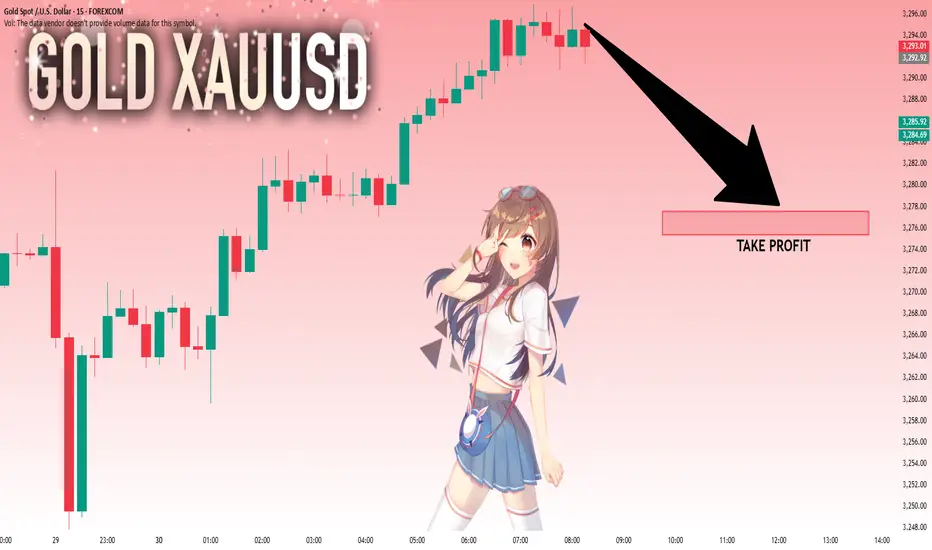
Can Gold Really Drop 10% in a Day?📘 EDUCATIONAL POST: Can Gold Really Drop 10% in a Day? Let’s Break It Down
Alright, traders—before you start thinking the sky is falling, let’s look this chart straight in the face and get real.
⸻
🔍 The Setup Right Now
Here’s what’s showing up:
✅ A bullish pennant forming up top (potential continuation higher).
✅ A big head and shoulders pattern in the middle (bearish).
✅ VWAP bands ranging from ~3,257 to ~3,392.
✅ Volume is underwhelming—426k vs 582k average.
✅ A big target line all the way down near 3,000.
This mix of signals can be confusing. Let’s separate the hype from what’s actually possible.
⸻
🎯 Q: Can the market collapse to 3,000 tomorrow?
Short Answer:
No.
Here’s Why:
1️⃣ Move Size:
• Current price is ~3,357.
• Target is ~3,000.
• That’s a -357 point drop (~10.6%) in one session.
• For gold CFDs, this would be an extreme event only seen in major crises (think 2008 or March 2020).
2️⃣ Volume Context:
• Today’s volume is below average.
• Big crashes are usually preceded by heavy distribution—this isn’t showing yet.
3️⃣ VWAP Anchors:
• The lower VWAP band sits at 3,257.
• Reaching 3,000 would require breaking through 3,257 support, 3,100, and months of prior buying interest.
4️⃣ Market Environment:
• It’s the July 4th holiday in the U.S.—liquidity is thin.
• Thin markets can gap lower but rarely hold a massive drop without a big catalyst (e.g., credit crisis, war headlines).
5️⃣ Pattern Confirmation:
• Yes, the head and shoulders pattern is visible.
• But to confirm it, you need:
🔹 A clear break of the neckline with double average volume.
🔹 Follow-through that pushes below 3,257.
• None of this has happened yet.
⸻
✅ What’s Realistically Possible Tomorrow?
If sellers show up, here’s what a big bearish day might look like:
1️⃣ First Move:
• Rejection at 3,357–3,392 resistance.
• Pullback toward ~3,324 (mid VWAP).
2️⃣ Continuation:
• Drop down to ~3,257 (VWAP lower band).
3️⃣ Extreme Scenario:
• Retest of 3,200–3,150 zone.
But a flush all the way to 3,000?
👉 Highly unlikely unless there’s a major global shock.
⸻
💡 Trading Tip: Stay Tactical
If you want to position short:
✅ Wait for rejection at 3,357–3,392.
✅ Short targeting 3,324 first.
✅ Scale profits there.
✅ Only hold runners for 3,200–3,150 if momentum accelerates.
⸻
🔑 Key Takeaway
3,000 is a structural target—this means it’s a price objective that might play out over weeks, not hours.
Trying to catch that in one day is chasing a black swan.
Stay patient. Trade levels, not headlines.
⸻
⚠️ Disclaimer:
This post is for educational purposes only. Always do your own research before trading.
⸻
✅ If you found this helpful, share it with someone who panics every time a red candle shows up.
Gold sell ideaGold is rebounding after sweeping Friday's low liquidity, driven by a weak dollar. Despite the upside move, the 1-hour structure remains bearish. We anticipate a potential false breakout above $3,307.00 followed by a sell-off back to the $3,271.00 lows. If the bulls can regain control, gold may bounce back and resume its growth. However, failure to do so could lead to a decline towards the $3,245 support level
7.1 London gold rebounds and rises, gold market trend analysis aGold rose to 3295 in the Asian session on Monday and was blocked. It fell in the European session as we expected, but the decline was not strong. After the lowest price of 3274.57, it rose again in the US session and stood firmly at the 3300 mark. The monthly line closed with a cross Yang K. The gold price continued to rise at the opening today. After the market on Monday, the 3247 below can be used as a reference for the bottom rebound position. Now the short-term trend belongs to the bulls, so we will continue this trend today and look at the upward trend first, wait for the European session to see the strength of the decline and then formulate the idea of the US session.
From the market point of view, after the gold price stood above the 3300 mark again, it is used as a short-term support level reference for the bulls. The Asian session can rely on this position to arrange long orders to see the continuation of the upward trend; the initial pressure on the upper side focuses on the 3328 position, followed by 3345. Now that the idea is established, the idea for intraday operations is: wait for the gold price to pull back to around 3308 in the Asian session and then go long and bullish, protect the 3300 mark, and target around 3328; if there is pressure at 3328 in the European session, you can arrange short positions with a downward trend, wait for the US session, and then decide whether to go long again based on the pullback position and target around 3345.

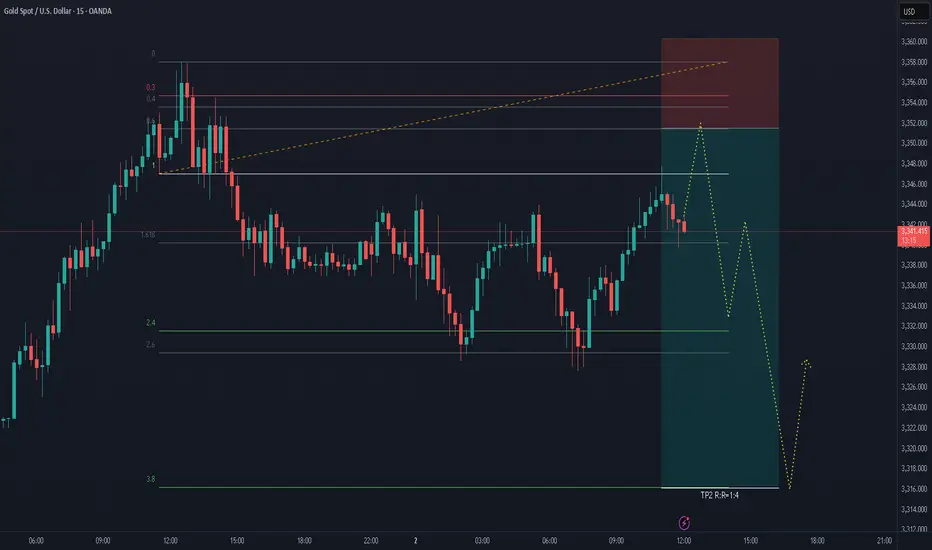
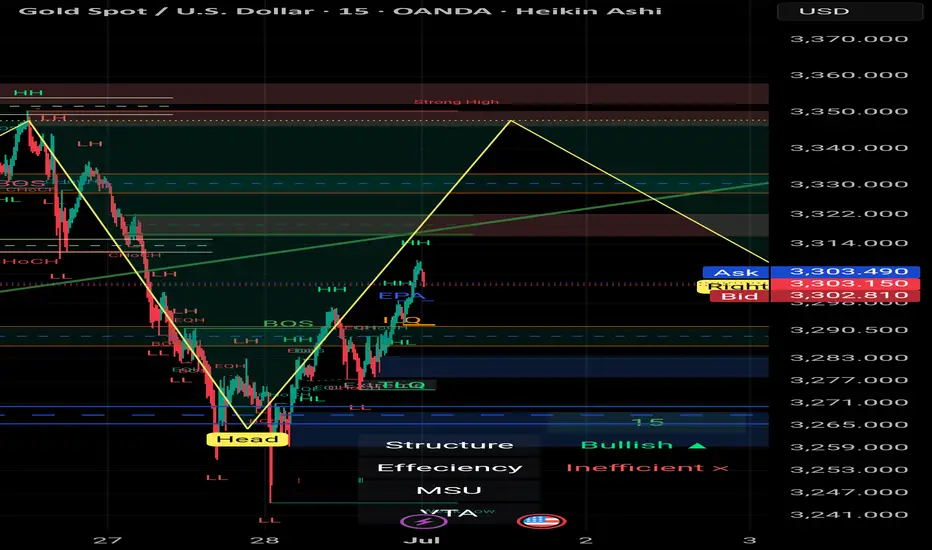
Gold Market Outlook – 1st of July | XAU/USD | 30min | by Mohsen # Gold Market Outlook – 1st of July | XAU/USD | 30min | by Mohsen Mozafari Nejad
🔸 **Instrument:** Gold Spot / USD (XAU/USD)
🔸 **Timeframe:** 30min
🔸 **Methodology:** Smart Money Concepts (SMC) + Liquidity + OB + Market Structure
🔸 **Focus:** New Monthly Open Setup
---
## 🔍 Market Context:
- **Structure:** Bullish on LTF (MSU)
- **Efficiency:** ✅ Clean & Efficient Delivery
- **Recent Activity:** Reverse H&S completed + double BOS + CHoCH confirmed
- **Price Level:** Trading near key Supply zone (3300–3315)
- **Monthly Context:** July begins with bullish momentum & previous session showed aggressive buy-side pressure
---
## 🧠 Technical Breakdown:
1. **Strong recovery** after clearing deep liquidity sweep (Head zone)
2. **Bullish BOS** structure confirmed on LTF → Multiple HH and HL formed
3. Price now testing **Key Supply/OB zone at 3300–3315**
4. Above this zone lies a **Strong High (SH) around 3,350**, a potential liquidity magnet
5. Overall bias is bullish unless strong rejection appears from upper OB
---
## 📌 Trade Plan:
| Position | Entry Confirmation Zone | Stop Loss (SL) | Take Profit (TP) |
|----------|--------------------------|----------------|------------------|
| Long | Above 3,303–3,310 (structure hold) | Below 3,294 | TP1: 3,325 / TP2: 3,340 / TP3: 3,348 |
| Short (scalp only) | Bearish reaction from 3,345–3,350 | Above 3,353 | TP1: 3,310 / TP2: 3,290 |
---
## ⚠️ Risk Factors to Watch:
- 🔺 High-impact USD news (July 1st releases: Manufacturing PMI / employment preview)
- 🔺 Overextension above supply zone without support → trap risk
- 🔺 Bull trap risk if price spikes above 3,340 then sharply reverses
---
## ✅ Summary:
> **Start of July** could fuel volatility and directional momentum.
> The structure is clearly bullish short-term, but upper liquidity zones remain **highly reactive**.
> Smart traders will wait for reaction at the 3,340–3,350 SH zone before overcommitting.
**Structure:** 🟢 Bullish
**Trend:** 📈 MSU
**Efficiency:** ✅ Clean
**Liquidity:** 🔺 Above SH & Below recent HL
---
📊 Prepared by: **Mohsen Mozafari Nejad**
Next Week Aims for 3300 Break💎 Last week, gold opened gap-up on Monday 🔼 but then trended lower 🔽. However, the 3290-3300 support zone remained robust from Mon-Thu ⚡. It plunged to ~3255 on Fri before rebounding 🌱. Next week's open may surge to 3290-3300 🔥!
🚀 Sell@3260 - 3270
🚀 TP 3280 - 3290 -3300
Accurate signals are updated every day 📈 If you encounter any problems during trading, these signals can serve as your reliable guide 🧭 Feel free to refer to them! I sincerely hope they'll be of great help to you 🌟 👇
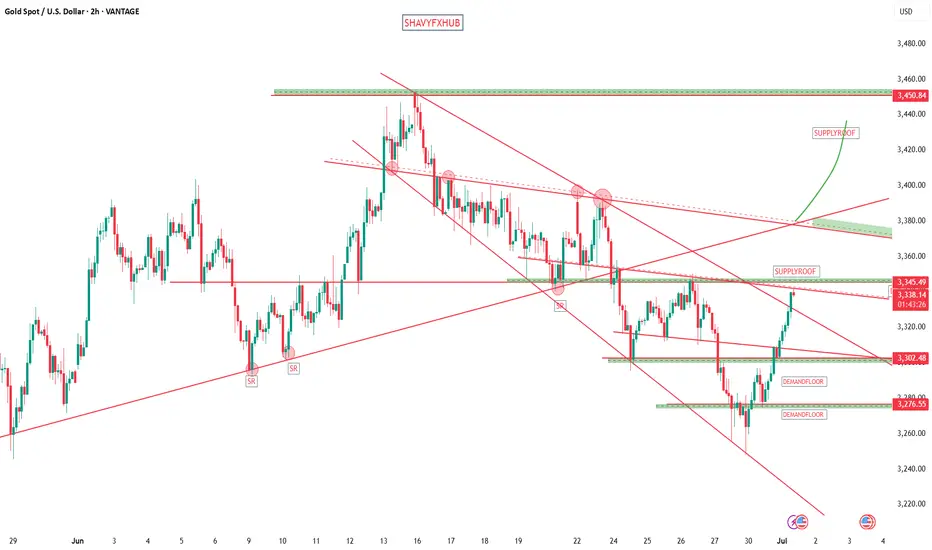
GOLD GOLD ,EARLY SELL signal 3341-3345 2hr supply roof a previous neckline of a broken double top in the form of a descending trendline ,the restest is 3341-3345.
my goal is 3378-3380 supply zone
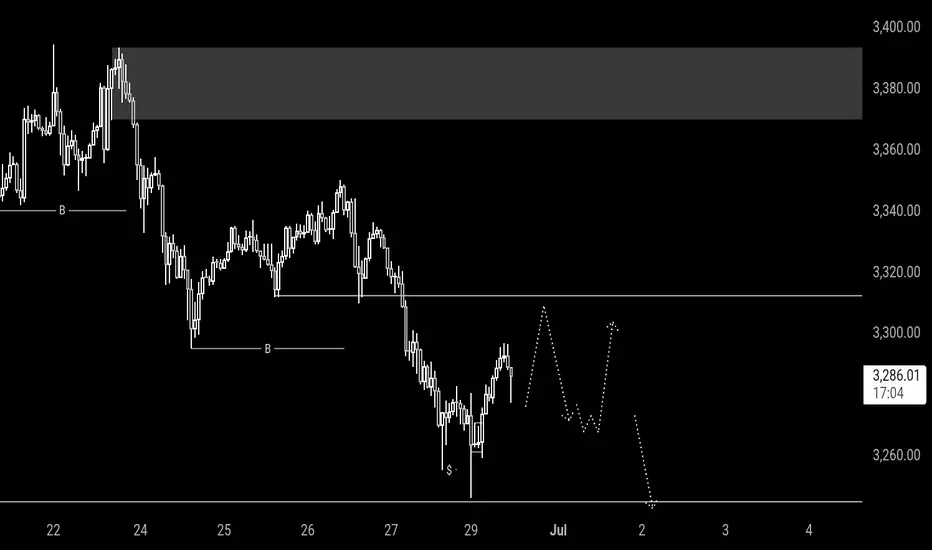
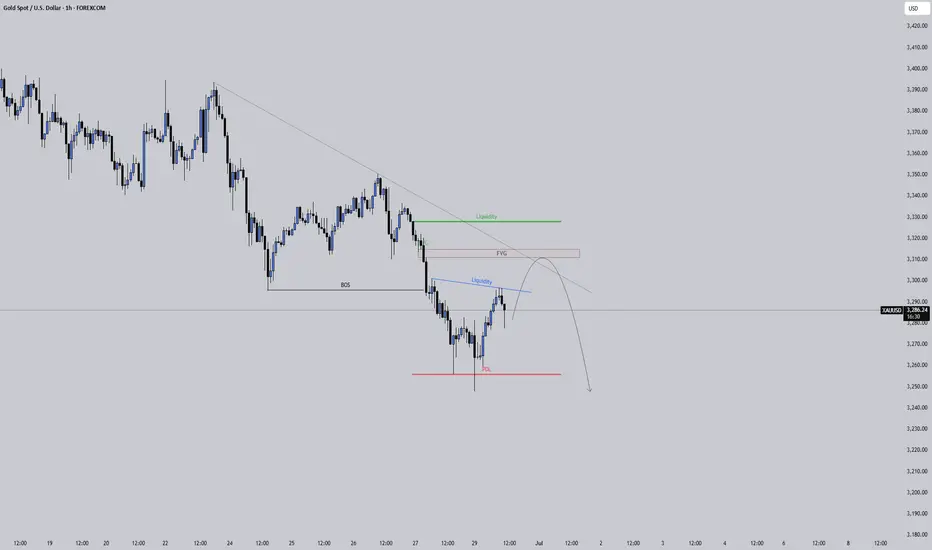
Watching Gold Tap Liquidity Before the Next DropGold is still clearly in a bearish structure on the 1 hour chart. We’ve seen a solid break of structure to the downside and price is now retracing.
What stands out is how price is pushing back up into multiple areas of interest. There’s liquidity resting just above this minor high along with a fair value gap and the underside of a bearish trendline. This cluster makes it a likely spot for sellers to step back in.
If price fills the imbalance around that FVG, it could set up the next leg lower. I’ll be watching closely for signs of rejection in this zone to see if the market is ready to continue the move down.
No reason to rush in early. Let price come to the levels that matter and confirm with a reaction. Staying patient pays.
GOLD: The Market Is Looking Down! Short!
My dear friends,
Today we will analyse GOLD together☺️
The in-trend continuation seems likely as the current long-term trend appears to be strong, and price is holding below a key level of 3,295.36 So a bearish continuation seems plausible, targeting the next low. We should enter on confirmation, and place a stop-loss beyond the recent swing level.
❤️Sending you lots of Love and Hugs❤️
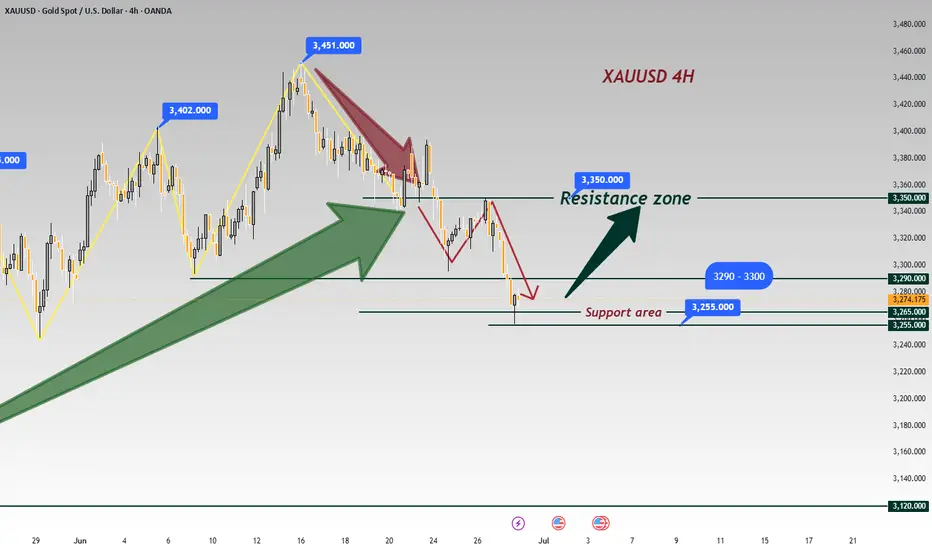
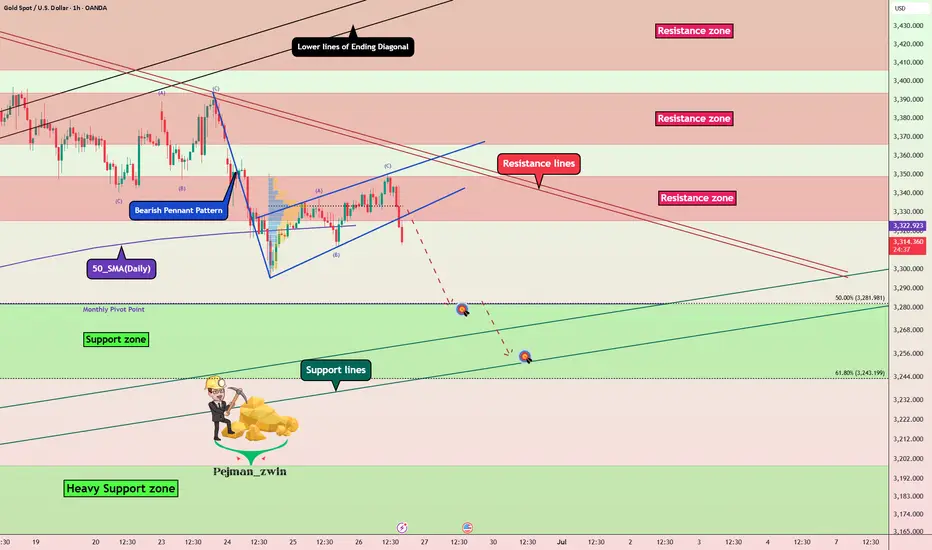
Gold Breakdown Confirmed — Bearish Pennant Targets UnfoldingGold ( OANDA:XAUUSD ) started to decline as I expected in my previous idea after the lower lines of the Ending Diagonal broke .
Gold is moving near the Resistance zone ($3,349-$3,325) . And Gold seems to be crossing the 50_SMA(Daily) .
From a Classical Technical Analysis perspective , the Bearish Pennant Pattern seems to indicate a continuation of the downtrend in Gold .
From an Elliott wave theory perspective , it seems that Gold has completed the Zigzag Correction(ABC) , and we can expect the next 5 downwaves .
I expect Gold to continue to decline at least to the Support zone($3,281-$3,243) and Monthly Pivot Point .
Note: Stop Loss (SL) = $3,360
Gold Analyze (XAUUSD), 1-hour time frame.
Be sure to follow the updated ideas.
Do not forget to put a Stop loss for your positions (For every position you want to open).
Please follow your strategy; this is just my idea, and I will gladly see your ideas in this post.
Please do not forget the ✅ ' like ' ✅ button 🙏😊 & Share it with your friends; thanks, and Trade safe.
7.3 Prediction of gold price fluctuation before non-agriculturalAfter the release of ADP data last night, gold prices resumed their rise and crossed the high of 3357.88 this week and closed near this position. Today, gold prices opened high and then fell back. Pay attention to the strength of the correction in the morning session and choose the opportunity to go long and bullish. From the current market perspective, the support below can focus on the low point of yesterday's US session near 3333, followed by 3327; before the release of non-agricultural data, the upper pressure will focus on the early trading start point 3366, followed by 3375. The operation in the Asian and European sessions is mainly to go long on the correction, and the high-altitude thinking is abandoned. Specific operation ideas: Go long and bullish when the gold price falls back to around 3338, protect the position of 3330, and the target is to see whether the early trading high of 3365 can break!
Daily live trade with XAUUSD in 15m/30m/1h 20250703Daily live trade with XAUUSD in 15m/30m/1h 20250703