XAUUSD /GOLD M15 Chart Gold buy 🚀💯
* Entry: ~3342 📊
* Take Profit: ~3348
* Take Profit: ~3357
* Stop Loss: ~3335
XAUUSDK trade ideas
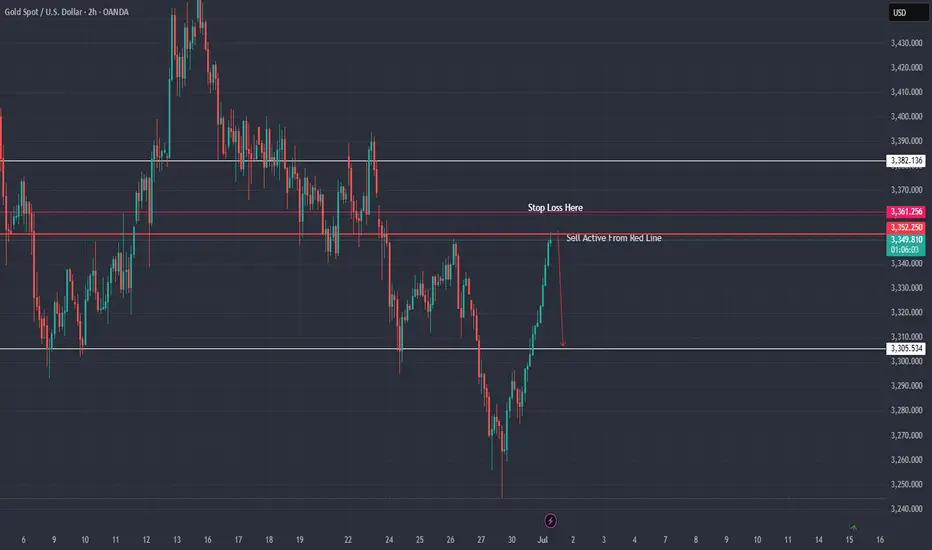
XAU / USD 2 Hour Chart Hello traders. I decided to take a small Sell position marked by the red line on the chart. My stop loss is also set. I am using a micro lot size so nothing crazy in case is does not go my way. Let's see if the NY open corrects the overnight's move up. Big G gets a shout out. Be well and thanks for checking out my trade.
GOLD trading GOLD requires multiple broker chart ,on different time frame candle closes are not the same.in trading every candle type have a specific meaning and the wicks and rejection represent the emotion of trade and tell a story about a particular level.
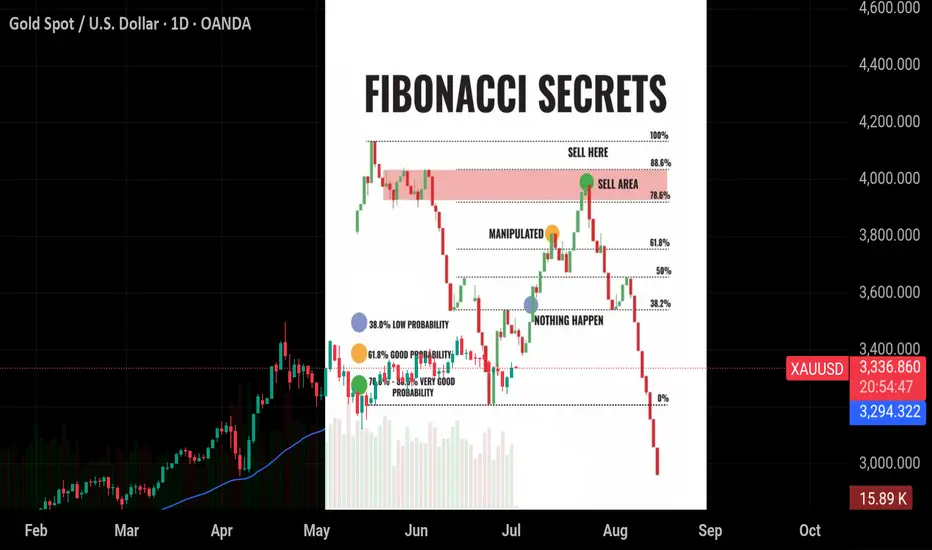
Fibonacci Secrets for Traders!
🔵 38.2% - Low Probability:
Not much happens here. Ignore this level.
🟠 61.8% - Good Probability:
A common level where price reacts. Watch for reversals.
🟢 78.6%-88.6% - Very Good Probability:
The “Sweet Spot” or Sell Zone – high chance of price reversing.
🟡 Manipulation:
Price might fake out around 61.8% before hitting the Sell Zone.
💡 Focus on the 78.6%-88.6% levels for the best trades, but always confirm with other tools.
Stay sharp and trade smart! 📈
#Educational
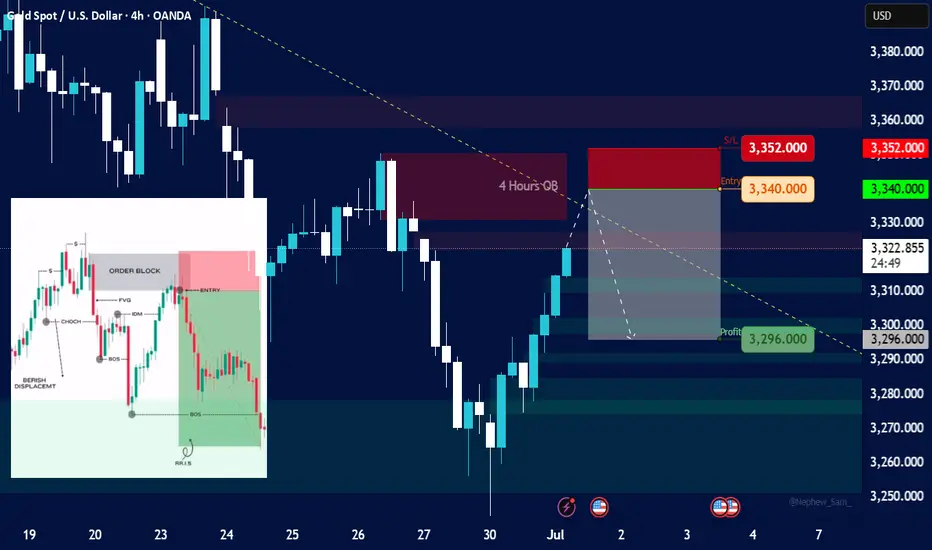
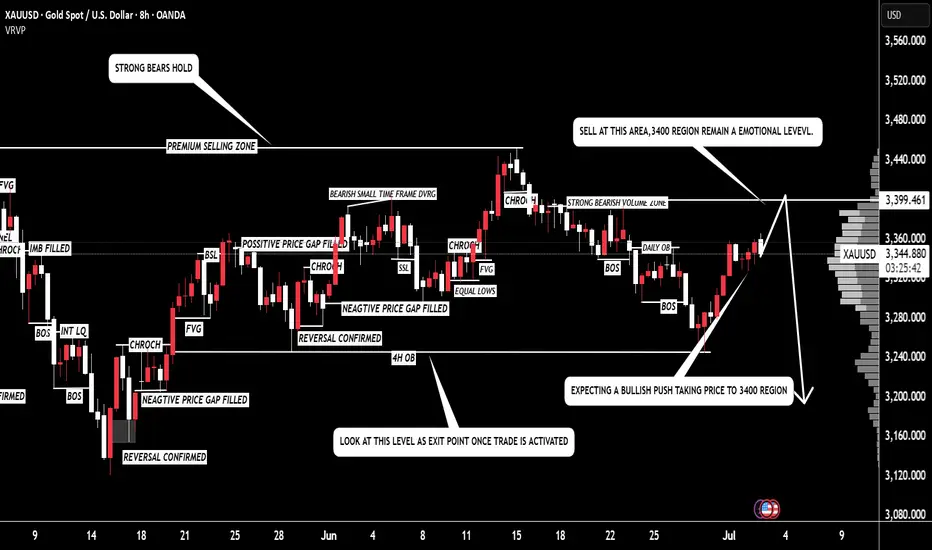
GoldHere's an analysis based on the information presented in the image:
Overall Market Structure (from a quick glance):
Recent Price Action: The price has recently experienced a significant decline, followed by a bounce.
Order Block (OB): There's a clearly marked "4 Hours OB" (Order Block) which is a key area of interest for potential resistance.
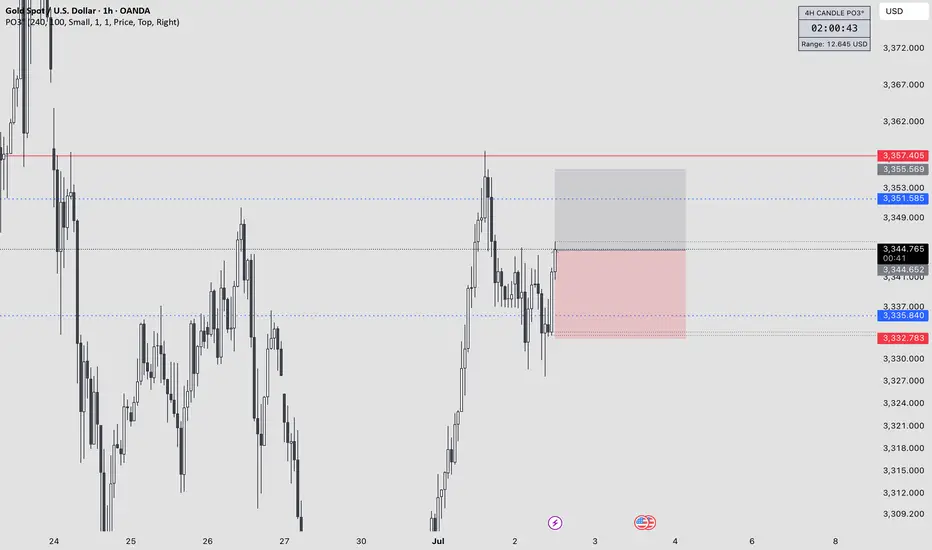
Potential Trading Setup:
Entry: The "Entry" price is set at 3,340.00. This entry point is within the bearish order block, suggesting a short (sell) position.
Stop Loss (S/L): The "S/L" is placed at 3,352.00. This is above the high of the 4-hour order block, aiming to limit losses if the price moves against the short position and breaks above the resistance.
Take Profit (Profit): The "Profit" target is set at 3,296.00. This target is significantly lower than the entry, aiming to capture a downward movement.
Risk-Reward Ratio:
Risk: The difference between the entry (3,340.00) and the stop loss (3,352.00) is 12 points.
Reward: The difference between the entry (3,340.00) and the take profit (3,296.00) is 44 points.
Ratio: This implies a risk-reward ratio of approximately 1:3.67 (44 / 12), which is generally considered favorable.
Key Technical Concepts Illustrated (from the inset image):
The smaller inset image on the left illustrates concepts commonly used in Smart Money Concepts (SMC) or Institutional Order Flow (IOF) trading:
Order Block (OB): A price range where significant institutional buying or selling occurred, often leading to price reversals. The red box indicates a bearish order block.
Entry: The point at which a trade is entered.
FVG (Fair Value Gap) / Imbalance: An area on the chart where price moved quickly in one direction, leaving an "inefficiency" or gap that price often retests.
CHoCH (Change of Character): An early sign of a potential trend reversal, indicating a shift in market sentiment.
BOS (Break of Structure): When price breaks a significant high (for a bullish trend) or low (for a bearish trend), confirming the continuation or reversal of a trend. The multiple "BOS" labels suggest a series of lower lows, confirming a bearish trend.
BERISH DISPLACEMENT: Implies strong bearish momentum leading to lower prices.
PRLII S: This specific acronym is not universally recognized but could refer to a specific pattern or setup within the trader's methodology, possibly related to liquidity or price action.
Conclusion/Potential Interpretation:
The chart suggests a bearish outlook for XAUUSD, with the trader looking to short Gold at the retest of a 4-hour bearish order block. The setup has a favorable risk-reward ratio. The concepts in the inset image provide a theoretical framework for why this particular entry and targets might be chosen, based on institutional trading principles. The current price is at 3,322.285 at 08:33:38 +04, which is below the proposed entry, suggesting this might be a setup that the trader is waiting to happen or a retrospective analysis of a potential trade idea.
XAUUSD 01.07.2025-Formation of the market:
On the background of general cooling of geopolitical situation gold continues its fall to the levels of 3250. The main preference of market participants is now given to less "conservative" assets, which is clearly reflected in the record values of cryptocurrency and stock market.
-Forecast:
In the medium term, capital outflows are likely to continue and the asset will again test the 3250 level as support.
-News Background:
There will be many "strong" news releases this week that could be a strong driver of movement for the asset:
Today:
-ISM Manufacturing PMI and JOLTS Job openings.
Thursday:
Unemployment rate, and Non-Farm Payrolls.
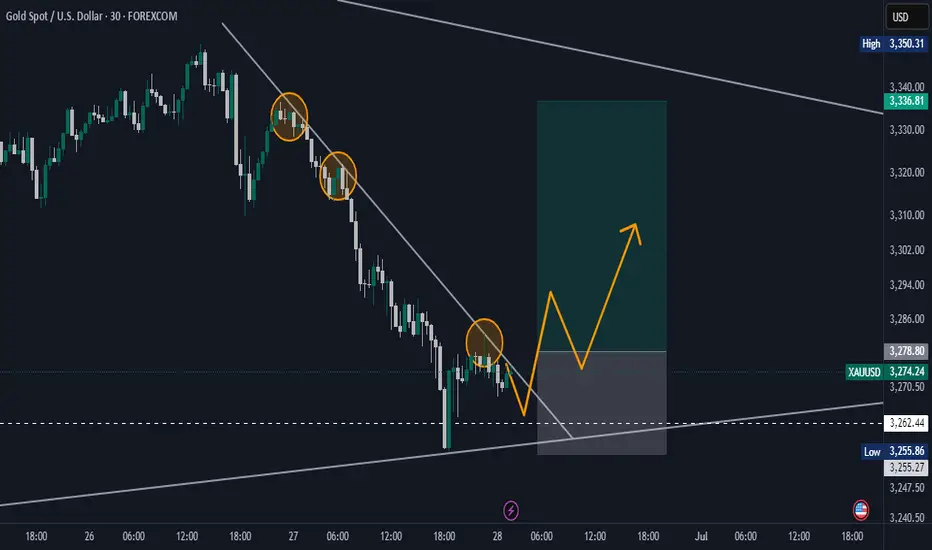
Gold Trendline Breakout: Momentum Building or Fakeout Risk?Gold has just snapped a key trendline that’s been holding price in check. This breakout could signal a shift in market structure and possibly open the door for a bullish continuation. I'm eyeing confirmation above the breakout zone with volume expansion to validate the move. Short-term targets are aligned with previous resistance levels, while support has shifted upward.
Happy Trading :)

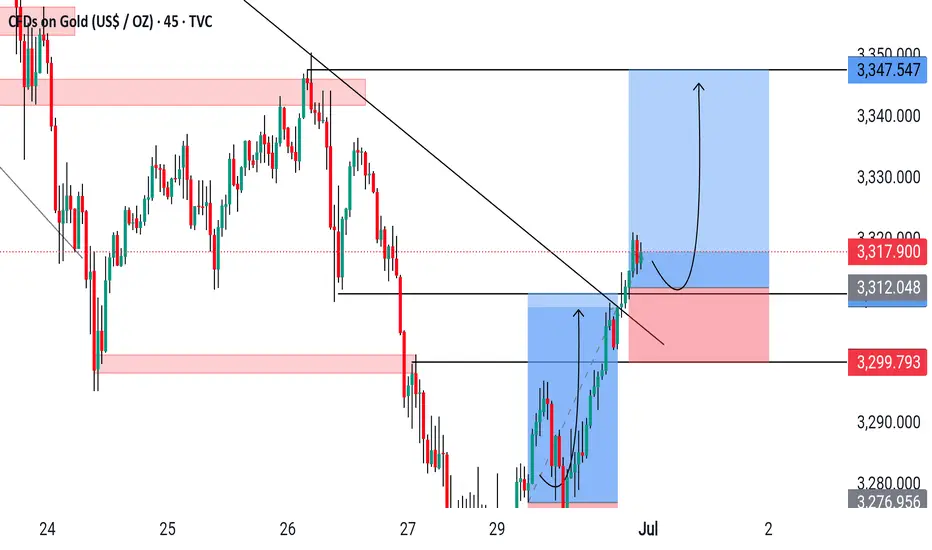
XAUUSD/ GOLD M45 OUTLOOK XAUUSD 45M 🚀
Trendline broken — bulls in control!
Above 3317, aiming for 3349+
SL: 3296 🔒 | TP: 3349 🎯
Stay sharp, lock profits! ⚡️✨
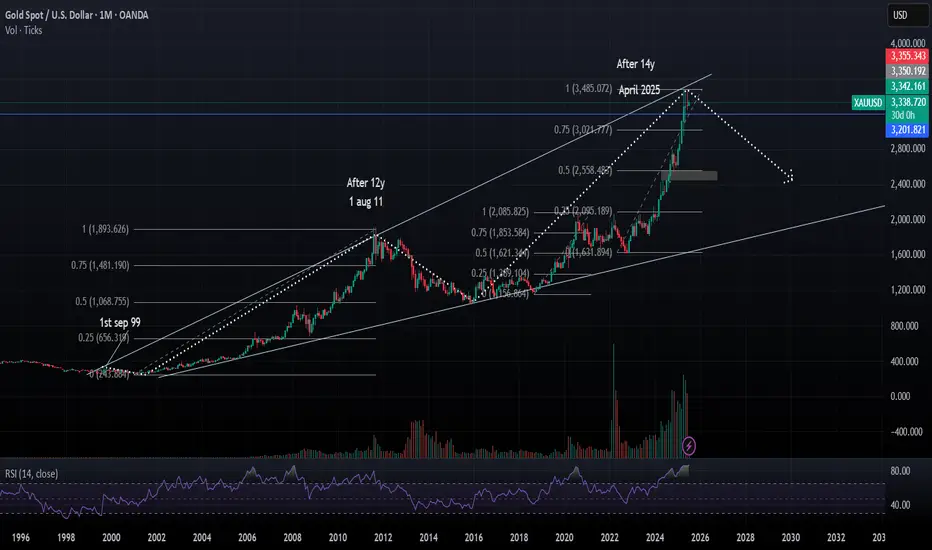
Major Reversal Ahead?14-Years Cycle complete in April2025Description:
Gold (XAUUSD) has completed a significant 14-year cycle with the recent peak near $3,485 in April 2025, following a similar 12-year rally pattern that previously ended in August 2011.
The price is now showing signs of exhaustion:
RSI on the monthly chart is extremely overbought (85.91), matching historical reversal levels.
Strong Fibonacci confluence at 1.0 extension ($3,485) suggests a possible cycle top.
Historical symmetry: Prior major top in 2011 came 12 years after the breakout in 1999 — this move mirrors that with a 14-year cycle.
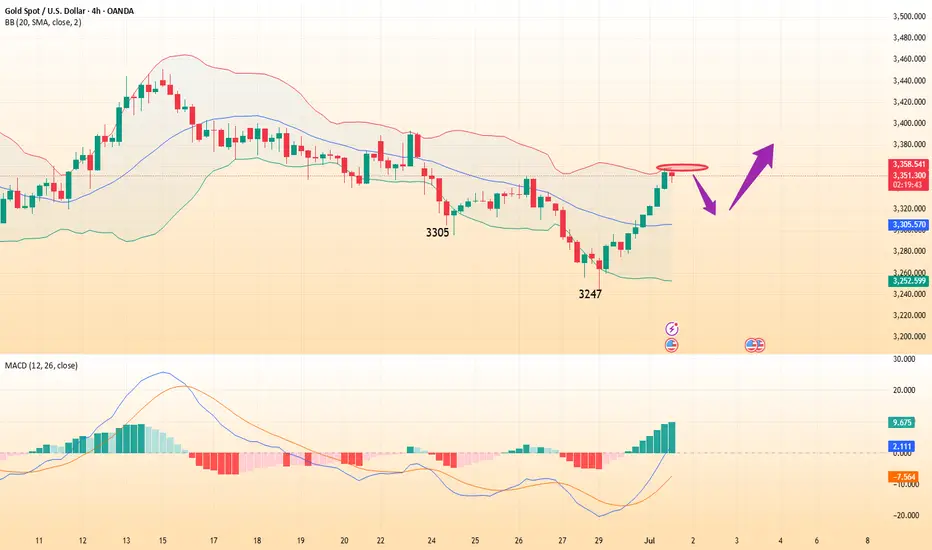
International gold prices rise slowly and reach new highsAnalysis of gold trend:
Gold fell sharply near 3247 at the opening of Monday, then stopped falling and began to fluctuate and rise slowly. It rose to a high of 3297 before the European session, then fell back after being blocked. After dropping to 3274, it stabilized again and began to rise slowly. The US session continued to rise. Another key point in the market that everyone needs to pay attention to is that the US dollar index has now hit a new low, and the current price is 96.3. This wave of US dollar decline is extremely weak, and there is basically no sign of rebound. According to this trend, the US dollar index may continue to fall, and it is possible to go to 88. In the case of such a weak US dollar index, it is natural for gold to be supported by the market. Moreover, gold has not yet walked out of the bullish trend. Gold has turned from weakness in the early stage to strength. Next, it depends on the strength of the rise. This wave of rise is expected to see 3350-3400.
From a technical point of view, gold closed positive at a low level on Monday, and the K line was above the lower Bollinger track, turning from weak to strong. Under the bullish trend, the rise can be seen to be continuous, so the high points of the middle and upper Bollinger tracks can be seen above. In the 4-hour chart, the K-line stands firmly above the middle rail of Bollinger, and the moving average system diverges upward, showing a very obvious strong performance. Therefore, the basic idea this week is to continue to do more on the decline. In the short term, first look at the upper rail of Bollinger in the 4-hour chart at 3350. There are two points to pay attention to in the decline of the small cycle within the day, one is 3300, and the other is 3285 support. Although bullish, do not chase high. After the decline, make sure to stop the decline and continue to be bullish. Operation strategy: Go long when gold falls back to around 3320, stop loss at 3210, and target 3330-3340.
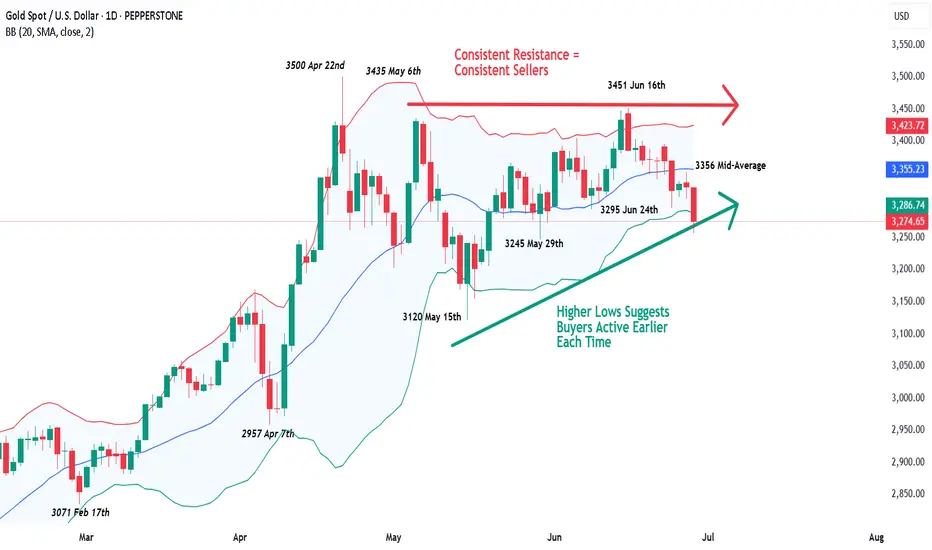
Gold – Can It Recover From 3 Week LowsGold is back in focus this morning after it fell to a 3 week low at 3287 in early European trading.
Part of the reason for the fall may have been the on-going ceasefire agreement holding between Israel and Iran, which can reduce the need for Gold as a safe haven, or prices may have been influenced by comments from US Commerce Secretary Lutnick made to Bloomberg TV overnight which suggested that the Trump administration have plans to reach agreements with a set of 10 major trading partners ahead of the July 9th pause deadline to reinstate higher tariffs.
Of course, these potential Gold negatives need to be balanced against the potential positives of increased optimism in recent days that the Federal Reserve may cut interest rates by more than expected into the end of 2025 as the US economy stalls, and the US dollar printing a fresh 3 year low yesterday.
Looking forward, the release of the Fed’s preferred inflation gauge, the PCE Index at 1330 BST later today could hold the key to whether Gold falls below support to even lower levels (see technical section below) or moves back higher again into Friday’s close.
Whatever the outcome, its setting up for an interesting end of the week for Gold.
Technical Update:
With selling pressure developing in Gold again so far this morning, traders might well be searching for next support levels that may be successful in limiting current price declines, or if broken, could in turn lead to a more extended phase of weakness.
Much will depend on future price trends and market sentiment, but as the chart above shows, latest price activity is this morning posting new 3-week lows for Gold. This suggests traders might now be focused on 3245, equal to the last correction low in price posted on May 29th as the next possible support level.
While not a guarantee of further declines if broken, 3245 closing breaks could lead to further price weakness towards 3120, the May 15th downside extreme.
Of course, it is possible this 3245 low does continue to act as support to price weakness and may turn activity higher again. However, if this is to lead to a more sustained period of price strength, resistance might now stand at 3356.
Equal to the Bollinger mid-average, closing breaks might be required to suggest possibilities to resume price strength back towards the 3435/3452 May 6th and June 16th price failure highs.
The material provided here has not been prepared accordance with legal requirements designed to promote the independence of investment research and as such is considered to be a marketing communication. Whilst it is not subject to any prohibition on dealing ahead of the dissemination of investment research, we will not seek to take any advantage before providing it to our clients.
Pepperstone doesn’t represent that the material provided here is accurate, current or complete, and therefore shouldn’t be relied upon as such. The information, whether from a third party or not, isn’t to be considered as a recommendation; or an offer to buy or sell; or the solicitation of an offer to buy or sell any security, financial product or instrument; or to participate in any particular trading strategy. It does not take into account readers’ financial situation or investment objectives. We advise any readers of this content to seek their own advice. Without the approval of Pepperstone, reproduction or redistribution of this information isn’t permitted.
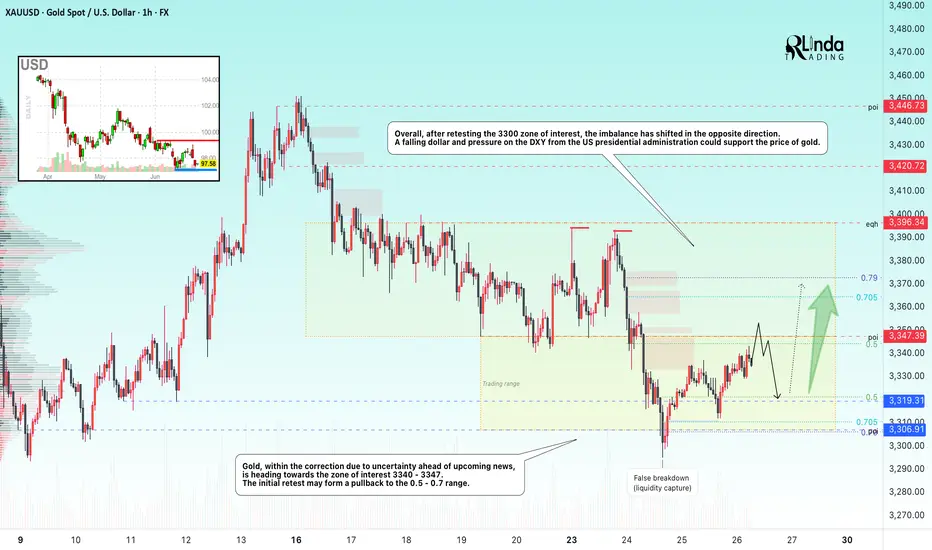
GOLD → Within range. Retest resistance at 3347FX:XAUUSD continues to correct after a false breakdown of support at 3300. Due to uncertainty, the price may remain in the range of 3300-3340 for some time.
Gold is fluctuating amid a weak dollar and uncertainty over Fed rates. Gold is struggling to hold on after rebounding from weekly lows, despite the US dollar falling to multi-year lows. Pressure on the dollar has intensified due to Trump's criticism of the Fed and rumors of a possible replacement for Powell. However, gold is limited in its growth due to a pause in geopolitical tensions and hawkish signals from the Fed chair. Investors are awaiting key macro data from the US (e 12:30 GMT Durable goods orders, GDP, Initial Jobless Claims) and especially the PCE inflation report on Friday.
Technically, the focus is on key areas of interest: 3300, 3306, 3340, 3347. Until strong news emerges, an intraday trading strategy should be considered.
Resistance levels: 3347, 3357
Support levels: 3320, 3307, 3300
Technically, a false breakout of resistance at 3347 and a retest of the local liquidity zone at 3320-3307 are possible before growth continues for the reasons mentioned above. Targets could be 3347, 3364, 3372, and 3396.
Best regards, R. Linda!
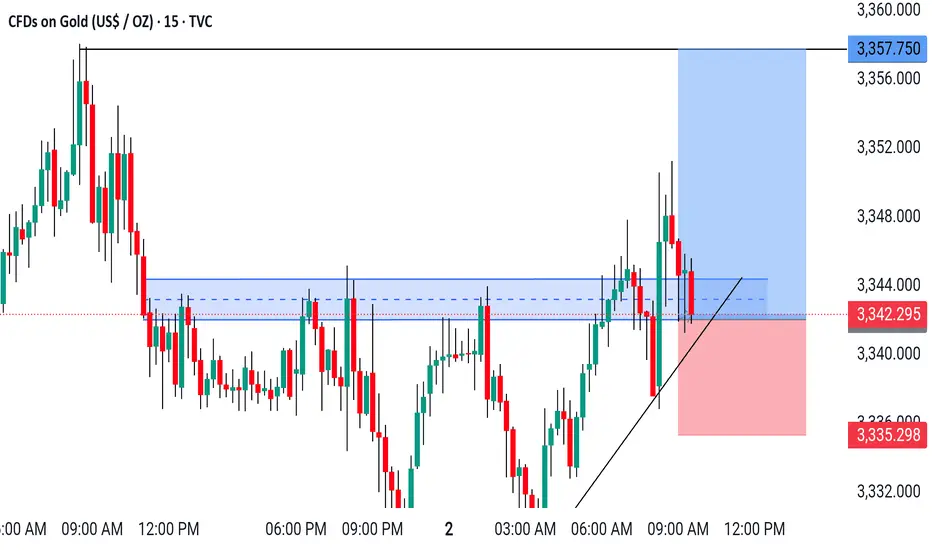
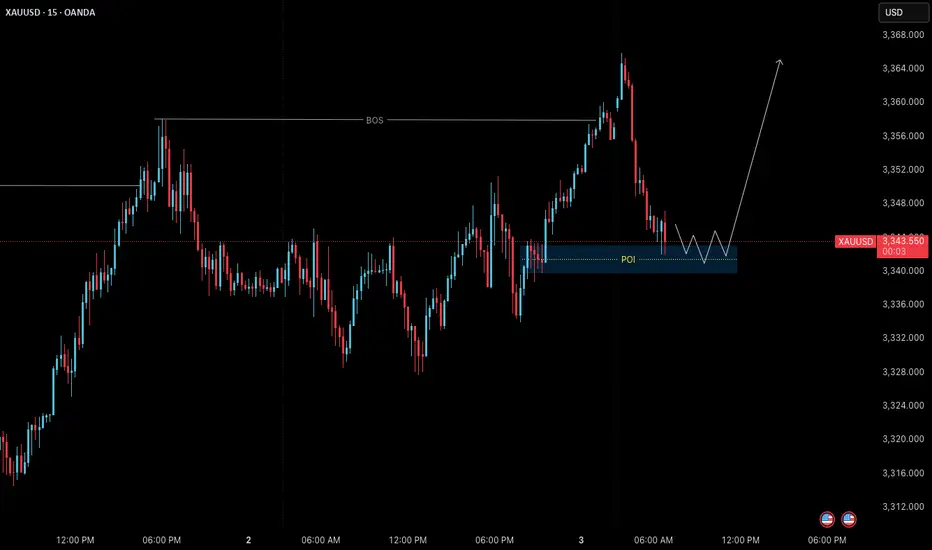
XAUUSD – July 3 Live Setup | Price at M15 POIGold has been moving in line with our bullish bias over the past few sessions.
Yesterday’s break above the 3358 M15 level gave us a clean Break of Structure (BoS) — confirming short-term bullish momentum within the larger framework.
After this strong push upward, the market is now retracing.
Price is currently entering a high-probability pullback zone: 3340–3342 (M15 POI).
This is a textbook base structure setup — where we wait for price to return to a valid zone after structure shift, and only act after confirmation on the lower timeframe.
🔍 Setup in Play:
Current Bias:
• M15 Trend: Bullish
• H4 Context: Bullish (after recent HTF shift)
• Market State: Pullback phase after BoS
Key Zone in Focus:
• 3340–3342 – M15 POI (zone of interest for continuation)
We are not entering blindly .
We are waiting for confirmation on M1 — specifically:
✅ ChoCh (Change of Character)
✅ Followed by a micro BoS
Only then do we consider a long entry — and even then, risk must be managed through proper R:R and structure anchoring.
🎯 Target:
If M1 confirmation occurs, the expected short-term target is 3365 — the next clean M15 structural high.
⚠️ Risk Conditions:
If price breaks below the POI without M1 confirmation — or aggressively violates the zone — the setup is invalid.
In that case, we simply step aside and reassess.
This is process-driven execution:
No need to predict.
No need to chase.
Just observe, confirm, and execute with structure.
📖 This is how we let the chart do the work.
The process protects us.
Structure invites us.
Stillness refines us.
📘 Shared by @ChartIsMirror
Author of The Chart Is The Mirror — a structure-first, mindset-grounded book for traders
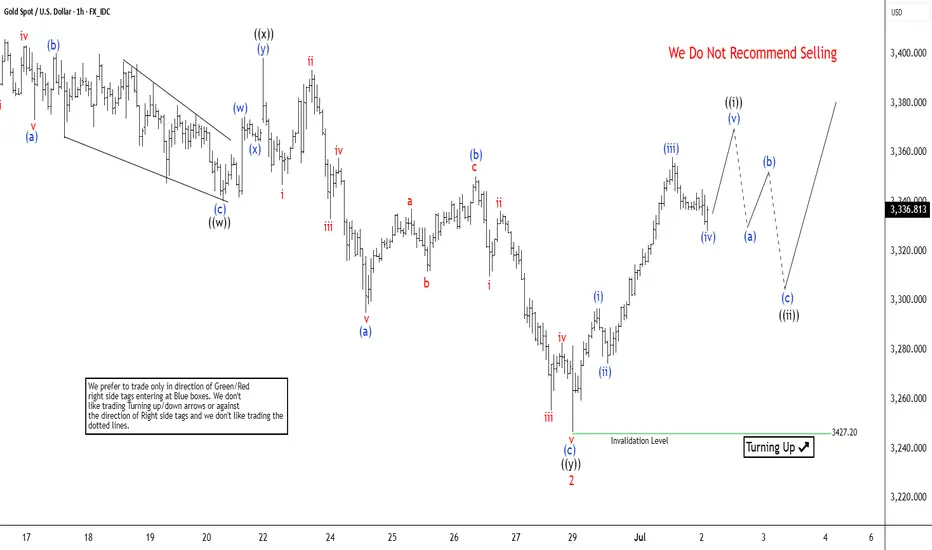
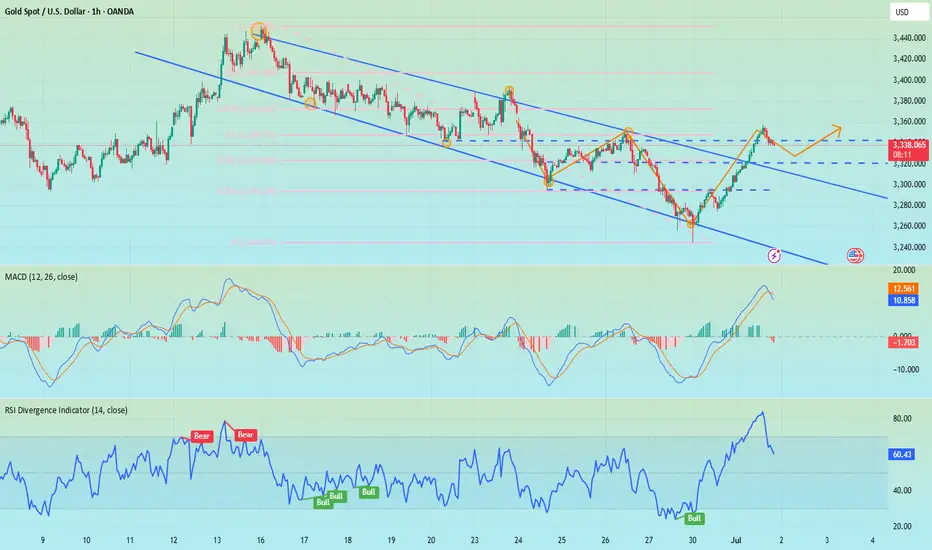
Gold (XAUUSD) Signals Bullish Trend ResumptionGold (XAUUSD) has exhibited a robust rally since its low on May 15, 2025. The metal formed a five-swing motive sequence that culminated in wave 1 at 3452.50 on June 16, 2025. This five-swing structure, characteristic of an impulsive Elliott Wave pattern, signals potential for further upside. The subsequent pullback in wave 2 appears to have completed at 3246.15, as illustrated in the accompanying 1-hour chart. The internal structure of wave 2 unfolded as a double-three Elliott Wave corrective pattern. Specifically, from the wave 1 peak, wave ((w)) declined to 3340.18. A corrective rally in wave ((x)) followed to 3398.35. The final leg, wave ((y)), concluded at 3246.15, marking the completion of wave 2 in the higher-degree structure.
Gold has since resumed its upward trajectory in wave 3. However, to confirm the bullish outlook and eliminate the possibility of a double correction, the price must decisively break above the wave 1 high at 3452.50. From the wave 2 low, wave (i) advanced to 3296.85. A shallow pullback in wave (ii) followed to 3274.41. Wave (iii) then propelled the metal to 3358.02. Based on the current structure, gold is expected to rally further in wave (v) to complete wave ((i)). Subsequently, a corrective pullback in wave ((ii)), likely unfolding in a 3, 7, or 11-swing structure, is anticipated from the June 30 low before the metal resumes its upward trend. In the near term, as long as the pivot low at 3246.15 remains intact, gold is poised to extend higher, supported by the impulsive momentum of the ongoing wave 3.
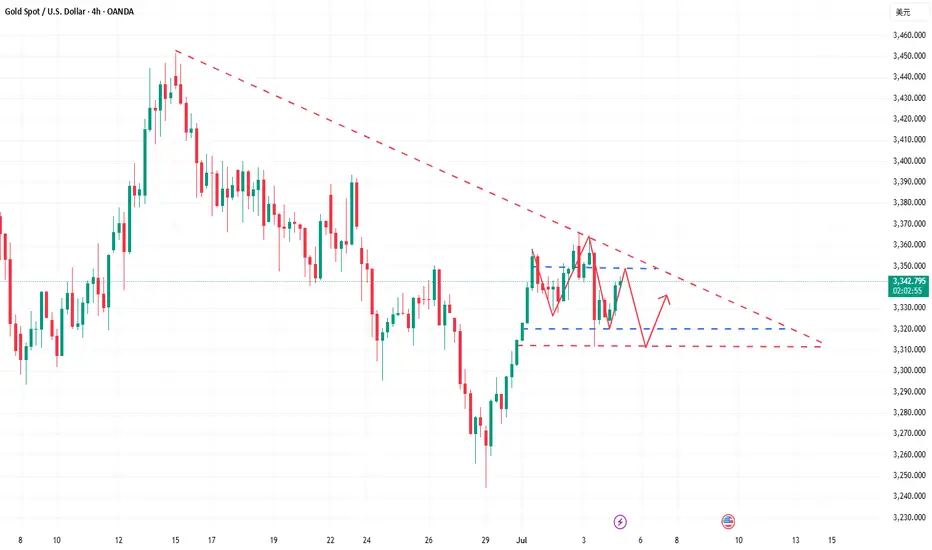
Maintain range fluctuations during the day?Gold has maintained a volatile pattern recently. As the US market is closed today for Independence Day, the market volatility is expected to be limited, but the volatile market will continue, but the volatility range may change. Yesterday's gold price fell mainly due to the news, and this decline usually does not last too long. From a technical point of view, gold prices are supported near 3310-3300, which is the key support level today. It is worth noting that on Wednesday, gold prices were under pressure in the 3340-3350 area, and on Thursday, prices formed support in this range, indicating that the area is forming a top-bottom conversion. Therefore, 3340-3350 has become an important pressure level today. It is expected to fluctuate in the 3300-3340/3350 range during the day. The impact of news on gold prices is usually short-term. When the fundamentals and technical directions are consistent, price fluctuations will be more obvious. When the two are inconsistent, price fluctuations will weaken, but will not change the technical trend. The rebound pattern established at the beginning of the week is still valid. After a short-term shock, gold prices are expected to re-stand above 3345 and continue to maintain the rebound trend.
Gold retreats as expected, how to trade in the future📰 News information:
1. Geopolitical situation
2. PMI data
3. Global Central Bank Governors Meeting
📈 Technical Analysis:
Our short orders have achieved profits. I closed the position near 3337, turning losses into profits. Interested friends can follow my previous post. In the short term, I am still optimistic that gold will retreat below 3335-3325. Today, gold rose sharply, and the rebound momentum was strong, while the short-term correction was slightly weak, so the space for a second decline in the short term will be limited. If it falls to the 3333-3323 range during the day and gets effective support, you can consider going long. The short-term upper resistance is 3360-3375.
🎯 Trading Points:
BUY 3333-3323-3315
TP 3341-3355-3360-3375
In addition to investment, life also includes poetry, distant places, and Allen. Facing the market is actually facing yourself, correcting your shortcomings, confronting your mistakes, and strictly disciplining yourself. I hope my analysis can help you🌐.
TVC:GOLD OANDA:XAUUSD FX:XAUUSD FOREXCOM:XAUUSD PEPPERSTONE:XAUUSD FXOPEN:XAUUSD
"Gold sell action!"Gold has dropped to the 3330 region but has now reversed and is currently trading at 3350. The next potential move could be at 3380, followed by 3400. Our sell entry is at 3400, where we believe the price will reverse. Our long-term view is that gold will head towards 3100, but our first target will be 3200. Please use accurate risk management when trading gold, as it can cause serious financial issues if not planned properly. This analysis does not guarantee any price movement.
GOLD recovers, capped by $3,350, trend viewOANDA:XAUUSD recovered then weakened as it failed to break above $3,350, supported by a weaker dollar and market uncertainty sparked by reports that U.S. President Donald Trump could replace Federal Reserve Chairman Jerome Powell in September or October. The reports raised concerns about the future independence of the Federal Reserve, boosting demand for safe-haven gold.
On Wednesday, Trump called Powell “terrible” and said he was considering three or four candidates to replace him. Meanwhile, the Wall Street Journal reported that Trump was even considering announcing a potential successor as early as September or October.
The current market narrative is that once Trump nominates a new Fed chair, market expectations will tend to favor a more “dovish” Fed. This could lead to a weaker US dollar, higher long-term US Treasury yields and higher stock prices.
Forexlive points out that this story may be more an emotional reaction than a result of objective and rational thinking. The policy of the FOMC (Federal Open Market Committee) is decided not only by the Fed Chairman but also by a majority vote of the 12 voting members (including 7 directors and 5 regional Fed presidents). The Fed Chairman does have a lot of influence, but he does not have absolute control over monetary policy. The Fed was originally designed to be independent of political pressure.
Moreover, even if Trump nominates the next chairman, there is no guarantee that this will automatically lead to a rate cut. In fact, Powell was also nominated by Trump, but his monetary policy decisions are still based on professional judgment rather than serving Trump's wishes.
So, in the worst case, the market could face policy uncertainty as differences between FOMC members increase and more disagreements emerge. Currently, there are fewer moderate members on the committee, while neutral or hawkish members dominate.
Markets are now focused on personal consumption expenditure (PCE) data due later today (Friday) for further clues on whether the Federal Reserve will cut interest rates.
On the geopolitical front, a ceasefire between Israel and Iran appeared to be in place on Wednesday after Trump hailed a swift end to the 12-day conflict at the NATO summit and said he would seek a commitment from Iran to abandon its nuclear ambitions in talks next week.
Technical Outlook Analysis OANDA:XAUUSD
On the daily chart, after gold recovered and reached the initial target at 3,350 USD, the nearest resistance is also the price point of the EMA21 noted for readers in the previous publication.
However, the recovery momentum is currently weakening, specifically at the time of writing, the gold price is falling below 3,320 USD. Gold falling below 3,320 USD provides conditions for a possible decline with the next target around 3,302 - 3,300 USD, which is the area of the 0.382% Fibonacci retracement confluence with the lower edge of the price channel.
In terms of momentum, the RSI is heading down and breaking below 50, which should be considered an initial bearish signal.
Overall, gold does not have a clear long-term trend as the uptrend is still the main trend, while the momentum is showing signs of decline.
But personally, I am still leaning towards the uptrend, and continue to look for positions to buy.
Finally, the notable positions will be listed as follows.
Support: 3,302 – 3,300 USD
Resistance: 3,320 – 3,350 – 3,371 USD
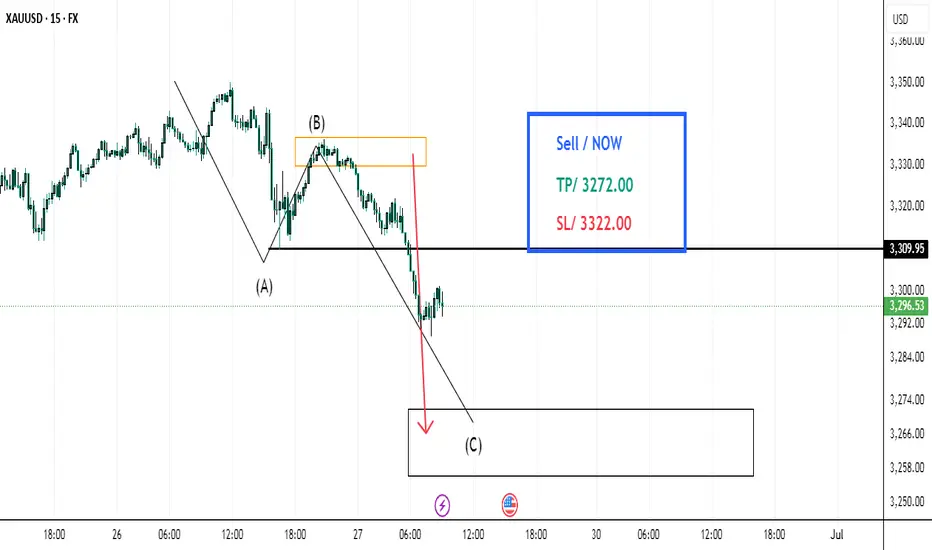
SELL XAUUSD PRICE 3367 - 3365⚡️
↠↠ Stop Loss 3371
→Take Profit 1 3359
↨
→Take Profit 2 3353
BUY XAUUSD PRICE 3272 - 3274⚡️
↠↠ Stop Loss 3268
→Take Profit 1 3280
↨
→Take Profit 2 3286
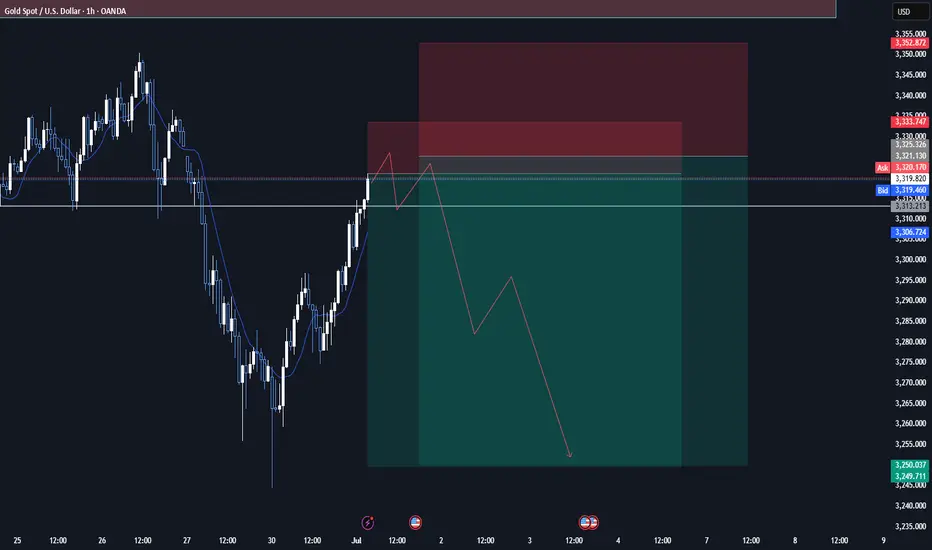
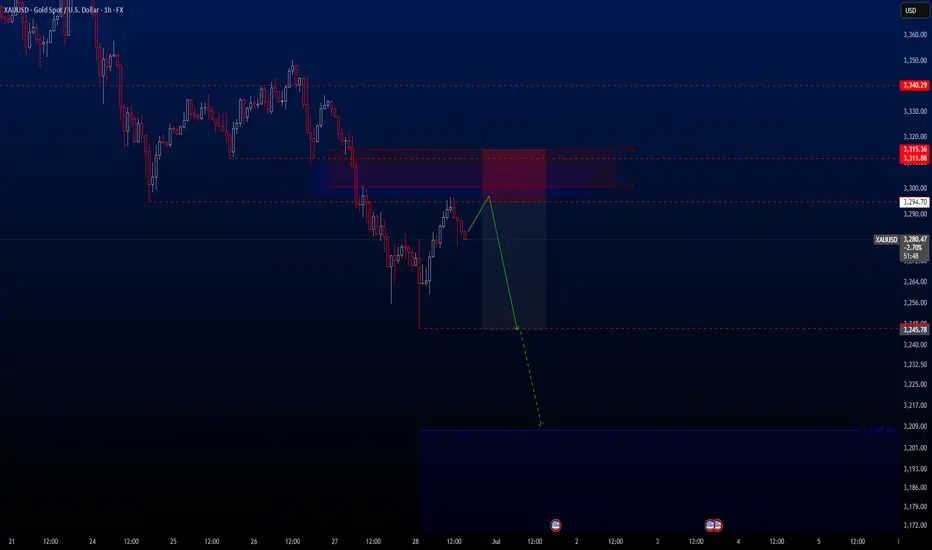
XAUUSD Hello traders. There’s currently a great opportunity for a potential short setup on the XAUUSD pair. We just need a bit of patience. For that reason, this trade will be placed as a Sell Limit.
In the coming days, I expect a moderate pullback in gold. Meanwhile, the S&P 500 has reached a new all-time high, which is quite notable. If the index begins to correct from these levels, we could potentially see a strong rally in gold. Of course, this is just my personal opinion based on current market dynamics.
🔍 Trade Details
✔️ Timeframe: 1-Hour (H1)
✔️ Risk-to-Reward Ratio: 1:3.20
✔️ Trade Direction: Sell Limit
✔️ Entry Price: 3294.70
✔️ Take Profit Targets: 3245.78 / 3207.00 / 3154.00
✔️ Stop Loss: 3315.36
🕒 If momentum weakens or price consolidates in a tight range, I will keep this trade open only until 23:00 (UTC+4). After that, I’ll manually close it—whether in profit or loss—based on how price action evolves.
🔔 Disclaimer: This is not financial advice. I’m simply sharing a trade I’ve taken based on my personal trading system, strictly for educational and illustrative purposes.
📌 Interested in a systematic, data-driven trading approach?
💡 Follow the page and turn on notifications to stay updated on future trade setups and advanced market insights.
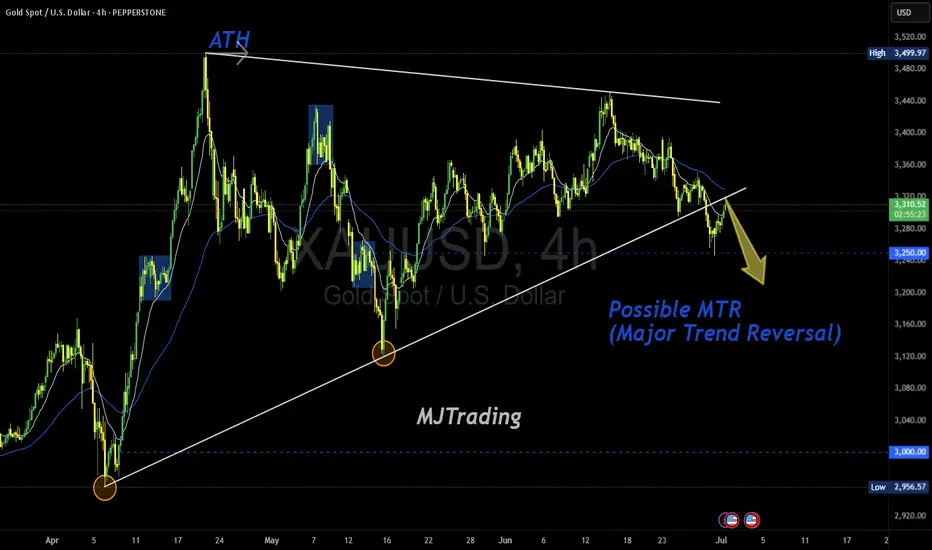
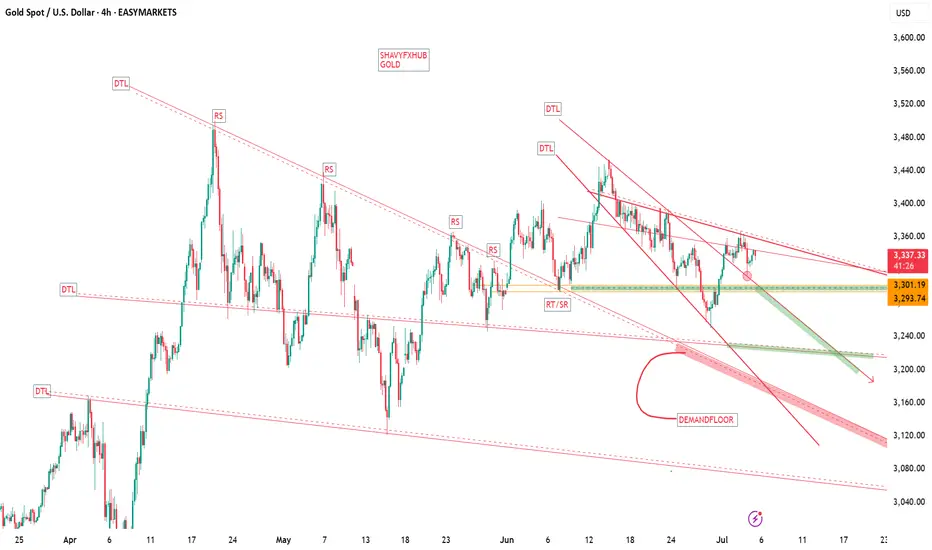
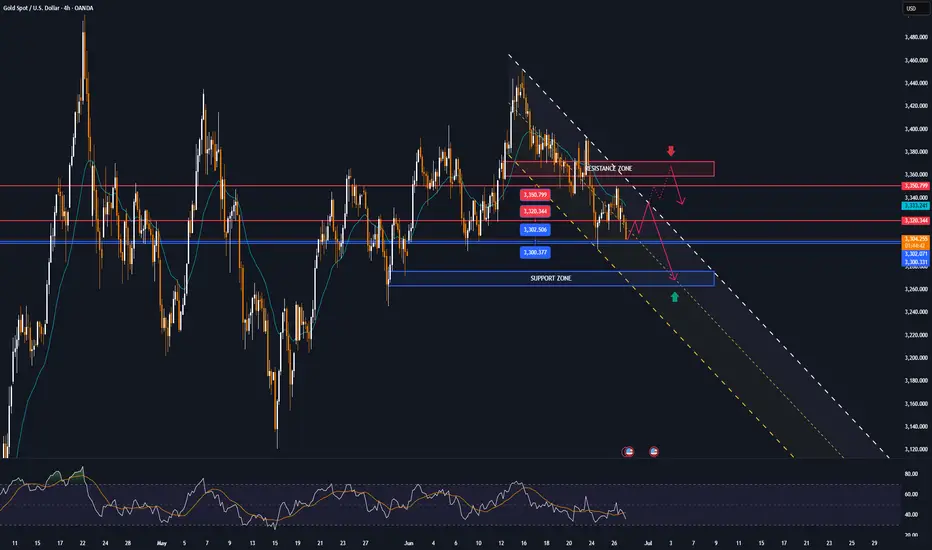
Possible MTR in Play (TBC)Gold has printed a textbook structure for a potential Major Trend Reversal (MTR) off the ATH zone, with a clean rejection and a shift in character. The descending trendline from the top aligns with lower highs, while the ascending base from April is now under pressure.
📌 Key Levels to Watch:
3,280.0 – neckline of the potential MTR
3,250.00 – psychological magnet and structural support
3,000.00 – major downside target if the reversal confirms
🧠 “Markets top on euphoria, not logic.” If price breaks and retests the neckline with momentum, the MTR thesis gains traction. Until then — TBC.
#XAUUSD #Gold #MajorTrendReversal #MTR #PriceAction #TechnicalAnalysis #GoldBears #ATHRejection #TrendShift #MJTrading