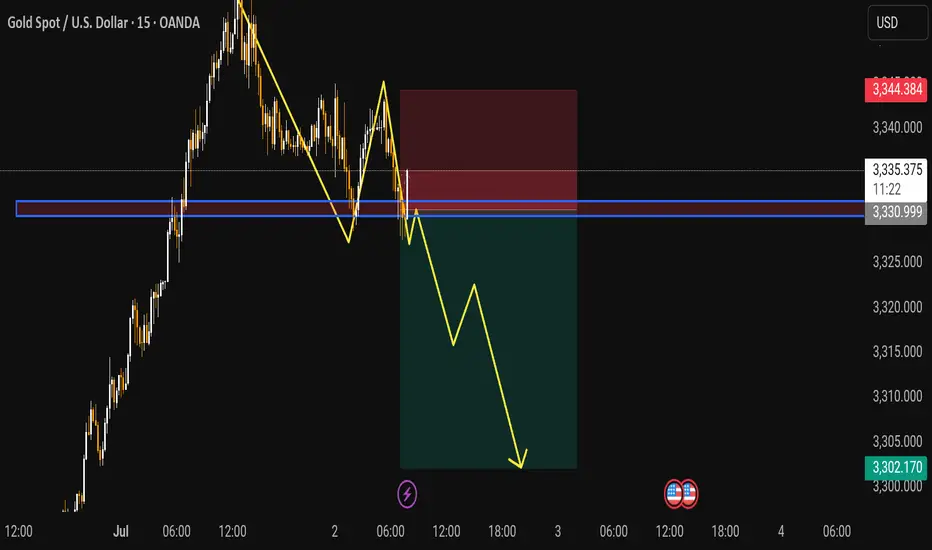
Expecting Gold Selling movement In this 15 minute chart of Gold Spot XAU/USD price action indicates a potential bearish setup following a strong upward move that has started to lose momentum
After reaching a peak near 3344 price formed a double top pattern followed by a series of lower highs and lower lows signaling a shift in market sentiment
The blue horizontal zone around 3331 3332 acted as a significant support level which has now been broken and is being retested as resistance
The yellow projection shows a bearish continuation scenario with price expected to reject the retest of the broken support and continue downward
The projected target for the bearish move is near 3302 indicating a significant downside potential
The risk zone highlighted in red lies above the resistance, likely placing the stop loss around the 3335 3340 range
This analysis suggests that if the price fails to reclaim the support turned-resistance zone bears could take control and drive price lower throughout the day
XAUUSDK trade ideas
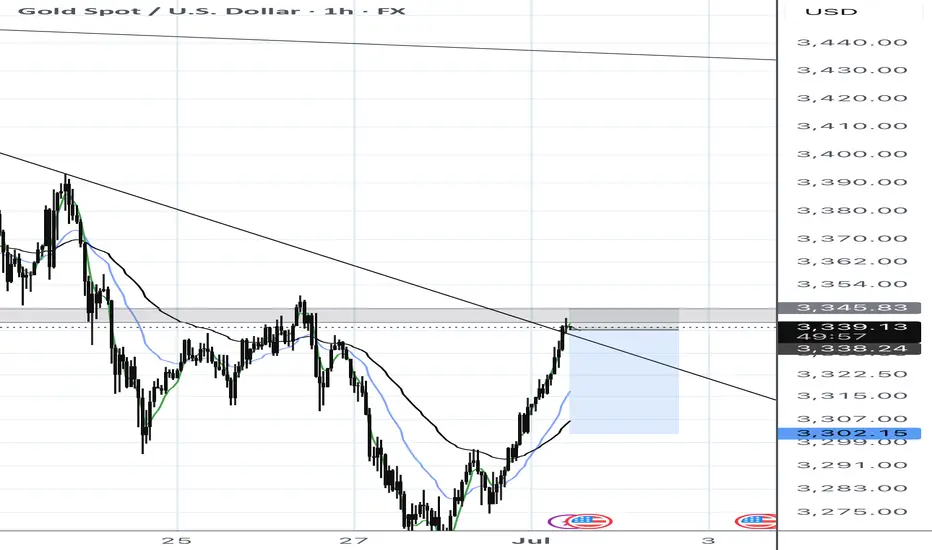
XAUUSD | Major Trendline Retest Incoming | Sell Setup WatchGold (XAUUSD) is approaching a key higher timeframe descending trendline that’s been respected since mid-June. Price is also tapping into a clean supply zone combined with horizontal structure around 3345–3350.
Watching for a potential bearish rejection from this level. If price respects the trendline and supply zone, expecting a continuation to the downside targeting previous lows around 3302 and potentially 3280.
Bias: Bearish unless price breaks and holds above 3350+.
Confluence:
• HTF descending trendline
• Supply zone + horizontal resistance
• EMA dynamic resistance aligning (if retest happens)
• Clean bearish structure on the 1H
Will update if the breakout happens — for now, waiting on bearish confirmations at the retest.
Gold price analysis July 1On the D1 chart, the price has recovered positively when the candle closed above 50% of the decrease range of last Friday's session. This shows that buying power is returning and a new uptrend is forming, with the target heading towards the GAP zone around 3363.
Today's trading strategy:
Prioritize buying (BUY) if the price has a correction to the support zone of 3300.
Sell strategy should only be implemented at important resistance zones, with short-term profit expectations because the main trend is leaning towards the uptrend.
Important technical levels:
Support: 3300 - 3337 - 3360
Resistance: 3334 - 3348 - 3363
GOLD 45MINTHE month of july 1 Key Economic Outlook ;
Central Bank Speeches
(1)The bank of England head (BOE) Gov Bailey might speak in context on BOE 4.25% rate cut ,uk inflation about 3.45% is still above limit and the goal is 2%.my focus will be on his rhetoric's ,if he sounds dovish or Hawkish tones, then GBP will react to the sentiment.
(2)Bank of japan (BOJ) Gov Ueda will center on rate held steady at 0.5% and core inflation remains above 2%,market will watch the sentiment because its likely he will address yield -curve control adjustments or hawkish signals , which will potentially boost JPY AND JP10Y
the head of united states Fed reserve Chair, sir! Powell will speak and it comes with red folder ,the last monetary policy meeting kept Fed funds rate at 4.25–4.50% ,Powell recently emphasized patience on rate cuts based on cautious wait and see approach
Key Messages Expected:
Tariff-driven inflation risks require vigilance.
Rate cuts unlikely until September unless inflation cools markedly.
"No urgency" to ease policy amid solid labor market.
US Economic Data Releases
Final Manufacturing PMI 52.0 52.0 Neutral if unchanged; USD positive if >52.0.
ISM Manufacturing PMI 48.8 48.5 Contractionary (<50); USD negative if <48.5.
JOLTS Job Openings 7.32M 7.39M USD negative if <7.32M (labor cooling).
ISM Manufacturing Prices 69.6 69.4 USD positive if >69.6 (inflationary pressure).
Construction Spending -0.2% -0.4% Limited impact unless significantly below forecast.
Market Implications
USD: Powell’s tone is critical. Hawkish remarks (delayed cuts) could lift DXY; dovish hints may weaken it. Data surprises (especially ISM/JOLTS) could amplify volatility.
GBP/JPY: Bailey/Ueda speeches may drive cross-pairs. BOJ hawkishness could weaken EUR/JPY carry trades.
Risk Assets: Weak ISM/JOLTS data may pressure equities (US30) and boost bonds (↓US10Y).
Summary of Key Risks
Powell Speech: Reiteration of "no imminent cuts" likely. Watch for tariff-inflation warnings.
ISM/JOLTS: Sustained manufacturing contraction or softer labor demand could fuel recession fears.
Carry Trades: JPY strength (Ueda) may pressure EUR/JPY/AUD if BOJ signals policy shift.
#gold #fx

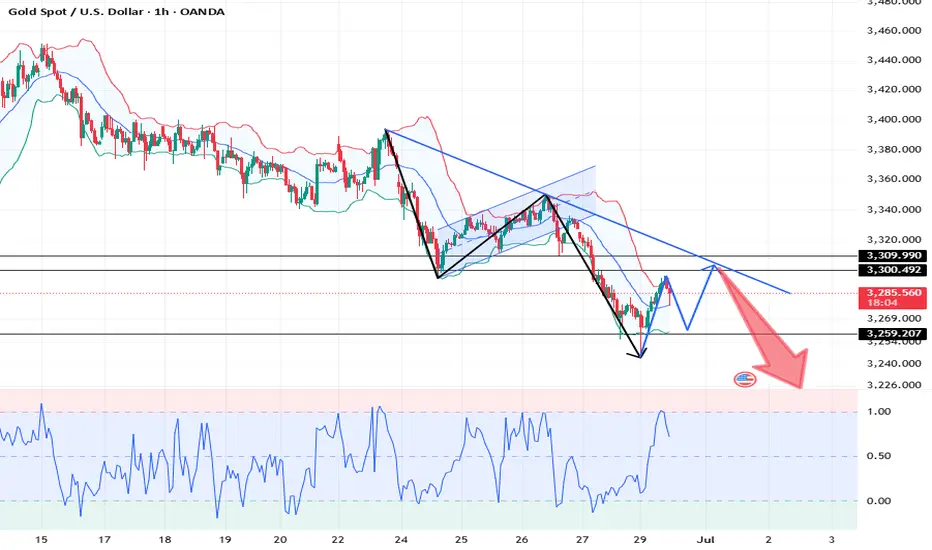
XAUUSD: Market analysis and strategy on June 30Gold technical analysis
Daily chart resistance 3350, support 3225
4-hour chart resistance 3310, support 3245
1-hour chart resistance 3295, support 3260
From the 4-hour level, after gold fell to 3255 last Friday, the real candlestick chart was difficult to continue to fall, suggesting that the downward momentum has slowed down. It is necessary to pay attention to the possibility of double bottom support at 3245. At the same time, this is also the 0.618 support level of the golden section of the 3120-3452 band. With the MACD showing signs of bottom divergence, short-term operations are bearish, but the probability of rebound is also very high. The short-term support position below the market is near 3281, and the break will look at 3260-3247; the important pressure position is near 3295; the break will look at 3309-3313!
BUY: 3281near
BUY: 3260near
BUY: 3245near
Gold is under pressure at 3296 and may weaken and fall today
I am analyst Yulia, and I always believe that profit is the only criterion for measuring strength. My analysis is never perfunctory, and my trading style is unique. Follow my rhythm, and you will never fail in the annual cycle. Others have already rushed on the road to wealth, but you are still hesitating whether to cross the traffic light at the intersection? Remember, hesitation will lead to failure! Follow my pace, and wealth will be very close to you.
Gold rebounded as I expected during the weekend, but the rebound to 3296 was under pressure. The short-term 60-day moving average and the suppression near the five-day moving average failed to break, so the rebound within the day was limited. It may weaken and fall today, but it belongs to a shock and bearish trend, so consider shorting near 3282-85, stop loss 3291, pay attention to risks.
June 30 gold short-term trading: short near 3283, stop loss 3291, take profit 3263
GOLD GOLD ,different broker different candle close on different time frame, this is dishonesty and it will affect the structure of the market.
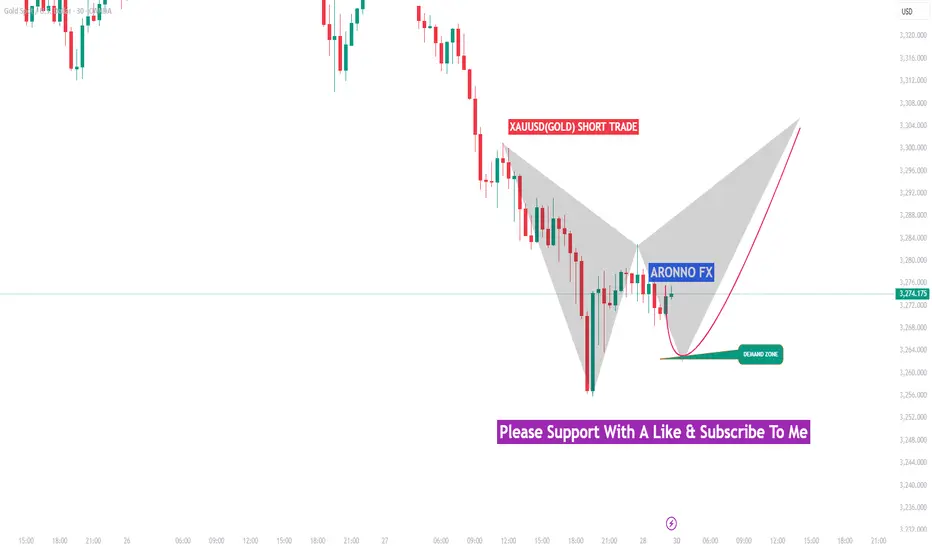
GOLD SHORT TRADEAronnoFX will not accept any liability for loss or damage as a result of
reliance on the information contained within this channel including
data, quotes, charts and buy/sell signals.
If you like this idea, do not forget to support with a like and follow.
Traders, if you like this idea or have your own opinion, please feel free command me.
Will gold be corrected or revoked next?1. What happened yesterday
As expected, Gold started to rise after finding support at 3250. The move up played out perfectly, reaching the resistance area highlighted in yesterday’s analysis — around 3320–3340.
________________________________________
2. The key question today
Is this just a correction in a bearish trend, or the start of reversal?
________________________________________
3. Why I remain bearish
• On the weekly chart, structure still leans bearish
• On lower time frames, the bounce looks corrective — not impulsive
• No breakout above 3360 yet, which would be needed to shift the bias
• A move back below 3320 would likely trigger renewed selling
• If that happens, 3250 could be tested again quickly
We need to respect the bounce — but not overreact to it.
________________________________________
4. Trading plan
My bias remains bearish as long as price stays under 3360.
However, if we get a daily close above 3360, I’ll pause and re-evaluate the short bias. The market would then be signaling a potential trend shift.
________________________________________
5. Final thoughts
This is a key moment for gold. We’re at resistance zone but not broken above yet.
Until proven otherwise, the trend remains down — and rallies into 3340 zone should be considered selling opportunities.
XAUUSD Update 29th JUNE 2025Last week, pullback has reached 62% fibonaci.
It have an opportunity to continue the correction in to 3205 support or more lower at 3190 level support.
So we need to becarefull on next week and we looking for a reversal / rejection signal from the market as a confirmation.
We need to give our attention to a fundamental data also. If there is a big news on war / geopolitical or global economic in July, we could be more convidence about gold price direction.
If 3155 lose...it would be more deep, but it would be unlikely.
Have a good luck !
P.S : If you agree, Boost it
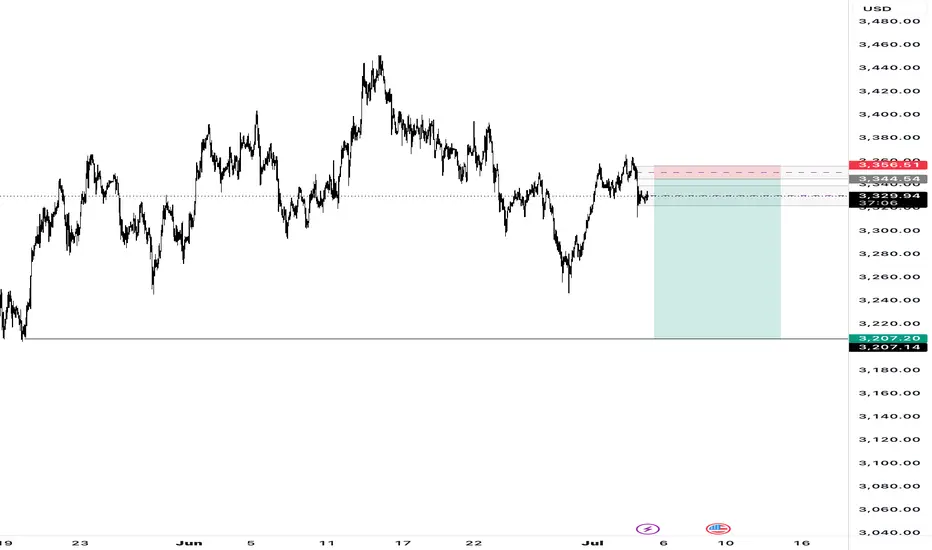
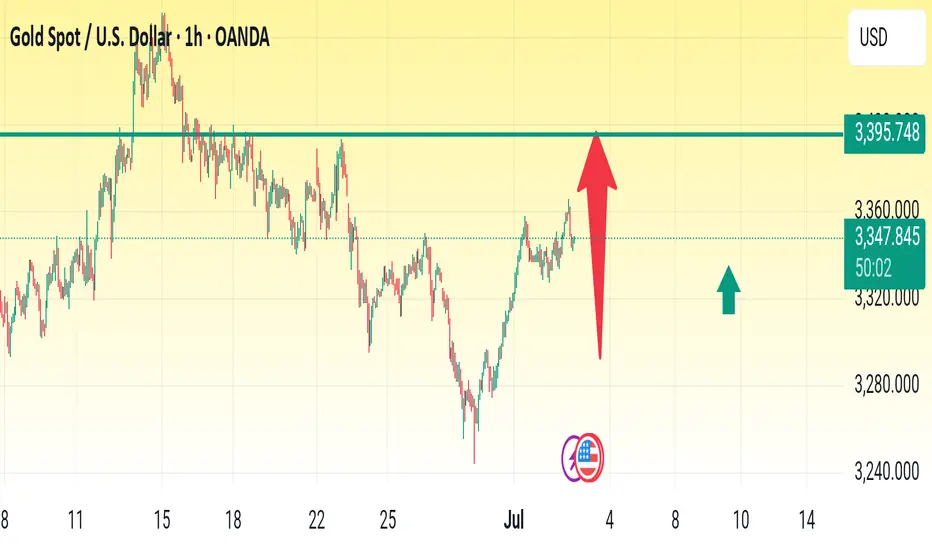
Bait. Trigger. Collapse!🎯 XAUUSD 1H – Anticipating the Upside Fakeout Before the Real Drop
📉 Trade Breakdown:
Gold is consolidating just beneath a 1H supply zone (3344–3356), forming the classic structure for a liquidity trap. The expectation: price fakes out to the upside, taps the supply zone, and then reverses with a clean bearish move toward 3207. This isn’t just a technical setup — it’s fundamentally fueled by a blowout NFP report.
⸻
📍 Key Technical Confluences:
• 🔸 1H supply zone: 3344–3356 (clean bearish reaction)
• 🔸 Consolidation beneath supply = energy buildup
• 🔸 Likely upside fakeout into supply → then rejection
• 🔸 Equal lows + inefficiency below = target-rich zone
• 🔸 3207 = next major demand / clean target
⸻
📰 Fundamental Fuel:
• 🔹 NFP came in strong (206K vs. expected ~190K)
• 🔹 Dollar surged, yields rebounded → gold dropped
• 🔹 Rate cut hopes fading = bullish for USD, bearish for XAU/USD
• 🔹 Market is now adjusting expectations → selling gold aggressively
• 🔹 Gold already fell post-NFP, but this pullback into supply gives sellers a second entry
⸻
📈 Execution Plan:
• Entry: After upside sweep into 3344–3356 with M15–H1 rejection
• Stop Loss: Above 3356 (supply invalidation)
• Take Profit: 3207 (clean structure + news-driven momentum)
• Optional sniper trigger: Wick rejection during NY session or USD news spike
⸻
🧠 Mindset:
This setup is time-sensitive. It’s not just about structure — it’s about who’s trapped and what the market believes post-NFP. Don’t chase candles. Wait for the manipulation to finish — then strike with precision.
“Trade Simple. Live Lavish.”
-Quil Lavish
gold Indicator Actual Forecast Previous
Average Hourly Earnings m/m
0.3% 0.4% —
Non-Farm Employment Change
147K 111K 139K
Unemployment Rate
4.1% 4.3% 4.2%
Unemployment Claims
233K 240K 236K
Interpretation and Implications
Average Hourly Earnings m/m:
Rose by 0.3%, slightly below the forecast of 0.4%. This suggests wage growth is steady but not accelerating, which may ease some inflation concerns.
Non-Farm Employment Change:
The US economy added 147,000 jobs, beating both the forecast (111K) and the previous month (139K). This indicates continued, though moderate, labor market expansion.
Unemployment Rate:
Fell to 4.1%, better than the expected 4.3% and down from 4.2% previously. This points to a modest improvement in labor market conditions.
Unemployment Claims:
Dropped to 233,000, lower than both the forecast (240K) and last month (236K). This signals fewer new layoffs and continued resilience in the job market.
Market Impact
Dollar (USD):
The combination of stronger-than-expected job growth and a lower unemployment rate is generally supportive for the US dollar, as it suggests the labor market remains robust. However, slightly softer wage growth may temper expectations for aggressive Fed tightening going forward.
Federal Reserve Outlook:
These figures reinforce the Fed’s “data-dependent” stance. Solid job creation and falling unemployment reduce urgency for immediate rate cuts, but the lack of wage acceleration may allow the Fed to maintain a cautious approach.
In summary:
The US labor market in July 2025 shows moderate strength, with job gains and a falling unemployment rate, while wage growth remains steady but not excessive. This mix supports a stable outlook for the dollar and gives the Fed flexibility in its upcoming policy decisions.
Today's bearish target for gold prices: 3300Today's bearish target for gold prices: 3300
Technical analysis:
Short-term support: $3330-3320 (5-day and 10-day moving averages),
Short-term resistance: $3360-3374 (61.8% retracement).
If it falls below $3330, it may fall to the $3306-3320 range;
If it breaks through $3374, it may challenge the previous high of $3450.
The daily chart shows that gold prices are fluctuating at high levels, and the MACD red column has expanded, but the RSI (60-65) shows a good bullish momentum.
2. Main influencing factors
Federal Reserve policy and non-agricultural data:
The market focuses on the US non-agricultural employment data for June released tonight (July 3) (expected to increase by 106,000, and the previous value was an increase of 139,000).
If the data is weak (for example, the unemployment rate rises to 4.3%), it may strengthen the expectation of a rate cut in September, which is good for gold;
On the contrary, if the data is strong, the price of gold may fall back.
The unexpected contraction of the ADP employment data in June (a decrease of 33,000 jobs) has pushed up the expectation of a rate cut in advance.
Geopolitics and safe-haven demand:
If the situation in the Middle East (such as the Iranian nuclear issue) escalates, it may push up the price of gold, but the recent ceasefire agreement between Israel and Iran has weakened the short-term safe-haven support.
The continued purchase of gold by central banks around the world (net purchase of 289 tons in the second quarter of 2025) constitutes long-term support.
The US dollar and interest rates:
The US dollar index has weakened recently, but if the Fed postpones the rate cut (the probability of a rate cut in September is currently 75%), it may suppress the price of gold.
3. My views and market forecasts:
In the short term, the price of gold will fluctuate, and the trend depends on the non-agricultural data.
If the data is weak, the price of gold may rise to $3370-3400;
If the data is strong, the price of gold may fall back below $3300.
I think the possibility of a fall is high.
In the short term, I prefer the strategy and trading ideas of shorting at high prices below 3360-3370.
Suggestions:
Short-term trading: Pay attention to the breakthrough opportunities after the release of non-agricultural data. You can go long at the support level (3330-3320 US dollars) and try to go short at the resistance level (3360-3374 US dollars).
Flexibly adjust the strategy.
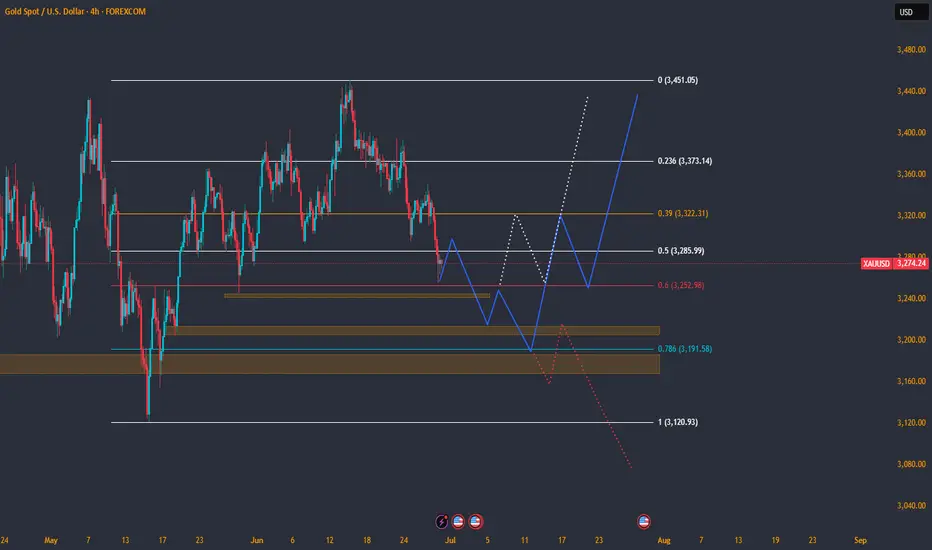
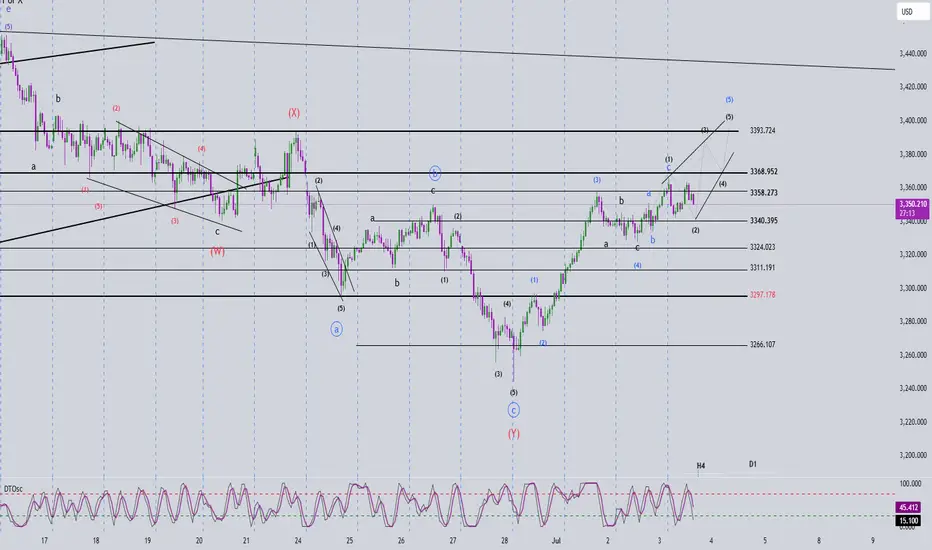
Elliott Wave Analysis – XAUUSD, March 7, 2025🌀 Elliott Wave Structure
On the H1 chart, wave 3 appears to have completed, and price is now entering a phase with an unusual structural behavior.
Wave 3 previously showed strong momentum, moving steeply and continuously, with no clear internal pullbacks – a classic impulse wave. Following this, we observed a corrective abc pattern in black, suggesting the end of wave 3.
Interestingly, although yesterday's ADP report was extremely bullish, gold only managed a mild breakout above the wave 3 high before pulling back this morning. Notably, the upward move followed a 3-wave abc structure in green, and price action is now showing overlapping waves with no clear directional momentum.
🧩 These signs suggest a high probability that:
🔹 Wave 5 is forming as an Ending Diagonal – a 5-wave structure with a 3-3-3-3-3 pattern.
🔹 This is typically seen at the end of a bullish cycle and often precedes a sharp reversal.
Although it's too early to confirm, we should patiently observe the upcoming price action. If the ending diagonal completes, it may present a strong sell opportunity.
🎯 Target for wave 5: around 3395, provided all 5 sub-waves within the diagonal complete.
⚠️ If price breaks below 3324, we must consider that the full 5-wave structure is already done, and a new abc corrective phase may have begun.
🔍 Momentum Analysis
Daily (D1): Momentum is about to turn bearish from overbought territory → suggests a weakening uptrend.
H4: Momentum is turning upward → likely a mild rally or sideways movement today before H4 reaches overbought again.
📌 Trading Plan
Given the current wave behavior and overlapping structure, it is best to remain patient and wait for confirmation before taking a strong position. If the Ending Diagonal structure is confirmed, it could signal a major reversal.
SELL Zone: 3392 – 3395
Stop Loss: 3403
Take Profits:
• TP1: 3368
• TP2: 3340
• TP3: 3324
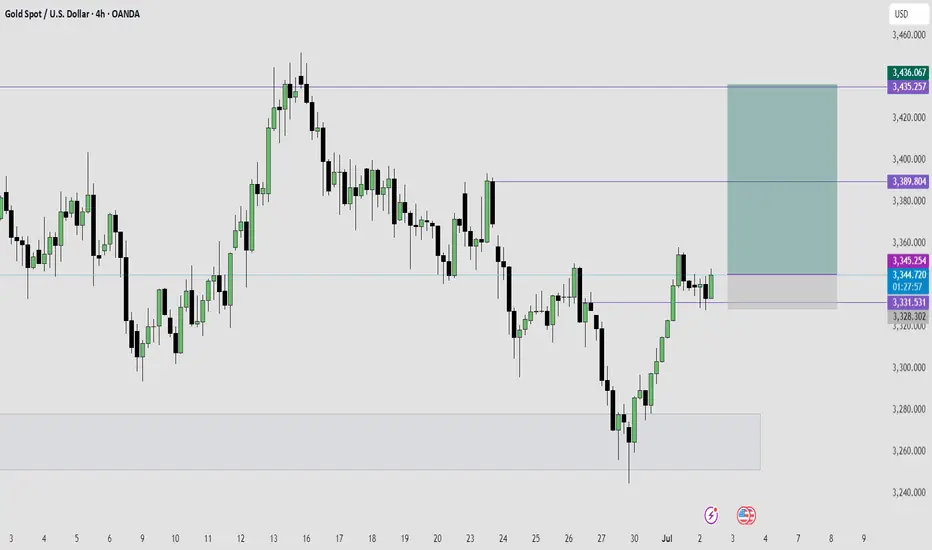
Gold is Ready For The Next Bullish Run- Taking a Long Trade HereAfter a series of bearish structures on 4Hour time frame, which is actually a bullish retracement on higher time frame, Gold has now broke the bearish structure with series of bullish candles which turned the trend from bearish to bullish trend.
After the bullish break of structure, Gold retrace into a fair value price level, formed a swing low plus a bullish price action which further confirmed the bullishness of Gold, which is were I took an entry for a buy long trade.
My target for this trade is for Gold to reach the price level of $3,436 which is a 5.36RR return.
I will be monitoring price and manage my trade accordingly as price move in my direction.
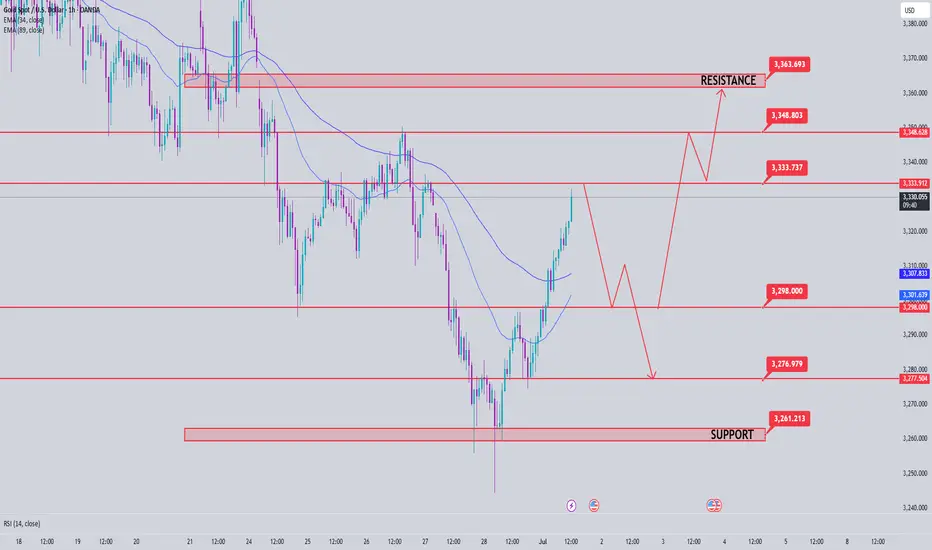
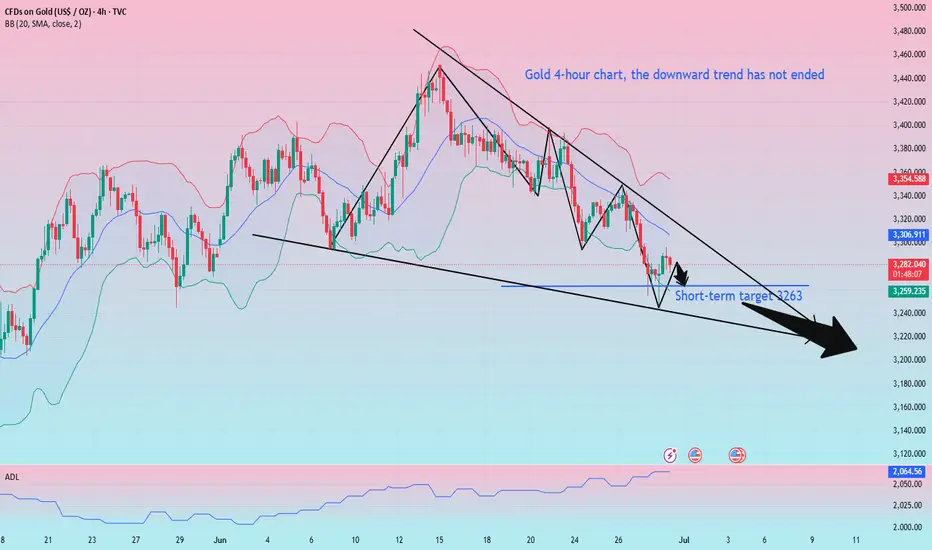
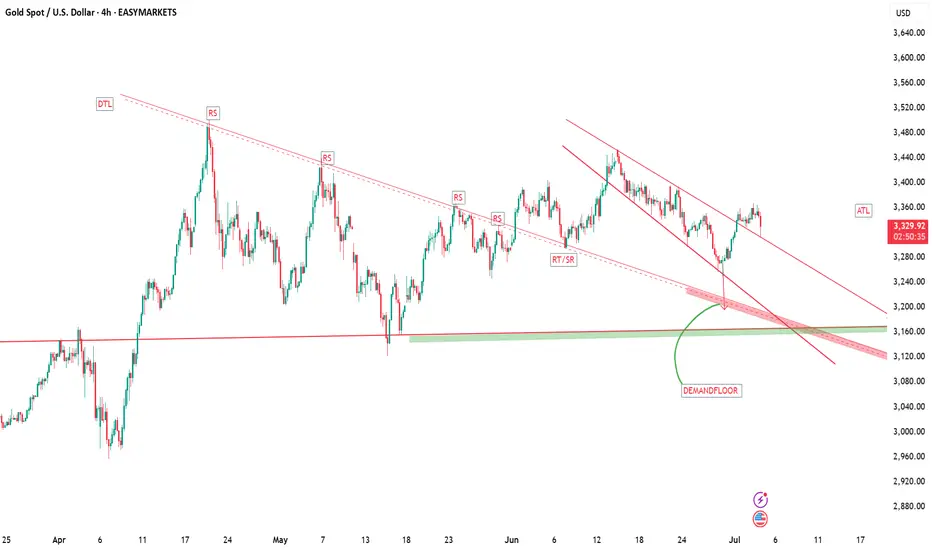
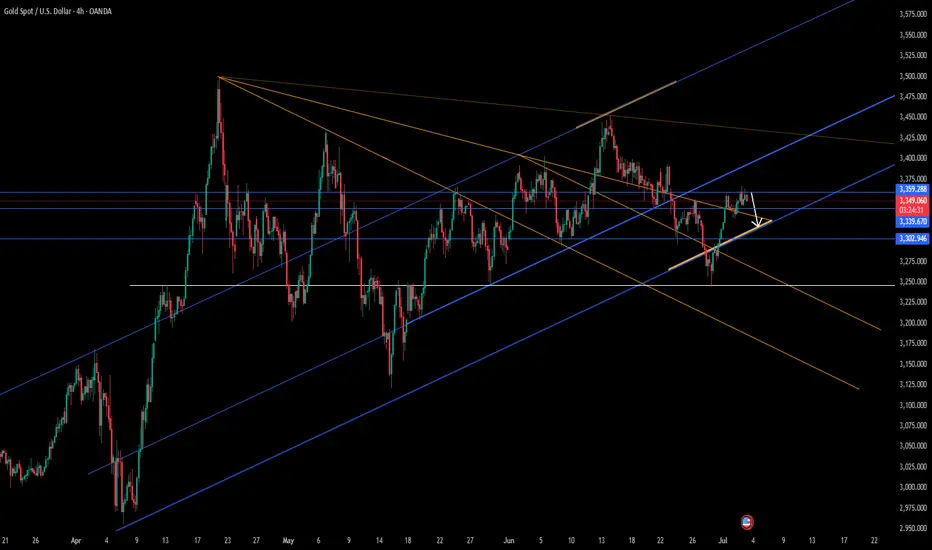
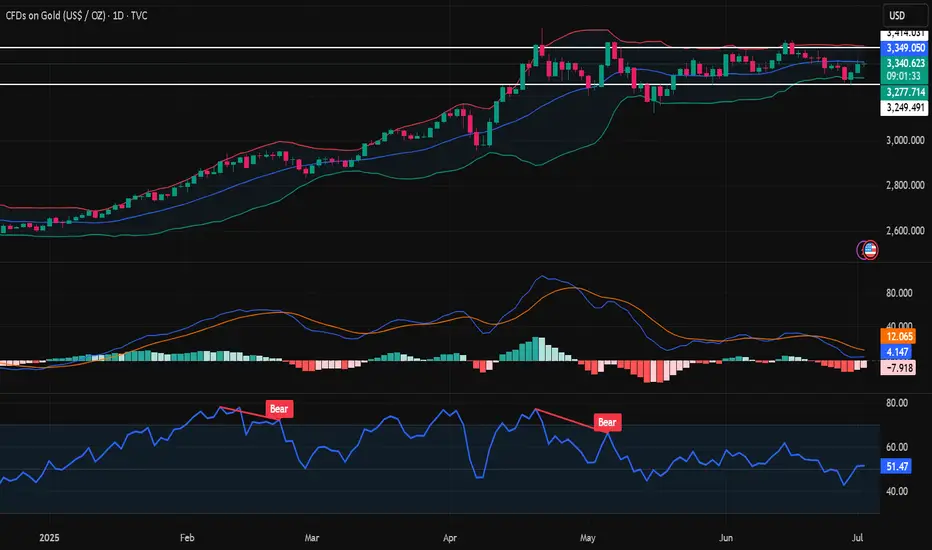
Gold bulls and bears compete for non-agricultural dataTechnical aspects:
Currently, gold is in a typical ascending triangle structure, reflecting that the market bullish trend has not been broken but faces strong resistance. On the daily chart, gold as a whole maintains a range of $3250 to $3400, with obvious horizontal support and resistance bands formed at both ends of the range.
The Bollinger Bands are converging as a whole, indicating that volatility is shrinking, indicating that the large-scale direction selection is approaching. The green column of the MACD indicator has narrowed slightly, and the short-term momentum is still bearish but there are signs of weakening. The RSI indicator runs around 49, maintaining a neutral and bearish state, and there is no obvious deviation in the short term, suggesting that there is still the possibility of subsequent shocks and consolidation.
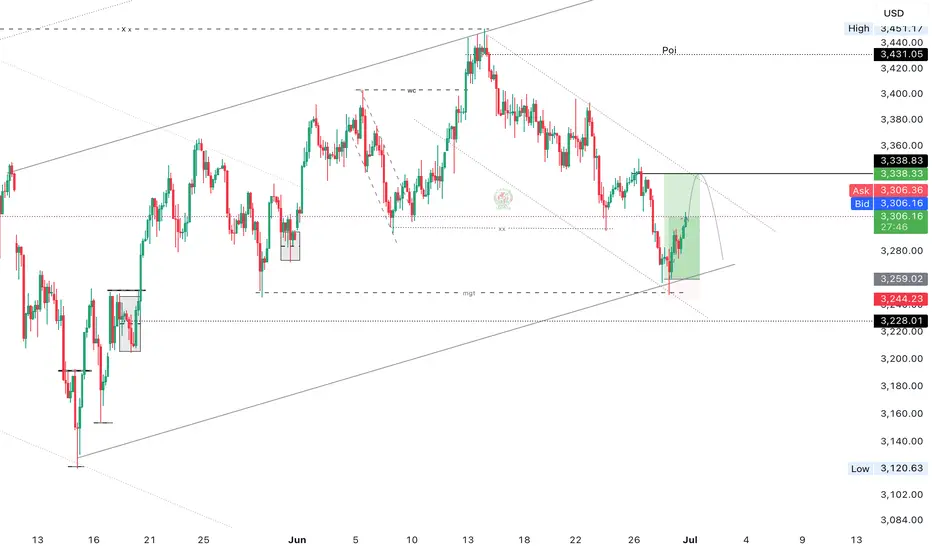
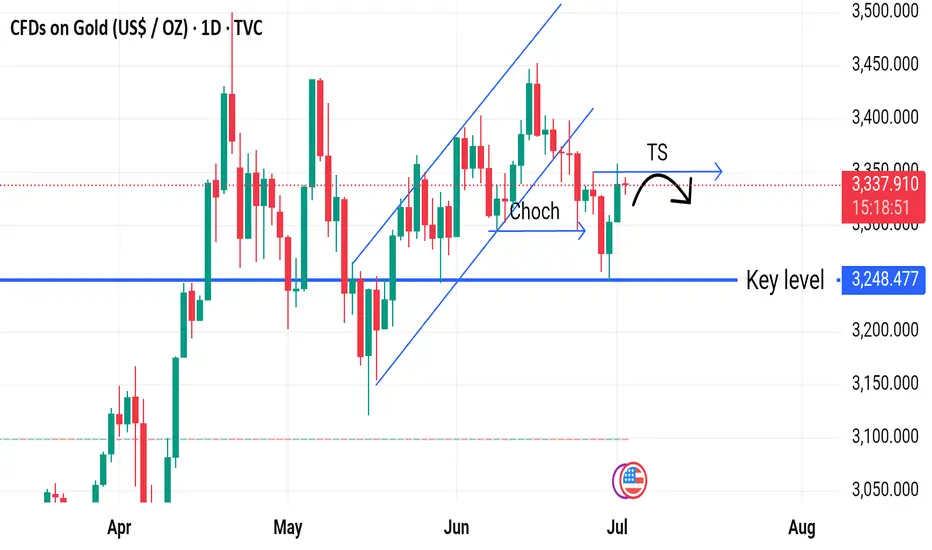
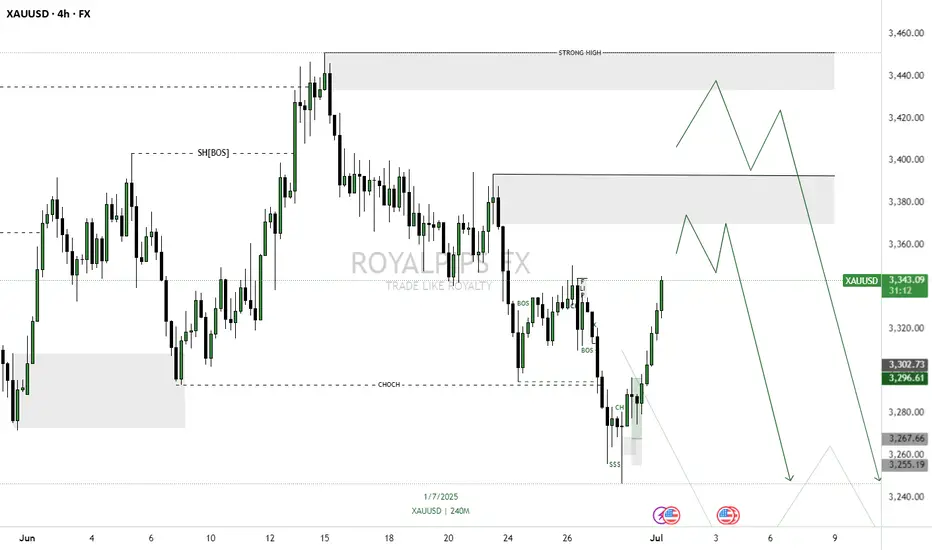
XAUUSD Daily Analysis – Bearish BiasGold tapped a key level at 3,339, sweeping liquidity above before showing signs of exhaustion. A Change of Character (Choch) confirms potential reversal. If price respects this Bearish POI, we could see a drop back to 3,248 support. Watch for a TS (tap and shift) before continuation.
I will update you with trade setup so stay update
#Gold #xauusd #Forex #Dailyanalysis #bias #Goldbias
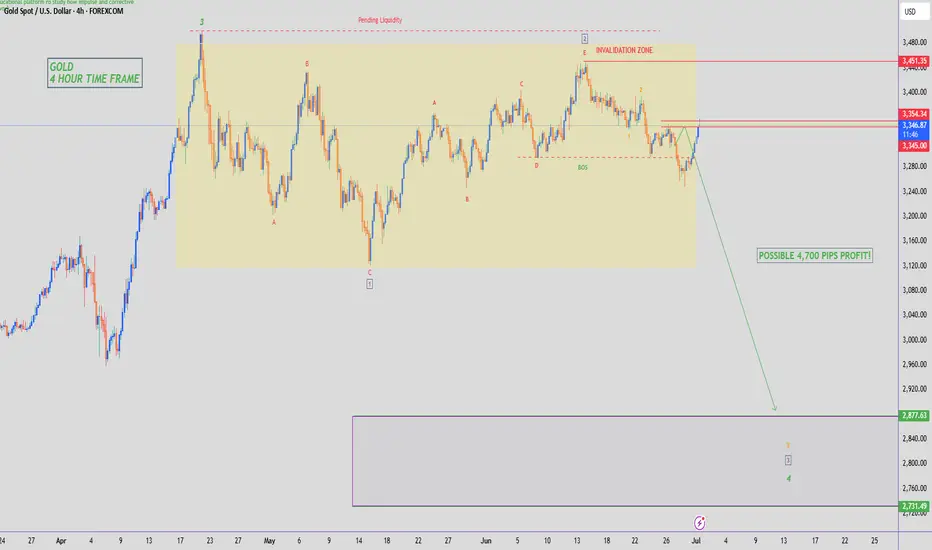
GOLD - SHORT TO $2,800 (UPDATE)We've seen s sharp move back up overnight which is no surprise considering we are at the start of a new month & quarter. Markets will be spiking to both sides for monthly liquidity, before moving in the direction of the trend.
We're still holding below our yellow support zone & below 'Minor Wave 2'. If this continues to hold, then it'll be a good sign for sellers.
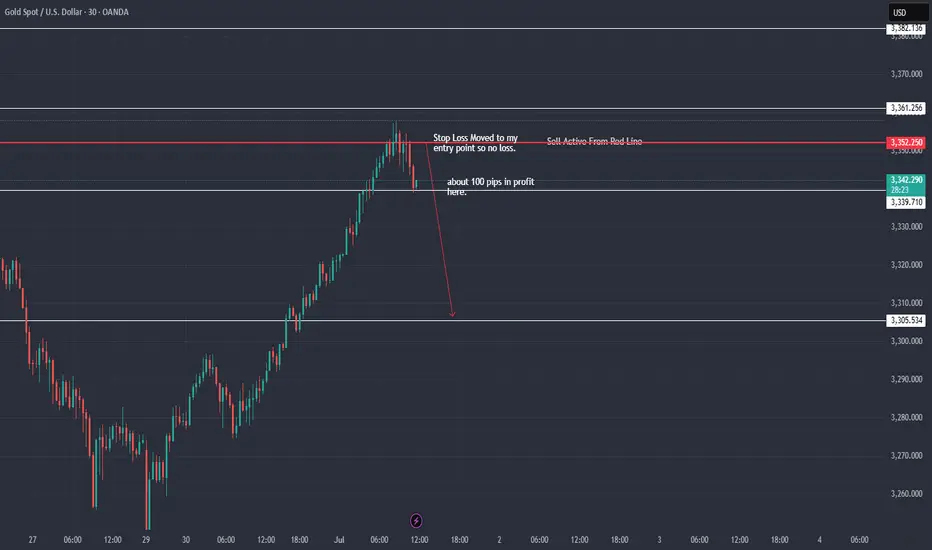
XAU / USD 30 Minute Chart Hello traders. All I can say is KABOOM. 100 pips in profit on this microlot sell trade. I am, as of this writing closing 75% of the trade's profit, moving my stop loss to my entry point (break even) and leaving a runner ( the remaining 25% of the trade) running. What a day. Big G gets all my thanks. Be well and trade the trend. I am very thankful that my analysis was pretty spot on.
XAUUSD GOING SHORTGOLD has recently broken its last low, shifting market structure (CHOCH) and indicating sellers are currently in control. This break opened up 2 clear Supply Zone above — a small base or last bullish candle before the drop — which is a key area where unfulfilled sell orders may be resting.
Price is likely to retrace back into these Supply Zone to fill those orders. Once it reaches this area, we expect selling pressure to resume and push price downward, honoring the imbalance left by the drop.
Entry:
I’m looking to sell from this Supply Zone on a pullback,
This lets me enter at a premium price while trading in direction of the newly established downward momentum.
Target:
The first Target Profit (TP) is set at the next Demand Zone below, where buying pressure might emerge. This Demand Zone is a key area to watch for a reversal or a temporary halt in downward momentum.
Stop Loss:
To control risk, the Stop Loss (SL) is placed just above the Supply Zone.
If price climbs above this area, it would invalidate the Supply’s ability to hold, signalling a potential reversal.
✅ Summary:
• Market has shifted to bearish after breaking last low.
• Supply Zone above is a key area to watch for selling opportunities.
• Sell upon retracement into Supply, with Stop Loss above and Target at Demand below.
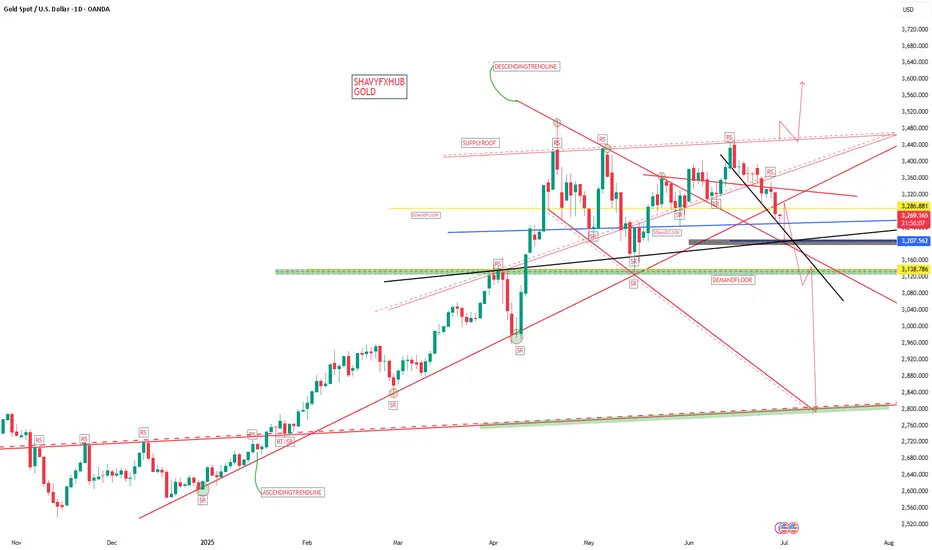
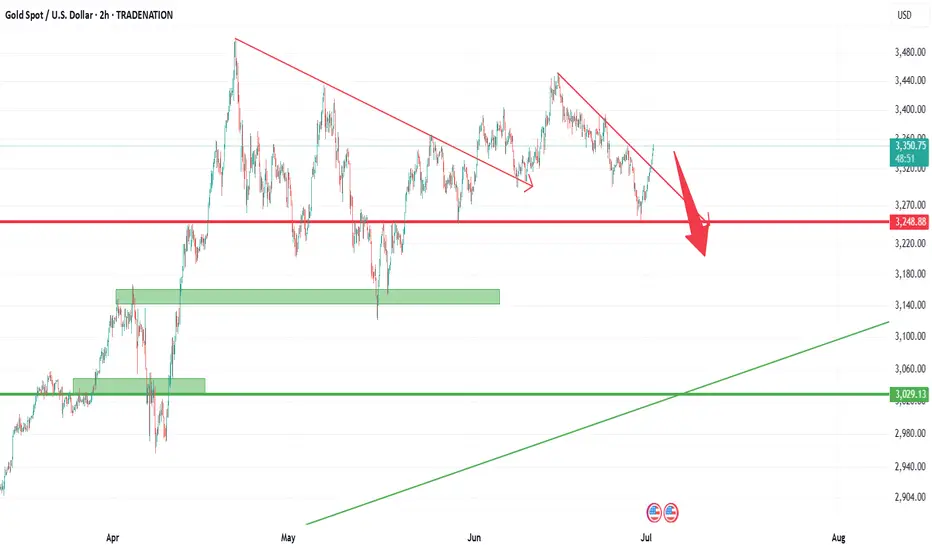
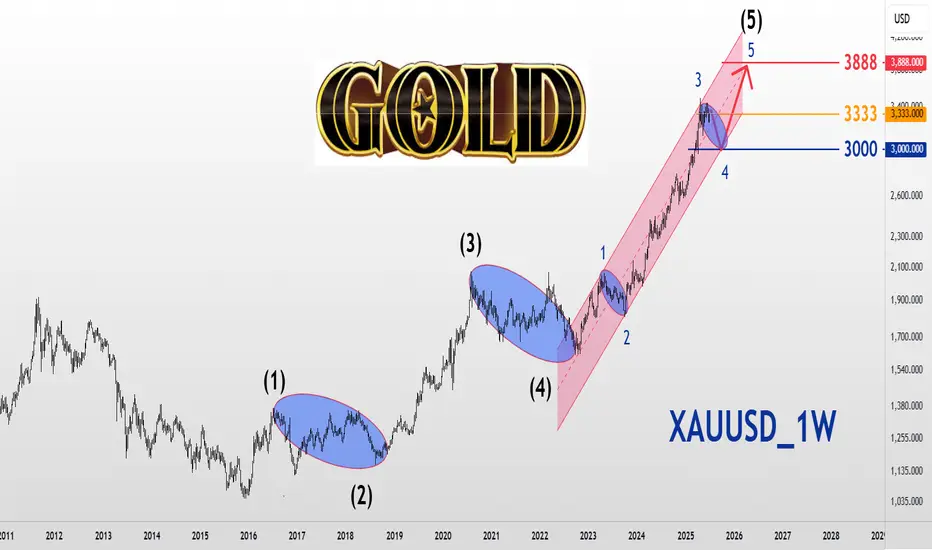
XAUUSD_1WWorld Gold Analysis
Long -term frame time
Eliot wave analysis style
The market is in five waves of climbing and we are expected to be in the 4th wave, with the main and important number being $ 3333, and if the price is maintained as a resistance, it will continue to reform and move to $ 3000, which can be modified for up to 3 months and enters the next wave on October 5, 2025. As a wave 5 and move toward $ 3888.
The original number $ 3333!
Gold Opens Final June Session with Bullish IntentGold market opens the last day of June exploring a bullish buildup through the 3270's, aiming for a projection toward the 3330's. Momentum aligns with a potential breakout if demand continues to hold. follow for more insights , comment and boost idea