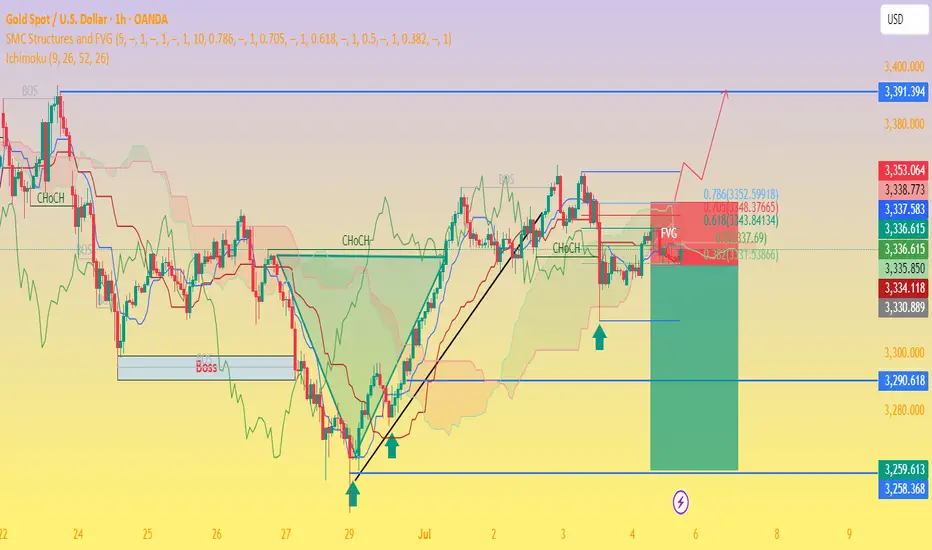
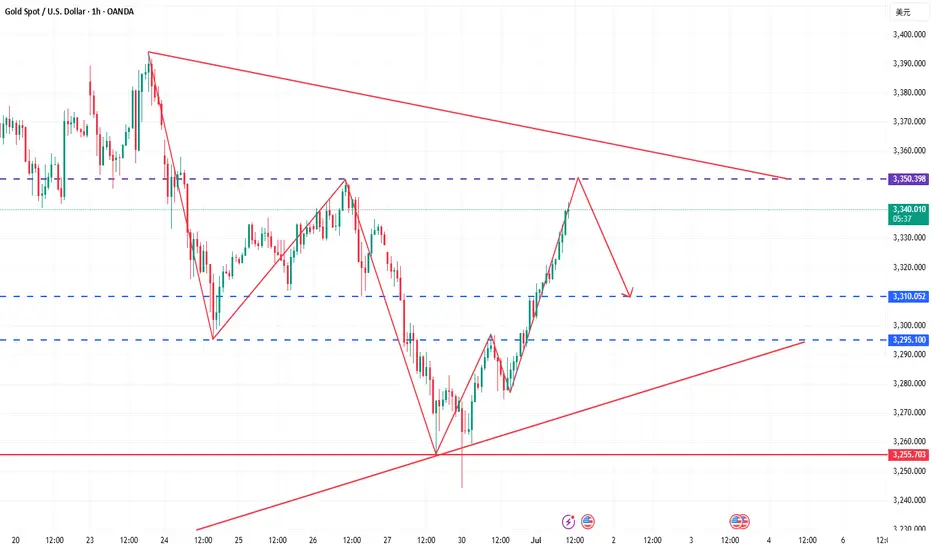
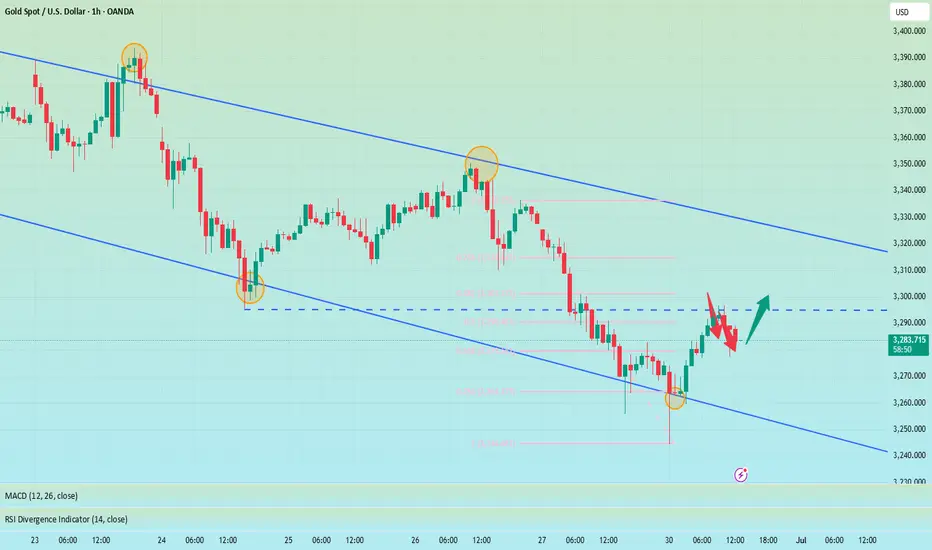
Gold Price Setup: Bullish Continuation or Rejection? 🧠 Chart Analysis (XAU/USD – 1H):
Key Structure Highlights:
CHoCH (Change of Character) zones marked both up and down indicate a battle between bulls and bears.
Recent bullish CHoCH followed by a fair value gap (FVG) retest suggests potential continuation to the upside.
Price recently bounced strongly from demand zone, shown by the green arrows and strong candle reaction.
Ichimoku Cloud:
Price is trying to break back above the Kumo (cloud), a sign of bullish momentum building.
However, resistance is still present with the Kijun and Tenkan lines converging.
FVG (Fair Value Gap):
The current price is attempting to fill and break above the FVG zone.
A successful breakout above this area confirms bullish intention.
Fibonacci Levels:
Price is hovering around the 0.5 - 0.618 retracement zone, often a strong reversal or continuation point.
Upside targets lie near the 0.786 retracement (3352) and ultimate target at 3391, a major resistance level.
Risk Management:
Trade setup shows an excellent Risk:Reward ratio.
Stop-loss placed just below the last structure low.
Potential downside to 3290–3258 if breakout fails.
🟢 Possible Next Move:
Bullish Scenario: If price clears the FVG and breaks above 3353, expect continuation to 3391.
Bearish Rejection: If rejected at FVG/0.618 level, watch for a drop back to 3290 or even 3259.
XAUUSDK trade ideas
XAUUSD H4 Outlook – July 7, 2025“You don’t chase gold. You set the trap, then wait.”
👋 Hey traders — we’re gearing up for a new week on gold, and the H4 chart is starting to speak clearly. After Friday’s clean push into premium rejection zones, price is now compressing beneath a key supply block. Structure is fragile, and the next move will likely come fast.
Let’s position with precision before the breakout.
—
🔸 H4 Bias
Structure remains bearish short-term, with clear lower highs forming below a major supply at 3344–3351.
The broader bias leans neutral as we trade between unmitigated demand and inducement-heavy resistance. Confirmation is everything.
—
🔴 Supply Zones (Sell Areas)
3344–3351
→ H4 Fair Value Gap + OB combo inside premium
→ If price wicks above recent highs and rejects here, it could trigger a clean swing sell.
3380–3394
→ Origin of the last bearish leg + liquidity wick
→ High-risk, high-reward rejection zone if price spikes impulsively this week (e.g. post-Fed tone or surprise volatility).
—
🟢 Demand Zones (Buy Areas)
3265–3275
→ H4 FVG + flip zone + prior sweep level
→ If price taps and holds here, we may see re-accumulation for a move toward 3327–3340.
3235–3246
→ Strong unmitigated OB + discount level
→ Ideal sniper long zone only on clean rejection + structure shift (BOS on M15+).
—
🟡 Flip / Decision Zone
3299–3305
→ EMA50 + micro-range equilibrium
→ If price breaks and holds above this zone with strength, bias turns short-term bullish. If it rejects, continuation down is favored.
—
🎯 Execution Notes
EMA21/50 are acting as active compression bands — watch for rejection pressure
RSI shows no clear divergence yet — but volume is thinning
Liquidity is building above 3340 and below 3265 — prepare for traps both ways
—
🔚 Final Words
Sniper traders aren’t early — they’re precise. If you’ve been reacting too fast lately, this is your week to reset. Gold is telling a story here… but only structure speaks the truth.
🚀 If this helps bring clarity to your outlook, tap follow — we do this daily, with structure, not signals.
—
📢 Disclosure: I use Trade Nation’s broker feed on TradingView and I’m part of their influencer program.
📉 This is educational content, not financial advice.
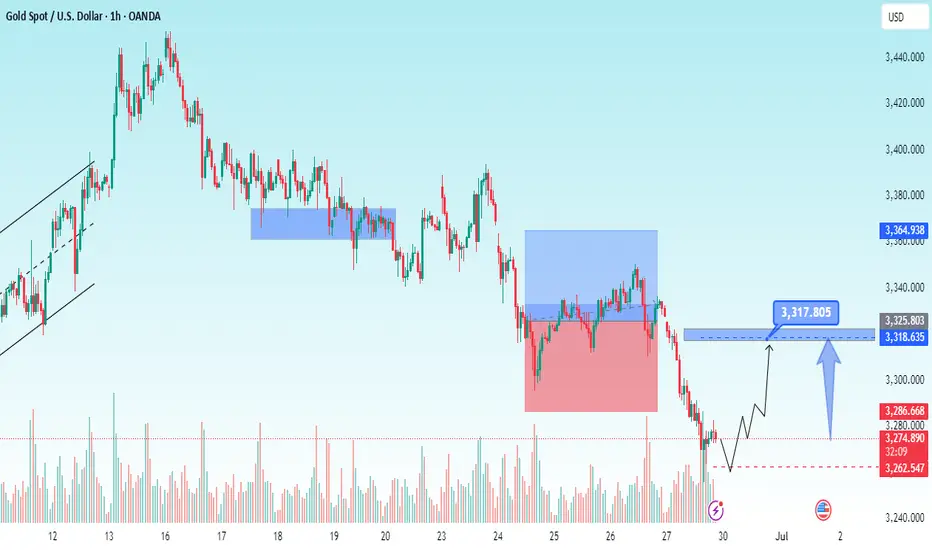
GOLD H2 Intraday Chart Update For 4 July 2025As you can see that GOLD is still in consolidation range above 3300 Psychological Level
Currently prices are still standing @ 3340 nearby Psychological Level, only if market breaks 3368 clearly then it will consider Bullish other below 3368 market still in Bearish Move
Reminder: Today is US Bank Holiday
Disclaimer: Forex is Risky
How I Lost -$837 Trading GoldYou have to understand everyday is different in the markets control your emotions bounce back and play smarter

Tariff shadow and gold's safe-haven game
This week, market sentiment was stirred up and down by Trump's tariff stick. This unconventional president, while firing at Canada and Japan, let the July 9 tariff deadline hang like a knife over the heads of risky assets. If the suspension order is not extended, the market may have to relive the chaos of "Liberation Day" in April - gold will become the "safe-haven spare tire" at this time.
Although the situation in the Middle East has cooled down, gold has stabilized at $3,340 due to the weakness of the US dollar and tariff anxiety. After falling to 3,245 at the beginning of the week, it rebounded quickly, and the bulls were briefly revelry, but the real test will be on Thursday's non-agricultural data - whether it will rush to 3,400 or return to 3,300, it all depends on the face of the US dollar and Trump's next move. If the tariff powder keg is ignited, gold will rise; if it is postponed, this precious metal is afraid to "fall out of favor" again.
Technically, the daily line is long, with short-term support at 3,330-3,336 and resistance at 3,358-3,365. In terms of operation, continue to follow the trend and buy low at night, ambush near 3336-3330, and look at 3400 if it breaks.
The script of gold always switches between "panic" and "greed" - and Trump may be the most competent "director" at the moment.
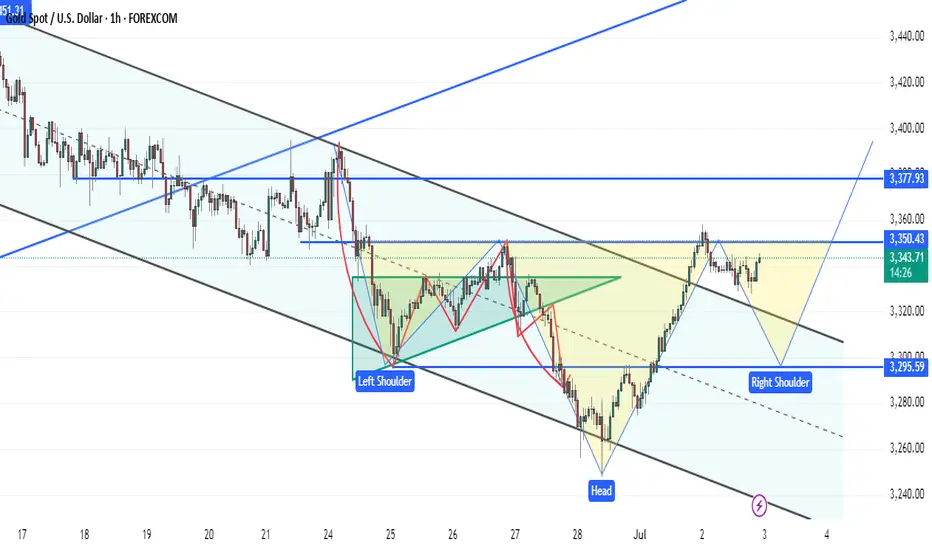
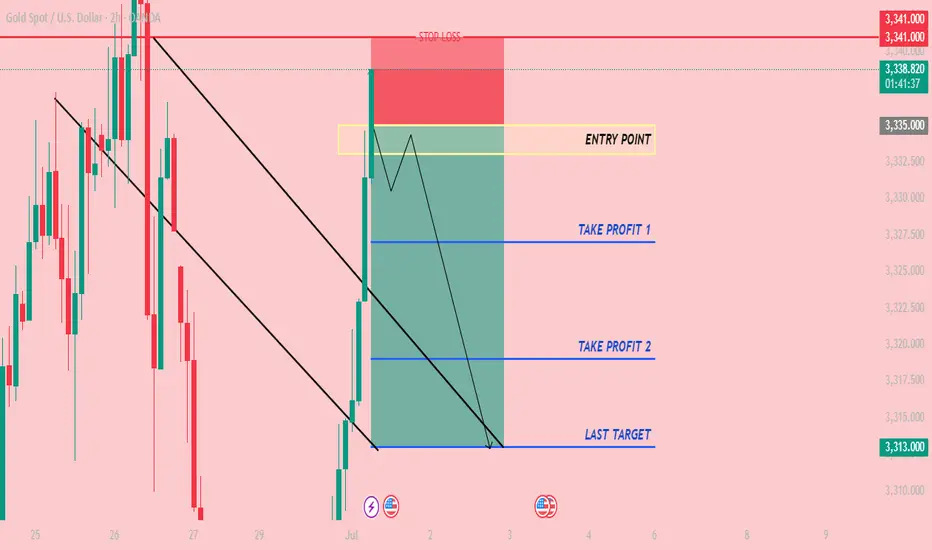
CHECK XAUUSD SIGNAL READ CAPTAINxauusd ) sell zone
( trade satup)
entry point (3335) to (3333) 📊
first tp (3327)📊
2nd target (3319) 📊
last target (3313) 📊
stop loss (3341)❌
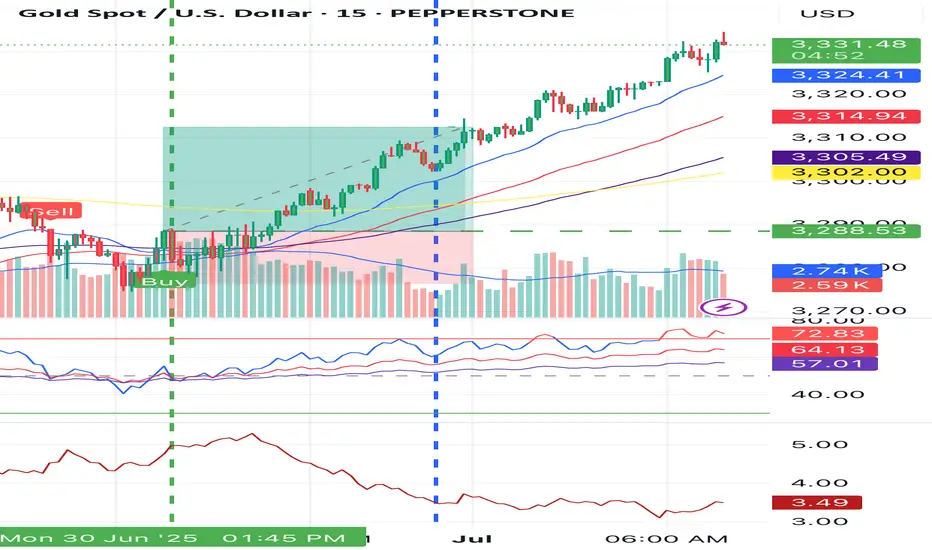
#GOLD Buy 3288.53#GOLD Buy 3288.53
SL 3276.53
TP 3290.53
TP 3298.53
TP 3312.53
Trade at your own risk
Protect your capital
The Wizard 🧙♂️ SWFX
XAUUSD / Technical AnalysisThe overall trend for gold is bearish, in the coming week it seems that gold has the potential to return to the price range of 3310-3320 and continue its downward trend again.
Anyway, the target for gold after the correction will be the $3200 range.
I recommend that you do not forget risk management when entering any trade.
Thanks to @forex_onliner
The bearish trend is confirmed, it’s time to participate.Gold overnight short orders have been stopped at a loss, because it broke through the key pressure of 3325. However, we must grasp the trend of the market, adhere to the idea of technical analysis as the main and news as the auxiliary, and make a comprehensive judgment. Don't be at a loss about the market analysis because of the stop loss. There is nothing wrong with waiting for the market to step back and do more, but the market does not give opportunities, but forces you to chase the rise. Of course, from the perspective of risk ratio, high altitude is definitely more stable than chasing more.
From the current gold trend analysis, the focus on the upper side is the 3340-3350 line of pressure, the short-term support on the lower side is around 3310-3320, and the key support on the 3295-3301 line is focused. Relying on this range as a whole, the main tone of high-altitude and low-multiple participation remains unchanged. In the middle position, it is recommended to wait and see, chase orders cautiously, and wait patiently for key points to enter the market.
Operation strategy 1: Short gold near 3340-3350, target 3325-3315.
Operation strategy 2: Go long on gold around 3310-3320, target 3330-3340.
Geopolitical Spike Fades Fast – Gold Eyes 3300As highlighted in Friday’s analysis, the daily and short-term charts remain messy, but the weekly chart is leaning clearly bearish – with a potential Dark Cloud Cover candlestick formation now confirmed.
🌍 Geopolitical Gap Up... and Quick Rejection
Monday’s Asian open brought a gap up, triggered by renewed tensions in the Middle East. But price failed to break above 3400 and quickly reversed – a textbook sign of weakness, not strength.
🧭 Technical View:
- The weekly candle closed as a Dark Cloud Cover, a strong bearish reversal signal
- The lack of follow-through after the gap up further confirms sellers are still in control
- Price remains below the key 3400 level, showing no bullish momentum behind recent spikes
📌 Trading Plan:
I continue to sell rallies, with an initial target near 3300. If bearish momentum builds, lower levels are in play.
Let the chart lead – don’t get distracted by the noise.
Disclosure: I am part of TradeNation's Influencer program and receive a monthly fee for using their TradingView charts in my analyses and educational articles.
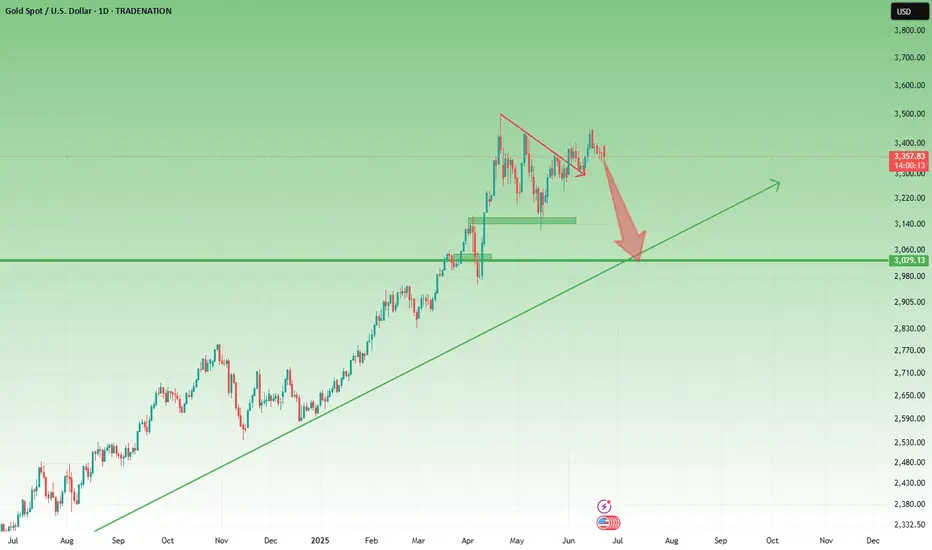
XAU/USD (Gold) Breakout or Breakdown Setup – Key Decision ZoneThe Gold Spot (XAU/USD) price action is currently at a crucial inflection point after consolidating in a rising wedge pattern between ascending support and horizontal resistance. This type of structure typically indicates a strong directional breakout is likely, and the current daily candle shows a close below the ascending support, signaling a potential bearish breakdown confirmation.
🔽 Bearish Breakdown Scenario (Confirmed Below 3250)
If price sustains below the 3250 support breakdown level, it confirms a bearish breakdown from the wedge. The height of the wedge (distance between the base of the move and the resistance) is used to project the downside target, giving us key levels to monitor:
Breakdown Confirmation: Below 3250.00
Target 1: 3111.67
Target 2: 2990.31
Projected Downside Target: 2861.24
This move suggests that gold could enter a deeper correction if buyers fail to reclaim the ascending structure quickly.
🔼 Bullish Breakout Scenario (Above 3500)
On the flip side, if bulls manage to push price back above the 3500 level, it would invalidate the current bearish momentum and confirm a bullish breakout. The projected upside targets are based on the same measured move logic:
Breakout Confirmation: Above 3500.00
Target 1: 3621.90
Target 2: 3741.84
Projected Upside Target: 3855.78
A close above 3500 with volume would set the tone for a fresh rally toward new highs.
🧭 Strategy Outlook
Short Bias (active): Entry below 3250; SL above 3300; TP at 3110 / 2990 / 2860
Long Bias (if reversal): Entry above 3500; SL below 3460; TP at 3620 / 3740 / 3850
Always wait for a strong daily candle close beyond the breakout/breakdown levels before initiating any trades
=================================================================
Disclosure: I am part of Trade Nation's Influencer program and receive a monthly fee for using their TradingView charts in my analysis.
=================================================================

Xauusd Going Towards BuyDespite rising selling pressure on the dollar and mixed US PCE numbers, Gold prices fell further on Thursday, reaching new four-week lows around $3,260 per troy ounce. Collaborating with the decline, recent improvements in the Israel-Iran conflict continue to fuel investor withdrawals from the safe haven region.
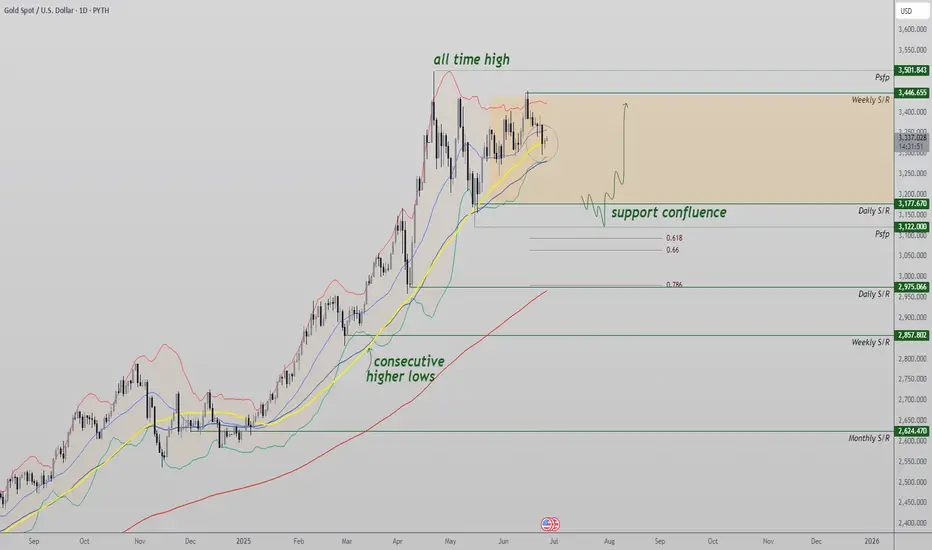
Gold Remains Bullish, But Market Needs Correction Before New ATHGold continues to trend upward with consecutive higher highs and higher lows, but a deeper correction may be necessary before the next major bullish leg can begin with conviction.
Price action on gold remains firmly in a bullish structure. The market has consistently produced strong impulses followed by shallow pullbacks, signaling aggressive buyer interest. However, from a technical trading perspective, current levels may not offer ideal long entries without a corrective move first. A deeper pullback toward support would reset momentum and offer higher probability setups for trend continuation.
Key Technical Points:
- Support Zone at $3,177: Daily support with swing low and 0.618 Fibonacci confluence
- 50 MA + 51 EMA Support: Dynamic moving averages guiding the higher low structure
- Potential Liquidity Sweep: A dip below daily support could trap bears before continuation
Gold’s current uptrend is well-defined, with a clear structure of higher highs and higher lows. Each dip has been aggressively bought, and the market has continued climbing with little resistance. However, this type of trend often leads to overextension, and traders are beginning to look for a corrective pullback to create a more sustainable setup.
The $3,177 support level is the key zone to watch. Not only does this level represent a daily horizontal support, but just below it sits a key swing low and the 0.618 Fibonacci retracement of the most recent leg higher. This area could serve as a prime candidate for a liquidity sweep—where price briefly dips to trap breakout sellers before reversing back upward.
Adding to this, the 50-day moving average and the 51-day exponential moving average are both supporting the trend and aligning with the higher low formation. These moving averages have been providing dynamic support throughout this rally, acting as a technical guide for buyers.
While there is always the possibility that gold continues higher from current levels, a pullback toward the $3,177 area would provide a healthier setup. It would allow the market to reset, rebalance, and potentially attract sidelined buyers who missed the initial move. Such a correction would preserve the higher low structure while maintaining bullish integrity.
What to Expect in the Coming Price Action:
If gold holds above the $3,177 support zone, the bullish trend may resume without deeper retracement. However, a brief dip below that level to sweep liquidity could offer the best long opportunity. Until a corrective move confirms, traders should remain cautious of chasing highs without a valid structure reset. Long bias remains intact as long as the higher low structure holds.
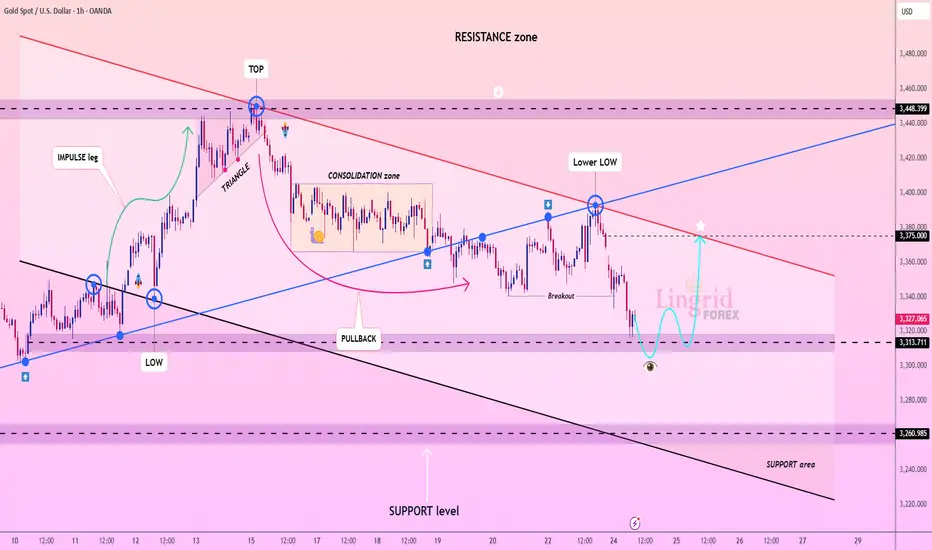
Lingrid | GOLD Retracement Entry Opportunity from Support ZoneOANDA:XAUUSD is attempting to stabilize after breaking below the consolidation zone and forming a new lower low near the 3,313 support. Price action hints at a bullish rebound setup, potentially targeting the 3,375 resistance aligned with the descending red trendline. The structure may shift if price forms a higher low and retests broken support as a springboard.
📈 Key Levels
Buy zone: 3,313 – 3,320
Sell trigger: break below 3,313
Target: 3,375
Buy trigger: higher low and breakout above minor resistance
💡 Risks
Failure to reclaim 3,313 could trigger another sell-off
Resistance trendline near 3,375 remains a rejection risk
Lack of volume confirmation may weaken bullish scenario
If this idea resonates with you or you have your own opinion, traders, hit the comments. I’m excited to read your thoughts!
GOLD Expected Bearish TrendXAUUSD Gold Bearish Trend Outlook
Gold remains in a bearish trend, with technical weakness confirmed as support was tested on Friday. The metal continues to trade under pressure, driven by investor caution ahead of the upcoming U.S. Core PCE Index — a key inflation gauge.
If the data comes in higher than expected, it could delay Federal Reserve rate cut expectations, further weighing on gold prices. However, if the Core PCE data disappoints to the downside, rate cut hopes in July may resurface, providing a potential support base for gold.
Key Levels to Watch:
Immediate Support: 3365
Major Support Zone: 3350
Resistance: 3295 / 3305
Keep Eye on all data share your idea about this analysis we need support from you Guys.
Gold Breaks Trendline – Deeper Correction Ahead?Gold (XAUUSD) has just broken below its short-term ascending trendline formed since mid-May. The candle closed around $3,333, confirming a bearish engulfing pattern and highlighting growing selling pressure after multiple failed attempts to reclaim the $3,383–$3,399 resistance zone (Fibonacci 0.5–0.618).
Key Levels to Watch:
- Immediate Support: $3,315 (tested twice before)
- Main Resistance: $3,383–$3,399 (Fibonacci zone)
- Major Resistance: $3,435–$3,451 (May high zone)
If $3,315 fails to hold, gold could retest $3,285–$3,270, with deeper downside toward $3,222.
Technical Overview:
- The ascending trendline is now broken.
- Bearish engulfing candlestick confirms momentum shift.
- Price rejected sharply from Fibonacci 0.618 – $3,399.
Trade Setups to Consider:
Sell Opportunity: Short near $3,360–$3,383; stop loss above $3,400; targets at $3,315 and $3,270.
Speculative Buy: Watch for reversal patterns near $3,315; stop loss below $3,300; short-term target $3,350–$3,365.
Caution: This week brings major U.S. economic events (GDP, PCE, Fed speeches). Trade reactively, manage risk tightly, and avoid overleveraging.
Gold Prices Retreat, Short-term Bearish Trend PrevailsOn Friday, gold prices rebounded to $3,328 at the start of Asian trading but were resisted, followed by a sustained decline. Influenced by the U.S. May PCE price index data during the U.S. session, prices hit a low of $3,255 and closed at around $3,274, forming a large bearish candlestick with a long lower shadow on the daily chart.
Influencing Factors: Optimistic expectations on trade agreements boosted market risk appetite, weakening gold's safe-haven appeal.
Technical Analysis:
- Daily chart: Gold has broken below the 5-day moving average, with short-term moving averages in a bearish arrangement.
- 4-hour chart: The Bollinger Bands have widened, and prices are trending lower along the lower band. The key resistance level at $3,310 is critical—failure to reclaim this level may intensify short-term selling pressure.
Outlook for Next Week: Events such as the global central bank governors' meeting, non-farm payroll data release, and discussions on Powell's potential resignation will disrupt the market. Gold is expected to fluctuate sharply around $3,270, with caution advised for a secondary bottoming.
Comprehensive Judgment: The bearish probability is high:
- Upper Resistance: Focus on the $3,310–$3,300 range, a key bull-bear dividing line. A breakthrough here could reverse the trend.
- Lower Support: Watch the $3,250 level—breaking below it may open further downside.
Indicator Signals:
- MACD: Bearish crossover below the zero line with expanding green bars, indicating accelerating downward momentum.
- RSI: At 39 in the oversold zone, showing potential for a short-term bottom, but bearish momentum remains dominant.
XAUUSD
sell@3290~3280
sl:3310
tp:3260~3250
I am committed to sharing trading signals every day. Among them, real-time signals will be flexibly pushed according to market dynamics. All the signals sent out last week accurately matched the market trends, helping numerous traders achieve substantial profits. Regardless of your previous investment performance, I believe that with the support of my professional strategies and timely signals, I will surely be able to assist you in breaking through investment bottlenecks and achieving new breakthroughs in the trading field.
Report - 27 june1.
Bond Market Exodus: Why Investors Are Ditching US Long-Term Debt
In Q2 2025, net outflows from US long-dated bond funds hit $11 billion, marking the fastest pace since early 2020. This comes despite more than $39 billion pouring into short-dated funds, which are still yielding attractive real returns due to the Fed's high policy rate.
This flight from the long end is not just about yield differentials — it’s a clear repricing of sovereign risk and fiscal sustainability. The market is beginning to fear that the US is no longer a guaranteed safe haven at the long-duration end of the curve. President Trump’s renewed tax policies — projected to add trillions to the national debt — are weighing on confidence, while incoming tariffs and the risk of structurally higher inflation amplify concerns.
“There is a lot of concern domestically and from the foreign investor community about owning the long end of the Treasury curve.” – Bill Campbell, DoubleLine
Market Implication: The term premium is re-emerging — longer bonds must offer significantly higher yields to attract buyers. In real terms, longer-dated Treasuries are down ~1% this quarter, clawing back losses after tariff-induced volatility in April.
Strategic Allocation:
Stay overweight short-duration debt (SHY, BIL, floating-rate notes) for yield preservation and minimal duration risk.
Avoid duration extension. TLT, ZROZ, and long-dated corporates may face additional downside as issuance ramps and demand fades.
Consider non-dollar fixed income exposure (e.g., EU sovereigns, South Africa, Brazil), particularly where inflation targeting credibility is rising.
Macro Impact:
This shift jeopardizes debt affordability. With $33 trillion in debt and rising interest expense, the US could face debt spiral risks unless inflation softens or fiscal discipline returns. An elevated term premium can ripple into mortgages, corporate borrowing, and municipal finance, potentially crowding out private investment.
2.
Geopolitical Tensions: Iran's Nuclear Program and the Market's Response
Despite US claims of obliterating Iran’s nuclear capabilities in recent strikes, preliminary European intelligence indicates Iran’s 408kg stockpile of highly enriched uranium remains largely intact. It was reportedly dispersed before the attacks — undercutting the narrative of complete neutralization.
President Trump’s remarks, suggesting “nothing was taken out” of the main Fordow facility due to logistical constraints, reflect a public relations overstatement rather than a decisive strategic victory. While US defense officials stand by the attack’s symbolic impact, reports suggest the nuclear program was set back by months, not years.
“Trump exaggerated because he needed to... Anyone who heard his remarks could tell there was a different reality.” — Ayatollah Ali Khamenei
Market Implication:
The gold price remains elevated, closing at $3,328.22, up 0.15% on the day, and +26.81% YTD — a clear hedge against geopolitical instability.
Oil markets initially spiked but reversed as the Israel-Iran ceasefire held. Brent Crude ended at $67.14, down -6.1% over the week.
Defense stocks, particularly in US and Israeli names, are seeing flows as investors anticipate further defense budget expansions.
Strategic Allocation:
Hold or overweight gold (GLD, XAUUSD) in strategic portfolios as a volatility hedge.
Avoid chasing oil at interim highs unless further strikes materialize — use energy exposure as a short-term trade, not a structural bet.
Monitor Iranian retaliation risk and its effect on shipping lanes, which would impact insurance costs and transport-linked equities.
Macro Impact:
With Iran's capacity largely intact, nuclear diplomacy is effectively frozen. The uncertainty adds to regional instability, and markets may underprice the risk of a re-escalation. Meanwhile, continued weapons development forces global powers to shift attention (and potentially resources) away from economic diplomacy.
3.
US Export Collapse: Trade Policy Bites the Domestic Economy
In May, US goods exports fell by $9.7 billion (–5.2%), marking the largest monthly decline since the pandemic crash in 2020, according to the Census Bureau. Exports totaled $179.2 billion, sharply down from April’s figures.
This contraction followed President Trump’s "Liberation Day" tariff blitz, which spooked global trading partners. Despite some tariff suspensions, others — such as a blanket 10% duty and sector-specific metals tariffs — remain active.
“Amid the de-escalation phase of the tariff story, we are now seeing an unwind in both imports and exports.” — James Knightley, ING
Key Export Drivers:
Industrial supplies (crude oil, metals): Down 13.6% in May after a 16% surge in April.
Vehicle exports: Rebounded +3.5% after a 20% drop in April.
Trade deficit: Widened to $96.6 billion, above expectations.
Practical Market Implications:
Logistics & industrial names (FedEx, Caterpillar) face short-term margin pressure.
Commodities sensitive to trade flows — particularly metals — could see softening demand (watch steel and copper ETFs like SLX and COPX).
Dollar exposure may become more volatile as lower exports pressure the current account, contributing to a weaker dollar narrative.
Broader Economic Impact:
With inventories full and international demand softening, US manufacturing will decelerate.
Capex and employment in export-sensitive sectors are at risk if the trade environment doesn’t stabilize.
Investor Strategy:
Short-term caution on transportation (e.g., FedEx reported a sharp drop in China-US freight).
Reallocate toward domestic-facing sectors (utilities, consumer staples) that are more insulated from trade.
Currency traders may view this as a signal to fade the USD if combined with Fed dovishness.
4.
US Debt Avalanche: The Bond Exodus and What It Means for Markets
Investors are rapidly fleeing long-term US bonds, with net outflows reaching $11 billion in Q2, the sharpest retreat since early 2020, according to EPFR data. This comes amid growing concern over the US’s ballooning debt load, worsened by Trump’s proposed tax cuts and trade tariffs.
“It’s a symptom of a much bigger problem... concern about owning the long end of the Treasury curve.” — Bill Campbell, DoubleLine
Why It Matters:
Trump's tax plan is forecast to add trillions to federal debt, compelling the Treasury to issue a flood of bonds.
Simultaneously, tariffs are feared to fuel inflation, which erodes bond values — especially those with long durations.
Market Movement:
Long-term US debt fell ~1% in Q2 (Bloomberg index).
In contrast, short-term US bond funds gained $39 billion in inflows, driven by high yields at the front end of the curve.
“With inflation still above target and heavy government supply, this is driving skittishness about the long end.” — Robert Tipp, PGIM
Practical Investment Outlook:
Expect higher yields at the long end of the curve if debt issuance remains elevated and inflation expectations rise.
Flattening yield curve risk if short-end rates remain high while long-end selling continues.
Duration-sensitive portfolios (e.g. pensions) may suffer performance drag unless repositioned.
Global Spillovers:
A weaker long bond market raises benchmark rates globally, making it costlier for emerging markets to borrow.
Foreign investors (e.g., Japan and China) may diversify out of Treasuries, potentially moving capital into higher-yield EM debt or European assets.
The sell-off contributes to dollar weakness, especially when coupled with trade disruptions and Trump’s criticism of the Fed.
Investor Strategy:
Reduce duration exposure; consider floating-rate notes or shorter-dated fixed income instruments.
Explore international bonds, especially EM local currency debt, which is currently outperforming.
Use steepening yield curve trades (e.g., 2s/10s steepeners) as a way to hedge fiscal risks.
5.
Iran’s Nuclear Resilience: What Intel and Markets Tell Us
Despite claims from President Trump that Iran’s nuclear capabilities were “obliterated” in recent airstrikes, early intelligence assessments suggest otherwise. According to European and US officials, Iran’s 408kg stockpile of near-weapons-grade uranium remains largely intact, having been dispersed to other locations before the strikes.
“It did not achieve anything... Trump exaggerated.” — Ayatollah Ali Khamenei
Strategic Interpretation:
US and Israeli strikes targeted Fordow, Natanz, and Isfahan — key nuclear infrastructure.
While significant damage occurred, no total structural collapse was confirmed.
This reinforces that Tehran maintains breakout capacity, and could resume enrichment rapidly if it chose to.
“The nuclear programme suffered enormous damage... but not complete destruction.” — Rafael Grossi, IAEA
Market Impact and Geopolitical Outlook:
The revelation that Iran’s uranium reserves survived the assault reduces confidence in the effectiveness of US deterrence.
Oil markets remain unfazed. Traders priced in the symbolic nature of Iran’s missile response and read the US-Israel actions as limited in strategic disruption.
Brent crude fell sharply by 6.1% to $67/bbl post-ceasefire — evidence markets anticipate no extended supply shock.
What to Expect:
Volatility premium on oil is falling. No major disruption to Strait of Hormuz = no major repricing.
Increased likelihood of backchannel diplomacy, especially as Tehran seeks to assert survival and avoid regime destabilization.
However, shadow escalation (e.g., cyber, proxy strikes) remains plausible.
Practical Asset Implications:
Oil traders are in sell-the-spike mode: Risk-on reactions are now short-lived.
Defensive commodity plays (e.g., gold) saw a pullback as perceived geopolitical risk faded.
Military-industrial equities may experience cooling momentum unless new threats emerge.
Risk of sanctions rollbacks or renegotiations could reprice energy and emerging market assets tied to Iran’s trade (e.g., India, China).
6.
Export Shock: Tariffs Bite into US Trade Performance
US goods exports plummeted by 5.2% in May, marking the sharpest drop since 2020, as President Trump’s aggressive “Liberation Day” tariff strategy triggered a major disruption in global demand for American goods. Total exports fell to $179.2bn, down $9.7bn from the prior month.
Breakdown:
Industrial supplies (including oil and metals): –13.6%
Vehicles: +3.5% (recovering from a –20% collapse in April)
Trade deficit widened to $96.6bn, beating Wall Street expectations.
“This is the tariff shock starting to filter into real data.” — ING’s James Knightley
Economic Implications:
Tariff retaliation and inventory overhang are key drivers of the export decline.
Partners reduced US imports anticipating further tariffs or supply chain reshuffles.
The loss of export revenue compounds fiscal stress, especially with simultaneous tax cuts and increased military spending.
Sectoral Risks:
Energy exporters (e.g., Texas oil firms) are hit hard — crude exports falling.
Industrial metals and machinery producers face slower foreign orders.
Shipping and logistics (e.g., FedEx) flagged the US–China lane as the weakest and most unpredictable trade route.
Market Outlook:
Dollar weakness persists, with the Dollar Index near a 3-year low, reflecting investor fear over twin deficits (fiscal + trade).
Equities may remain resilient, especially domestically focused or tariff-insulated names.
However, multinationals with global exposure could underperform due to shrinking foreign sales.
What to Expect:
Volatility in trade data until clarity returns on tariff regimes.
Renewed calls for bilateral trade talks or exemptions from key US partners (e.g., EU, Mexico).
Watch for nearshoring trends to accelerate as companies avoid tariff risk.
7.
EM Rally: Emerging Markets Outshine Developed Peers Amid US Fiscal Anxiety
In a stunning reversal of past trends, emerging market (EM) assets are rallying across asset classes in 2025 — defying both the global macro gloom and the shadow of US tariff policy.
By the Numbers:
JPMorgan EM Local Bond Index: +10% YTD
MSCI EM Equity Index: +10%
MSCI World (Developed Markets): +4.8%
EM bonds in global AUM: Rising from a low 5% share
This rotation reflects a clear diversification trend away from dollar assets, fueled by erratic US policymaking, record federal debt, and a weakening dollar. The Treasury-specific risk premium is rising — and EMs are absorbing the flow.
Drivers of the Rally:
Dollar weakness: Eases FX pressure, gives central banks room to cut.
Inflation-adjusted yields in EMs at 20-year highs, making debt highly attractive.
Declining fiscal risks in EMs contrast with ballooning G7 debt burdens.
China and South Korea lead equity optimism with innovation themes and policy clarity.
“Even small inflows are having disproportionately large effects.” — Goldman Sachs’ Kevin Daly
Risks and Rotation:
Geopolitical conflict in the Middle East did not dent EM flows — a clear sign of confidence in regional resilience.
Oil prices falling reduced tail risks for EM energy importers like India and South Korea.
Still, EM equity outflows in Q1 were sizable (–$22bn), only partially reversed in May–June (+$11bn net).
Practical Strategy for Investors:
Local currency bonds in Brazil, South Africa, Indonesia — rich yields, FX tailwinds.
Tech-heavy equity plays in China and Taiwan — exposure to global AI boom.
EM corporates still lag — cautious positioning advised due to higher default risk.
What to Watch:
Further EM policy easing, especially in Asia, will support equities.
US yield volatility may occasionally disrupt flows, but the narrative has shifted.
Multi-asset portfolios should consider overweighting EM exposure tactically in H2 2025.
8.
Shell, Sovereign Risk, and the Oil Sector Outlook: BP Takeover Denied, Sector Under Pressure
Shell’s explicit denial of takeover talks with BP, despite media speculation, offers clarity but also raises key strategic questions for the European energy sector. The sector continues to grapple with sluggish price action, mounting decarbonization pressures, and a renewed focus on capital discipline.
Key Takeaways:
Shell stated it had “no intention” of acquiring BP and had not been in talks, invoking a six-month standstill period under UK takeover law.
BP shares rose 1.3%, Shell +0.5%, largely a relief rally and not based on synergies.
This quells short-term merger speculation, but it underscores the pressure on oil majors from activist investors (e.g., Elliott’s 5% stake in BP) demanding deeper cuts, higher returns, and optionality in energy transition strategy.
“Shell has preferred buybacks to acquisitions.” — Wael Sawan, CEO
Sector-Wide Implications:
BP’s aggressive renewables push has backfired, denting valuation and making it a takeover target.
Oil majors are capital-rich but investment-conservative, amid uncertain demand outlook and energy policy volatility.
High integration costs and risk of job losses are politically toxic, limiting mega-deal feasibility.
Practical Market Interpretation:
With Brent crude hovering around $68–$70, oil equities remain valuation-sensitive and vulnerable to dividend cuts or FX shocks.
Investors should favor capital-efficient names with strong free cash flow and disciplined buyback programs.
Avoid speculative merger plays; instead, track cost reduction execution and decarbonization pace.
What to Watch:
Further activist pressure on BP and Total to streamline operations.
Potential US M&A activity in smaller shale players instead of global giants.
Any signs of OPEC+ discord or US SPR use amid volatile demand expectations.
9.
New World Development: Hong Kong’s Property Giant Faces Systemic Risk
New World Development (NWD), one of Hong Kong’s largest property conglomerates, is undergoing a delicate refinancing operation amid ballooning debt, weak property sales, and a declining tourism-reliant retail economy. The implications ripple across the Asian credit markets, Chinese property sector, and Hong Kong's financial stability.
Key Financials:
Net debt: HK$124.6bn
Refinancing talks: HK$87.5bn in bank loans
Interest costs > operating profits in 2H FY2024
Annual loss: HK$20bn, the first in two decades
Shares down 22% YTD, market cap ~HK$14bn
The developer’s leverage and stalled mainland China expansion expose it to credit market deterioration, at a time when trust in property-linked balance sheets is thin.
“It won’t be a question of how much you’re willing to pay — the cover won’t be available.” — Everest CEO Jim Williamson, referring to US casualty insurance but resonant here too.
Systemic Concerns:
Barclays estimates NWD accounts for 7% of all HK commercial property loans — nearly double Evergrande’s systemic exposure in mainland China.
Property defaults or asset fire-sales could cause bank provisioning hikes, spread to retail REITs, and exacerbate deflationary pressures.
Mitigating Actions:
NWD pledged flagship assets (e.g., Victoria Dockside) as collateral.
Actively selling projects at discounts.
Chow Tai Fook Enterprises selectively buying assets, indirectly supporting liquidity.
However, refusal to engage with bondholders, deferred perpetual interest payments, and a leadership reshuffle have eroded market confidence.
Strategic Implications for Investors:
Avoid unsecured Chinese real estate debt—bondholder transparency is poor.
Favor secured exposure or government-backed REITs tied to stable rental income.
Look for HKMA guidance: policymakers are signaling banks to avoid panic provisioning, implying the government will step in to prevent contagion.
Broader Macro Read:
Reflects fragility of China’s "recovery-lite" property model, where urban development exceeds real demand.
HK real estate’s softening is also a proxy for declining mainland tourism, rising capital costs, and shifting investor preferences.
10.
Meta’s Copyright Win: Legal Green Light for AI Model Training
Meta's recent legal victory over authors suing for unauthorized use of books in AI training marks a critical turning point in the legal framework surrounding AI development. The U.S. District Court ruled that the tech giant’s use of millions of texts to train its LLaMA models constituted “fair use”, delivering a massive tailwind to AI innovation — and to equity investors betting on the sector.
Case Summary:
Plaintiffs included notable authors like Ta-Nehisi Coates.
Meta trained its AI on LibGen-sourced books without permission.
Judge Chhabria: Ruled for Meta due to “poor argumentation” by plaintiffs — not because the court inherently favored AI use.
“This ruling does not stand for the proposition that Meta’s use of copyrighted materials to train its language models is lawful. It stands only for the proposition that these plaintiffs made the wrong arguments.” — Judge Vince Chhabria
Precedent and Practical Impact:
Reinforces the fair use doctrine for transformative technologies.
Encourages aggressive data utilization strategies by other firms.
Raises the bar for future copyright suits, requiring stronger arguments like market harm (e.g., reduced author royalties).
Implications for Tech and Equity Markets:
AI development costs may fall sharply as legal uncertainty fades.
Generative AI leaders (Meta, Anthropic, OpenAI) now face fewer near-term litigation barriers.
Paves the way for AI ETF inflows, bolsters AI-leveraged tech indices (e.g., SOXX, QQQ).
Equity long positions in semis (NVDA, AMD), cloud (MSFT, GOOGL), and enterprise AI (CRM, ORCL) become even more strategic.
Regulatory Outlook:
A longer-term battle is likely over “market dilution” claims.
Courts may soon have to decide whether AI-generated outputs undermine economic incentives for human creators.
Policy frameworks from the EU or US Congress are likely within 12–18 months.
Strategic Takeaways for Investors:
Increase exposure to AI infrastructure (e.g., Nvidia, Micron, Arista).
Maintain vigilance on evolving IP litigation trends — regulatory tone may shift depending on 2025 political outcomes.
Avoid over-concentration in companies still facing unresolved copyright or data privacy battles (e.g., Open-source LLMs with gray training data).
11.
ETF Innovation: ‘Autocallables’ Go Retail – A Structural Shift in Yield Exposure
The launch of the first US-listed ETF tracking autocallable structured products by Calamos Investments, with JPMorgan support, signals a transformative shift in how retail investors access complex income strategies. Once limited to ultra-high-net-worth clients, these derivatives — with yields near 14.7% — are now democratized through a simple ticker trade.
What Are Autocallables?
Autocallables offer periodic coupons unless a linked index (e.g., S&P 500) falls below a pre-set barrier. If the barrier is breached consistently, investors risk losing principal. They are akin to structured credit instruments but are tied to equity indices, not borrowers.
Triggered by market declines.
Maturity: typically 3 years, quarterly checks.
Final protection barrier: ~60% of starting level — breach = principal loss.
ETF will hold 52+ autocallables diversified by issuance date.
Investment Mechanics:
Calamos Autocallable Income ETF (CAIY) charges 0.74% annual fee — above the average for US derivative-income ETFs (0.51%).
It’s part of a wider trend: structured outcome ETFs have exploded from $3.5bn in 2019 → $179bn today (Morningstar).
Mimics yield exposure of high-yield bonds, but linked to equity volatility.
Analyst Commentary:
Ben Johnson, Morningstar: “ETFs are taking share from all financial products — not just mutual funds, but also from bespoke structured notes.”
Elisabeth Kashner, FactSet: warned of misunderstanding risks: “Advisers will struggle to explain these. If markets fall, protection and yield disappear.”
Practical Implications:
Retail investors gain access to high-yielding structured credit proxies.
If adopted at scale, this could divert flows from traditional high-yield bonds and annuities.
Volatility derivatives embedded in autocallables will impact options markets and hedging strategies.
Risk Outlook:
In a sharp downturn, coupon stops and capital protection collapses — potentially leading to double-digit losses.
These ETFs may suffer sudden illiquidity if linked indices breach multiple trigger levels at once.
Systemic Considerations:
Broad adoption of these ETFs could amplify equity downside during sharp corrections — as dealers hedge risk via S&P futures.
Scenario: A systemic correction triggers autocallable barrier breaches, prompting delta-hedging cascades → market destabilization.
Investor Strategy:
Use as non-core, tactical exposure for income in low-volatility environments.
Monitor S&P drawdowns and ETF option volumes for stress signals.
Avoid relying on these instruments for downside protection in portfolios targeting retirement stability.
12.
Wall Street Outlook: Dollar Slide, Powell Speculation, and Inflation Signaling
Markets steadied this week as geopolitical tensions cooled with the Iran-Israel ceasefire, but underlying stress in key asset classes persists — particularly in foreign exchange and rate-sensitive sectors. Traders are recalibrating for what could be a pivot in US monetary policy, as political noise intensifies over Fed leadership and dollar weakness accelerates.
Dollar Pressure Deepens:
The US Dollar Index slid to a three-year low, falling 0.5% after the Wall Street Journal reported that President Trump may replace Fed Chair Jay Powell earlier than expected.
The euro surged to $1.1710, its strongest level since September 2021.
“We suspect that some of this narrative is seeping into perceptions,” said Macquarie’s Thierry Wizman, pointing to speculation over Fed independence.
This decline is especially concerning given the rebound in Treasury yields, which would traditionally support the greenback. Instead, we are witnessing a breakdown in classic correlations, as political interference becomes a dominant narrative.
Powell’s Job and Policy Path:
The idea of a “shadow chair” to pressure the Fed into rate cuts has unnerved institutional allocators. The White House denied imminent changes but confirmed the president’s “right to change his mind.”
This raises risk premiums around Fed credibility, especially with inflation still a threat and growth signals weakening.
Any leadership uncertainty at the Fed historically results in higher long-end yields due to perceived policy drift or political bias.
Safe Havens and Gold Dynamics:
Gold fell 0.2% to $3,324/oz, losing some haven allure post-ceasefire.
Continued outflows are expected unless inflation data surprises to the upside or Fed intervention appears politically constrained.
Equity Markets:
S&P 500 closed just under its all-time high, up 0.6%.
Risk-on sentiment is heavily liquidity-driven, with AI optimism (led by Nvidia) adding a secondary tailwind.
Oil and Inflation:
Brent crude rebounded to $68.49/bbl, up 1.2%, despite subdued supply risk.
Inflation-linked assets remain moderately priced, but any disruption to the Strait of Hormuz or further US-China escalation could reignite tail-risk pricing.
Practical Implications:
Dollar weakness can spur a rotation into EM equities, gold, and real assets.
Investors should brace for increased FX volatility and repricing of global rate differentials.
Portfolios with high USD exposure may benefit from increased geographical diversification.
TIPS and short-duration Treasuries become more attractive as stagflation hedges in case Powell is replaced with a dovish successor.
QQQ, SPY, NVDA & GOLD Daily Trade SetupsIn this update we review the price action in the QQQ, SPY, Nvidia & Gold and identify the next high-probability trade setups and price objectives to target. To review today's video analysis, click here!

XAU/USD 15M CHART PATTERNHere's a breakdown of your XAUUSD (Gold vs USD) Buy trade setup:
---
🟢 Trade Type: Buy (Long)
Entry Price: 3321
---
🎯 Take Profit Levels:
1. TP1: 3330 (9 pips gain)
2. TP2: 3340 (19 pips gain)
3. TP3: 3350 (29 pips gain)
---
🔴 Stop Loss:
SL: 3305 (16 pips risk)
---
📊 Risk-Reward Ratios:
TP1: ~1:0.56
TP2: ~1:1.19
TP3: ~1:1.81
---
✅ Analysis:
The setup shows a moderate risk with potential for compounding gains.
Ensure there's enough momentum or support confirmation at or around 3321.
Your stop loss is fairly tight (16 pips) — consider volatility during news hours (like NFP or Fed announcements).
---
Would you like a chart analysis, help with position sizing, or automating this setup (e.g., for MetaTrader/TradingView)?
Go long on dips and short on rallies📰 News information:
1. Gold market liquidity at the end of the month
2. Impact of geopolitical situation
📈 Technical Analysis:
Last week we predicted that gold would rebound. Today, after gold rebounded as expected, we gave a short trading strategy. Gold fell precisely at the point we gave, 3295, and successfully hit our TP3280-3270. The result confirmed the correctness of our trading strategy. Next, we will focus on the long trading opportunities below 3270-3260.
🎯 Trading Points:
BUY 3270-3260
TP 3290-3300
SELL 3295-3300-3310
TP 3280-3270
In addition to investment, life also includes poetry, distant places, and Allen. Facing the market is actually facing yourself, correcting your shortcomings, confronting your mistakes, and strictly disciplining yourself. I hope my analysis can help you🌐.
TVC:GOLD FXOPEN:XAUUSD PEPPERSTONE:XAUUSD FX:XAUUSD FOREXCOM:XAUUSD OANDA:XAUUSD
Liquidity Grab Complete – Eyes on 3390 Price just grabbed liquidity and is now targeting the 3390 zone.
Wait for the pullback – the next move could be big.
Smart money waits, not chases. Watch how price reacts.
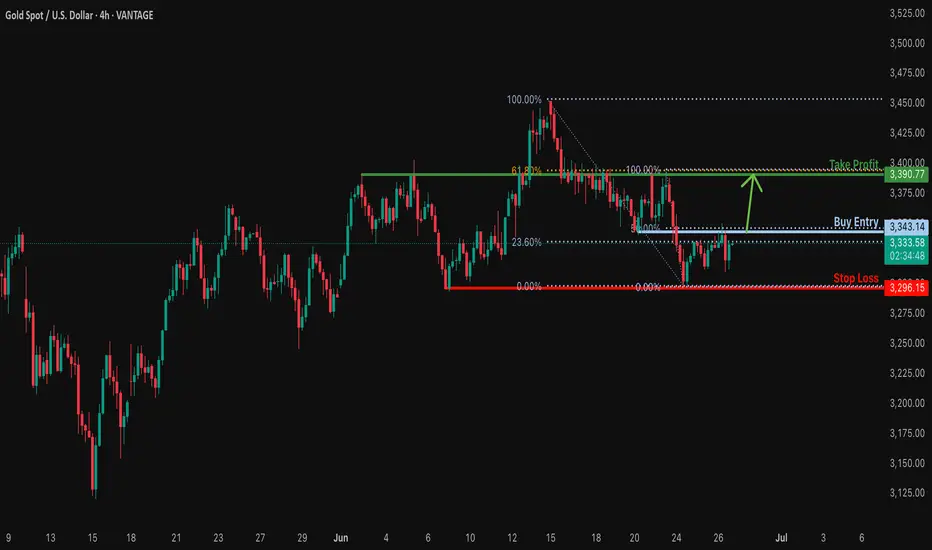
Bullish breakout for the Gold?The price is reacting off the resistance level which is a pullback resistance that aligns with the 50% Fibonacci retracement and a breakout of this level could lead the price from this level to our take profit.
Entry: 3,343.14
Why we like it:
There is a pullback resistance level that lines up with the 50% Fibonacci retracement.
Stop loss: 3,296.15
Why we like it:
There is a pullback support level.
Take profit: 3,390.77
Why we like it:
There is a pullback resistance level that aligns with the 61.8% Fibonacci retracement.
Enjoying your TradingView experience? Review us!
Please be advised that the information presented on TradingView is provided to Vantage (‘Vantage Global Limited’, ‘we’) by a third-party provider (‘Everest Fortune Group’). Please be reminded that you are solely responsible for the trading decisions on your account. There is a very high degree of risk involved in trading. Any information and/or content is intended entirely for research, educational and informational purposes only and does not constitute investment or consultation advice or investment strategy. The information is not tailored to the investment needs of any specific person and therefore does not involve a consideration of any of the investment objectives, financial situation or needs of any viewer that may receive it. Kindly also note that past performance is not a reliable indicator of future results. Actual results may differ materially from those anticipated in forward-looking or past performance statements. We assume no liability as to the accuracy or completeness of any of the information and/or content provided herein and the Company cannot be held responsible for any omission, mistake nor for any loss or damage including without limitation to any loss of profit which may arise from reliance on any information supplied by Everest Fortune Group.