Market Recap & Forecast – Egyptian EditionMarket Recap & Forecast – Egyptian Edition
Yalla ya shabab—before you run off to Sahel or your cousin’s mashwi, let’s break down the market moves. Bring your tea—we’re about to see how they played us like a baladi tabla.
🗓️ 3-Day Recap (June 30 – July 2)
✅ Monday (June 30)
Market woke up strong—“Ana mesh hayemny!” like Adel Emam in El Irhab Wel Kabab.
Closed above 3302—bulls were flexing harder than Mekky in El Kabeer Awy saying “Eh da? Eh da? Enta betgannen ya basha?”
Momentum nearly maxed out—like your cousin after 3 Red Bulls.
RSI ~54, climbing.
Volume big and bold.
Translation: Bulls controlled everything—“El gameya di beta3ty ana!”
✅ Tuesday (July 1)
Tried to smash 3360–3394—market replied with Adel Emam’s classic:
“E7na benedhak 3alek!”
Closed near 3330, confused like a tourist in Sayeda Zeinab.
Volume dropped—enthusiasm disappeared faster than konafa on the table.
Market Maker Move:
“Ta3ala ta3ala, khod fake breakout we yalla salaam!”
✅ Wednesday (July 2)
Price stuck in a boring tight range—like someone waiting for their turn at the Mogamaa.
RSI still climbing but exhausted—“Khalas ya basha, malhash ta3ma,” as Mekky would say.
EMAs clustering—“Mafeesh haga hte7sal.”
Volume low—everyone thinking about the holiday.
Conclusion: The market was basically on vacation already.
📊 What’s Coming July 3rd (Cairo Time)
Set your alarms if you’re not too busy watching El Kabeer Awy reruns:
2:15 PM Cairo: ADP Jobs—could send the market spinning.
4:00 PM Cairo: ISM Services PMI—maybe some drama.
4:30 PM Cairo: Oil Inventories—“keda ya basha, haga sadeema.”
Early close because Americans have fireworks and kebab to grill.
🔍 Levels to Keep an Eye On
Fib Retracements:
38%: 3355
50%: ~3320
61%: 3302–3310
Zones:
🟥 Sell Zone (Habibi, Calm Down): 3394–3433
🟨 Chop Zone (El Malaal): 3330–3360
🟩 Buy Zone (Inshallah Bounce): 3246–3302
Above 3394? “Eh da? Enta betla3 3aleena?”
🕵️ Market Maker Tactics
Step 1: “Yalla, ne3mel rally zay el aflam el mosalsalat.”
Step 2: Sell into your excitement.
Step 3: “Yalla salaam,” as Adel Emam would say.
Step 4: Leave you staring at your screen, thinking:
“Ana mesh fahim haga!”
⚡ Forecast for July 3rd
Liquidity? “Ra7et fein?”—basically gone.
Early spike to 3394? Maybe—but “ma tesdaa2sh!”
By the afternoon, expect the market to drift back to 3300 for a nap.
🎲 Chances:
70% sideways boredom.
30% quick stop hunt to ruin your mood before mashwi.
📈 Hypothetical Trade Setup (Just for Education—Khalas ya basha)
Sure—here’s a clean, actionable rewrite that keeps the exact meaning, instructions, and flow but is tighter, clearer, and direct:
🟡 ENTRY PLAN
Scenario 1 – Sell the Trap
Setup: Price spikes into 3394–3430
Entry: Sell Limit at 3390
Confirmation:
✅ 1-minute Delta turns negative
✅ RSI fails to hold above 62
✅ Footprint shows absorption
Stop Loss: 3435
Target 1: 3330
Target 2: 3310
Execution: Place limit order. No chasing.
Scenario 2 – Buy the Clean Break
Setup: Sustained buying above 3430
Entry: Buy Stop at 3432
Confirmation:
✅ 5-minute close over 3430
✅ Volume >250% of 5-minute average
✅ Delta +1000 or higher
Stop Loss: 3395
Target 1: 3465
Target 2: 3480
Execution: Stop order to catch breakout momentum.
Scenario 3 – Fade into Reversion
Setup: Price fails to hold above 3368 intraday Fib
Entry: Market Sell below 3365
Stop Loss: 3390
Target: 3331 (POC)
🛡 Risk Controls
Max risk per trade: 1–2% of total equity
If price stays between 3360–3390 on low volume, do nothing.
Why?
Resistance stubborn—like Adel Emam yelling “Ana la!”
Market makers cashing out before the holiday.
Pre-holiday rallies disappear faster than mekka7a in Ramadan.
❓ Q1: What should you do while waiting for 3390?
Answer:
Absolutely nothing.
You do not:
❌ Short below 3390 without confirmation
❌ Flip bias every 15 points
❌ Chase 1-minute candles just to feel busy
Why?
Because 3360–3390 is the trap zone. Market Makers churn liquidity here, run stops, and create noise to bait impatient traders.
✅ Instead, you watch:
Does price consolidate under 3390?
Is volume drying up?
Is delta divergence building?
Your role is simple:
Sit on your hands until price enters your control zone.
Trading is 90% waiting. The other 10% is precise execution.
❓ Q2: What if price never hits 3390?
Answer:
If the setup doesn’t trigger, you do nothing.
Example:
Price never reaches 3390
No volume spike
No delta confirmation
Result:
✅ No trade
✅ No regret
✅ No FOMO
You are not throwing darts in the dark. You are running a clear plan:
If your criteria are met, you act.
If they’re not, you stay flat.
Example No-Trade Scenario:
Price stalls between 3350–3380 all day
Volume stays low
No stop sweep or breakout
You wait and protect your capital.
🔥 Pro Tip
If you feel you must do something:
Tighten your watchlist
Set conditional orders
Check correlated markets (Silver, DXY, yields)
Watch VWAP and ATR for shifts
Update your bias at each session open (London, NY)
But never force a trade out of boredom.
Here’s the reality:
Most of your profit will come from 2–3 clear, high-quality trades a week—not from taking 50 random entries.
✅ Quick Cheat Sheet
Trend: Bullish but exhausted.
RSI: ~56 and losing steam.
Levels: 3355, 3368, 3394
Zones:
🟥 Sell: 3394–3433
🟩 Buy: 3246–3302
Liquidity: “Mafeesh!”
Market Makers: Already on holiday.
⚠️ Reminder:
This is for learning, not for throwing your salary in the market. As Adel Emam said:
“Elly yetgawwez emra2a te7tag el falas.”
(He who marries a woman needs money—same with trading. Don’t blow your budget.)
XAUUSDK trade ideas
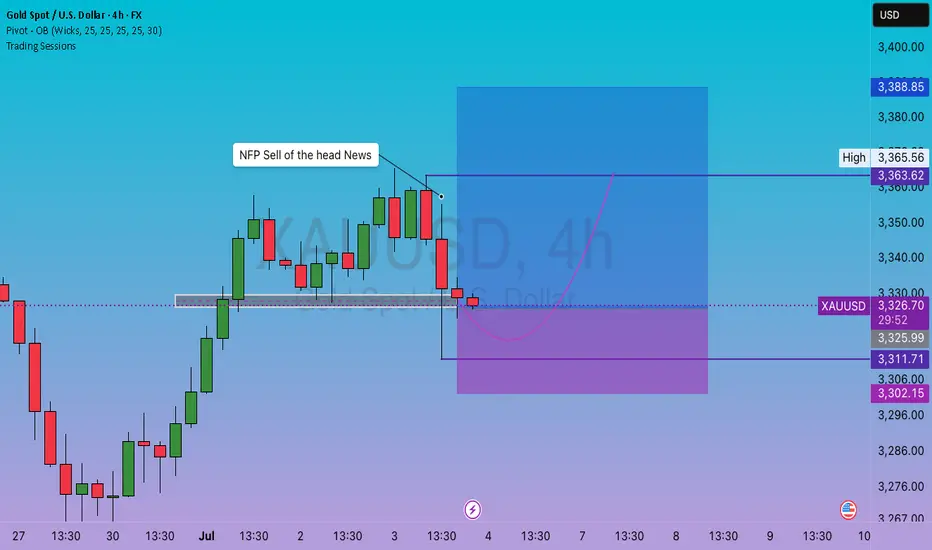
GOLD XAUUSD The ADP Non-Farm Employment Change report for today showed a surprising decline of 33,000 jobs, well below the forecast of a 99,000 forecast and down from the previous month’s modest gain of 29,000 jobs.
Key Details:
This negative figure indicates that private businesses in the US shed 33,000 jobs in June, marking a contraction in private-sector employment—the weakest report since March 2023.
The report is produced by the ADP Research Institute, which uses anonymized payroll data from about 26 million workers to estimate private-sector employment changes ahead of the official government Non-Farm Payrolls (NFP) report.
The decline reflects ongoing uncertainty among employers amid policy and economic challenges, including tariff impacts and consumer caution.
Market Implications:
The unexpected job losses may raise concerns about the health of the US labor market and the broader economy.
This data could increase expectations for Federal Reserve rate cuts or a more dovish stance, potentially weighing on the US dollar and boosting safe-haven assets like gold and silver.
However, the ADP report often diverges from the official NFP, so markets will closely watch the upcoming government jobs data for confirmation.
In summary:
June’s ADP report revealed a contraction of 33,000 private-sector jobs, far below expectations, signaling caution in US labor market hiring and adding uncertainty to the economic outlook ahead of the official payrolls release.
#gold #xauusd

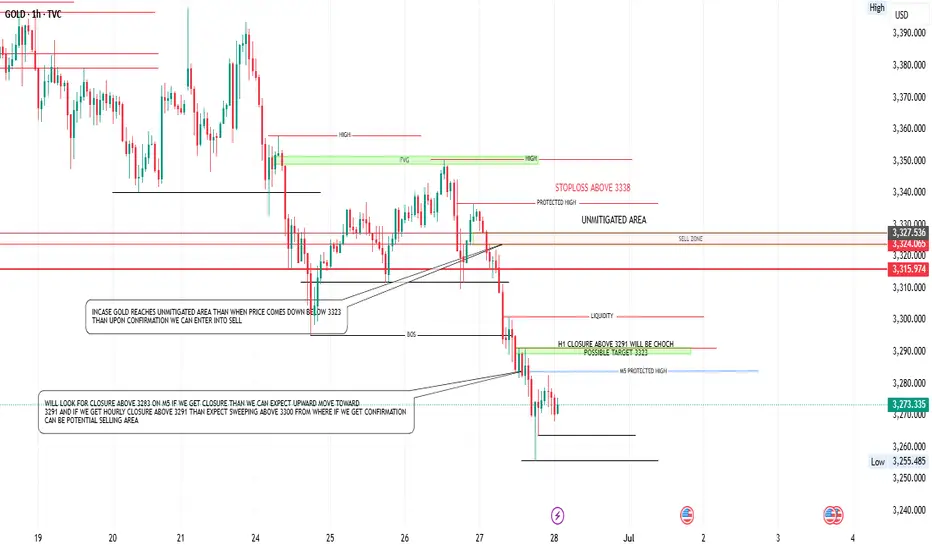
GOLD UPCOMING WEEK ANALYSIS/SET UP On the M5 timeframe, a confirmed candle closure above 3283 would signal a shift toward short-term bullish momentum. In this scenario, the market is likely to attract buyers looking to capitalize on upward continuation. A logical strategy would be to wait for a pullback toward the 3264 or 3278 zone all depending upon price action ie swing lows, It's important to maintain a tight stop loss just below the pullback low, as the expected targets in this bullish leg are first 3291, followed by the psychological level of 3300. These levels may offer minor resistance, and partial profit-taking around them could be considered.
If buying pressure remains strong and the price closes decisively above 3303, this would confirm a continuation of bullish intent. At that point, the market is likely to push toward the unmitigated supply zone marked on the chart. This zone has not been fully tested and may act as a key inflection point where institutional selling could re-enter the market. we should watch price behavior closely in this area, as signs of rejection—such as a bearish engulfing candle or a failure to hold above 3323—would suggest exhaustion of bullish momentum.
If the market fails to hold above 3323 and instead closes below it, this would shift the bias to bearish. Such a rejection would present a high-probability sell opportunity, with the expectation of a move back toward this week’s low. This bearish move would likely be driven by a combination of profit-taking and reactivation of supply from the unmitigated zone, aligning well with smart money principles targeting liquidity beneath recent lows.
Note: Only for educational purpose not a financial advice
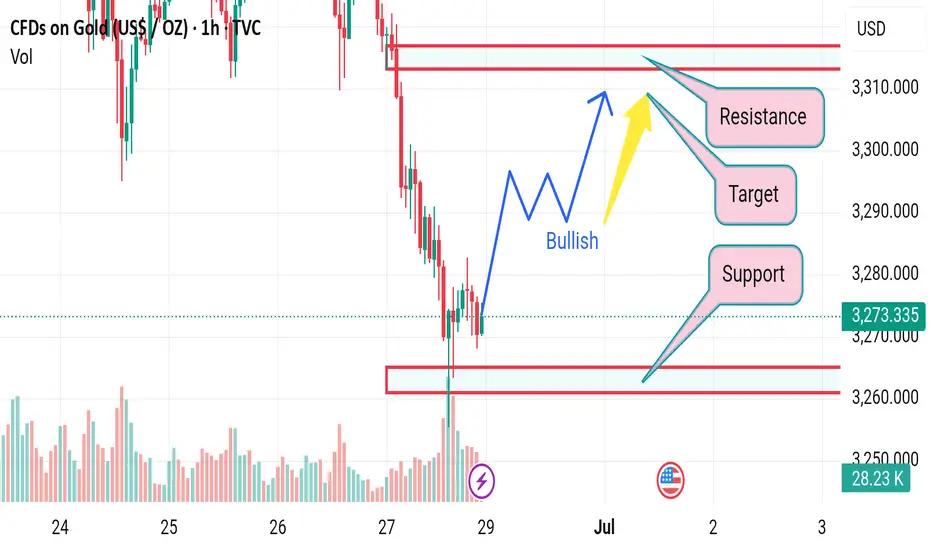
Market next target 🟥 Disrupted (Bearish or Cautious) Analysis:
1. Failed Bullish Attempt Risk
While a bounce from the support zone (~3,260 USD) is visible, the momentum lacks strong bullish confirmation. The rejection from the support area could be a dead-cat bounce, especially since the overall trend leading into this zone was sharply downward.
2. Volume Divergence
The volume spike on the large red candle suggests heavy selling pressure, not accumulation. The weak follow-up volume on the minor green recovery bars indicates a lack of buyer confidence.
3. False Breakout Possibility
If price does push toward the “Target” or even the “Resistance” zone (3,290–3,310), it might be a bull trap, luring late buyers in before a reversal back downward.
4. Bearish Continuation Scenario
Price may retest the support zone (3,260) again.
If this support breaks decisively, it could trigger a strong sell-off, with potential to test lower zones around 3,240 or even 3,200.
GOLD LONGToday's news only corrected the dollar, it did not create a new bottom. So we buy with capital management in mind.
First target 3357 at the time of the news.
Second target 3380
SL' 3302
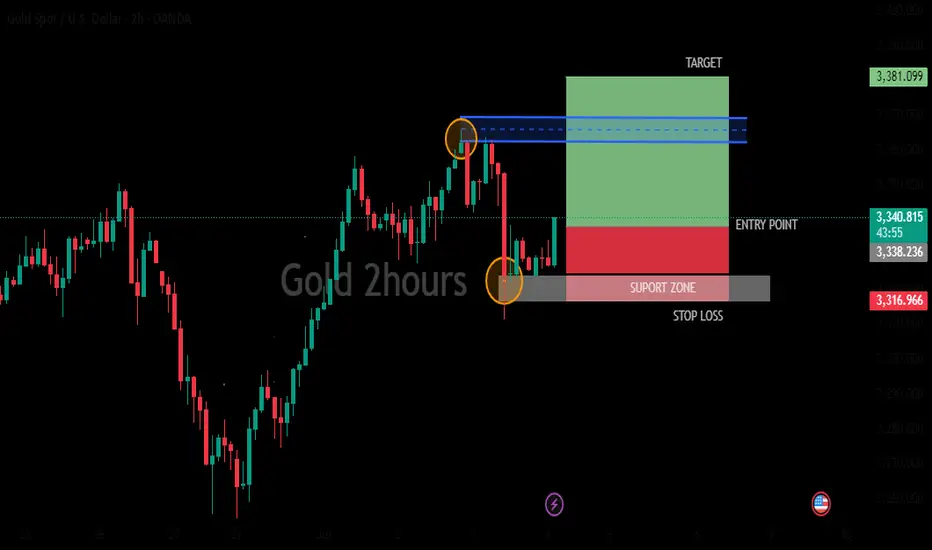
GOLD 2HOURS BULISH ANALYSISMarket may be going buy side and the presence of indicators and other tools suggests that the user is actively monitoring and analyzing the market.target price (green bar) stop loss (red bar) entry point (blue line)
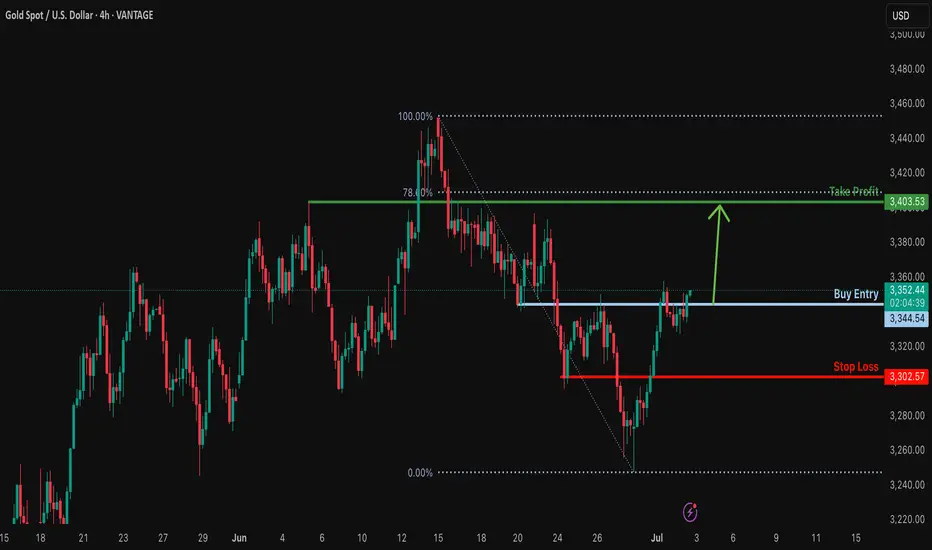
Bullish rise for the Gold?The price is reacting off the resistance level which is a pullback resistance and could potentially rise from this level to our take profit.
Entry: 3,344.54
Why we like it:
There is a pullback resistance level.
Stop loss: 3,302.57
Why we like it:
There is a pullback support level.
Take profit: 3,403.53
Why we like it:
There is a pullback resistance level that lines up with the 78.6% Fibonacci retracement.
Enjoying your TradingView experience? Review us!
Please be advised that the information presented on TradingView is provided to Vantage (‘Vantage Global Limited’, ‘we’) by a third-party provider (‘Everest Fortune Group’). Please be reminded that you are solely responsible for the trading decisions on your account. There is a very high degree of risk involved in trading. Any information and/or content is intended entirely for research, educational and informational purposes only and does not constitute investment or consultation advice or investment strategy. The information is not tailored to the investment needs of any specific person and therefore does not involve a consideration of any of the investment objectives, financial situation or needs of any viewer that may receive it. Kindly also note that past performance is not a reliable indicator of future results. Actual results may differ materially from those anticipated in forward-looking or past performance statements. We assume no liability as to the accuracy or completeness of any of the information and/or content provided herein and the Company cannot be held responsible for any omission, mistake nor for any loss or damage including without limitation to any loss of profit which may arise from reliance on any information supplied by Everest Fortune Group.
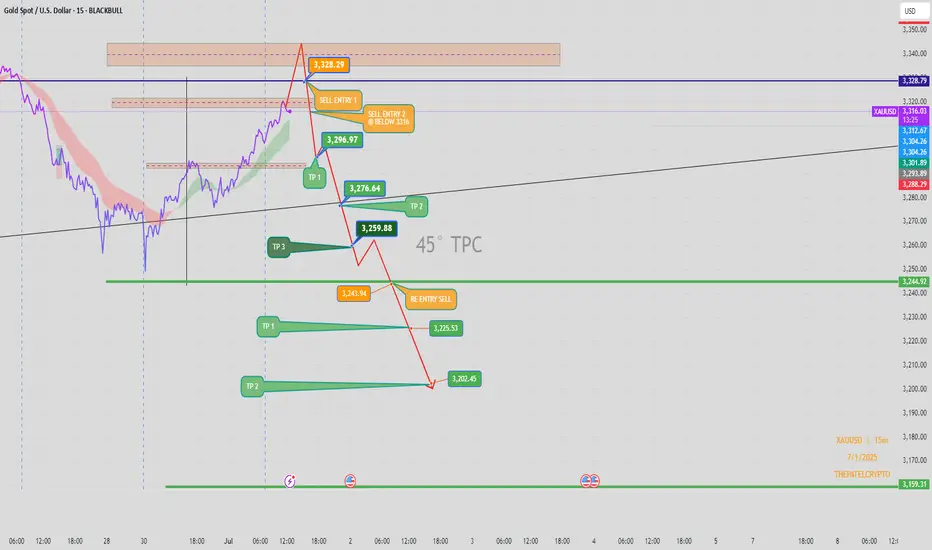
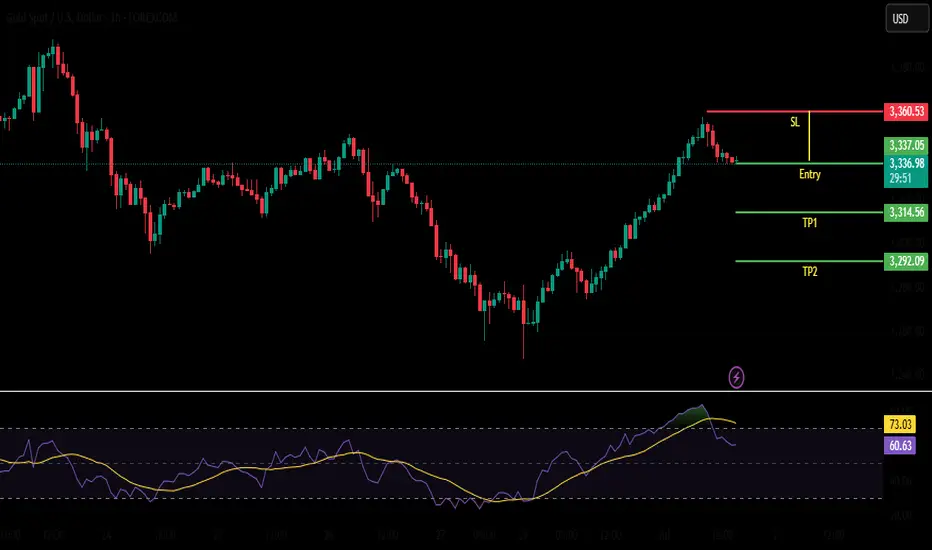
XAUUSD 15min – Bearish Setup | Short Trade Plan Below 3328Price action on Gold (XAUUSD) is showing signs of exhaustion near the 3,328 resistance zone, where we anticipate potential bearish rejection. A short opportunity may unfold once confirmation occurs below the key structural level of 3316.
Sell Trade Setup:
🔹 Primary Entry (Sell Entry 1):
📍 Zone: Around 3,328.29
📌 Reaction expected near major supply & resistance zone.
🔹 Confirmation Entry (Sell Entry 2):
📍 Below 3,316
📌 Break below structure may trigger bearish momentum.
Targets:
🎯 TP 1: 3,296.97 (Initial reaction zone)
🎯 TP 2: 3,276.64 (Mid support/EMA cross zone)
🎯 TP 3: 3,259.88 (Key structural support)
🎯 Extended TP:
3,243.94 (Re-entry confirmation level)
3,225.53 (Prior base structure)
3,202.45 (Final target if strong momentum follows)
3,159.31 (Ultimate low if sellers dominate trend)
Re-Entry Plan:
🔄 If price retraces after TP 3, watch for rejection at 3,243.94 to re-enter short toward the next levels.
Confluence Factors:
✔ 45° TPC angle supports bearish path
✔ Structure break expected below 3316
✔ EMA resistance and trendline rejection from upper zone
✔ Volatility cluster observed near 3,328 – ideal for trap setup
Bias:
Bearish below 3,316 – Expecting a downward continuation if structure confirms breakdown.
Author:
📅 1 July 2025
📊 Chart: XAUUSD – 15min
🧠 Shared by: @THEPATELCRYPTO
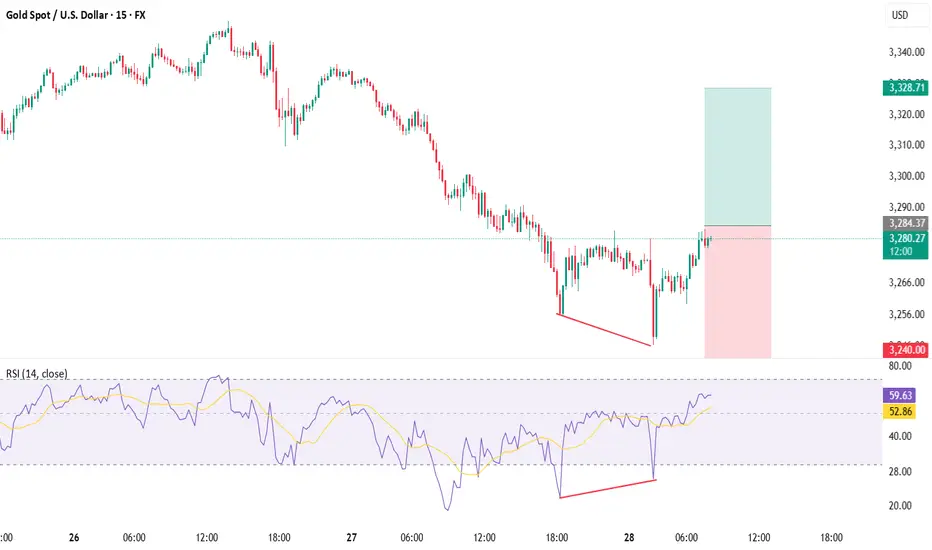
XAUUSD📉 The Setup: Bullish Divergence on XAUUSD (15m/30m)
Buy only on Breakout
🔍 Observation:
On the 30-minute timeframe, price made a lower low while the RSI indicator printed a higher low — classic sign of bullish divergence 🔄.
💡 Translation: Bears are losing steam! Bulls may be preparing to charge in! 🐂⚡
📊 Trade Plan – Long Entry
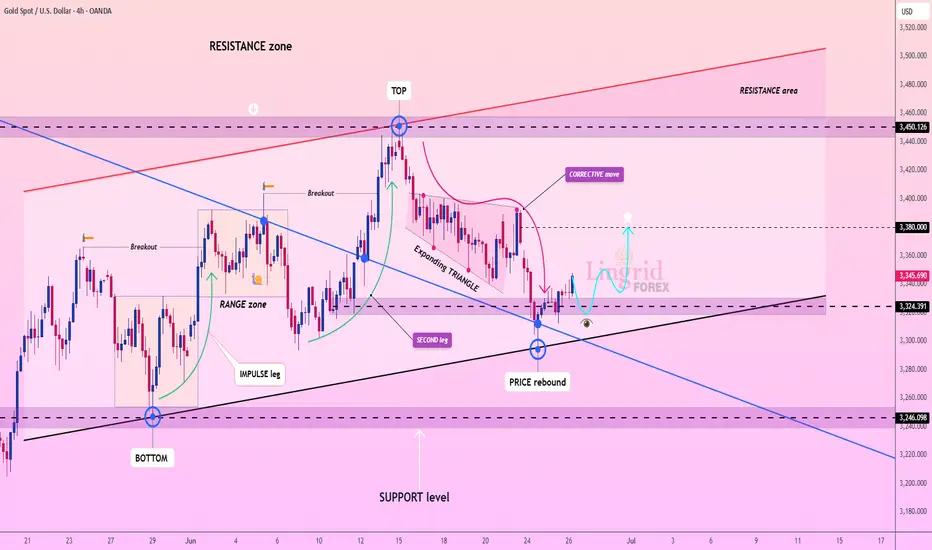
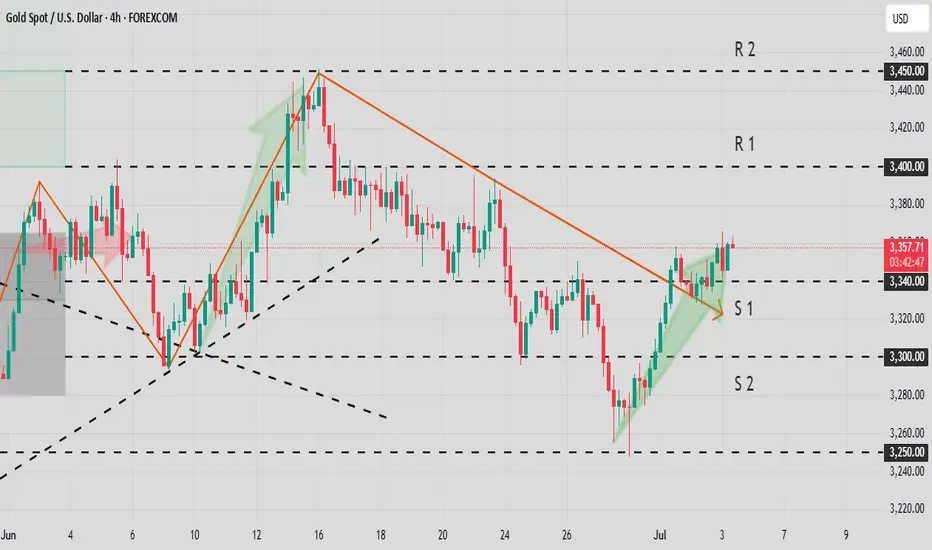
Lingrid | GOLD Potential Bullish Reversal TradeOANDA:XAUUSD is rebounding from key structure support after forming a double-leg corrective move inside an expanding triangle. Price has reclaimed the 3,324 zone, aligning with the trendline and support confluence, suggesting a short-term bullish bias. If this rebound sustains, gold could retest the 3,380 barrier before eyeing the 3,450 resistance ceiling. A rejection from mid-levels would reintroduce downside pressure toward the 3,246 zone.
📈 Key Levels
Buy zone: 3,320–3,330
Sell trigger: break below 3,324
Target: 3,450
Buy trigger: strong candle close above 3,380
💡 Risks
Weak volume could stall upside continuation
Failure to hold the trendline may drag price toward 3,246
Broader resistance zone between 3,380–3,450 could limit upside momentum
If this idea resonates with you or you have your own opinion, traders, hit the comments. I’m excited to read your thoughts!

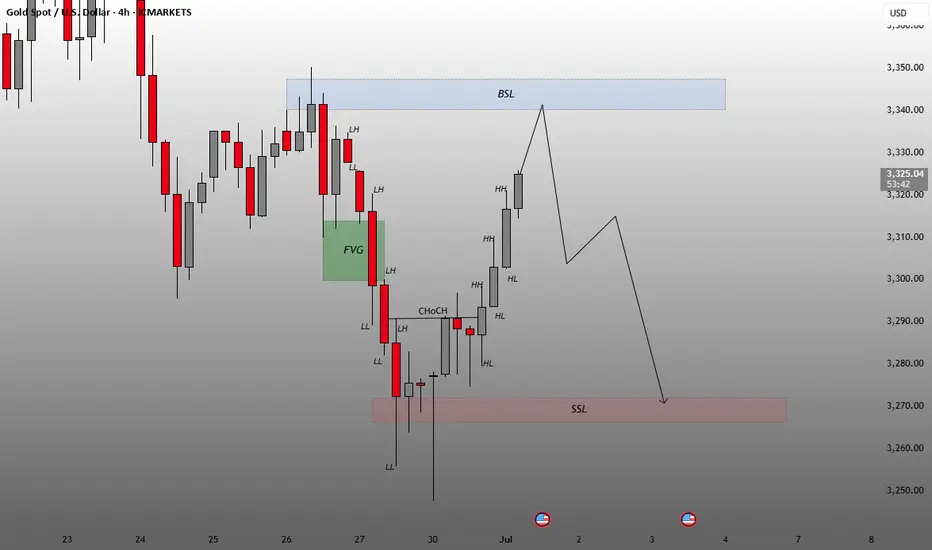
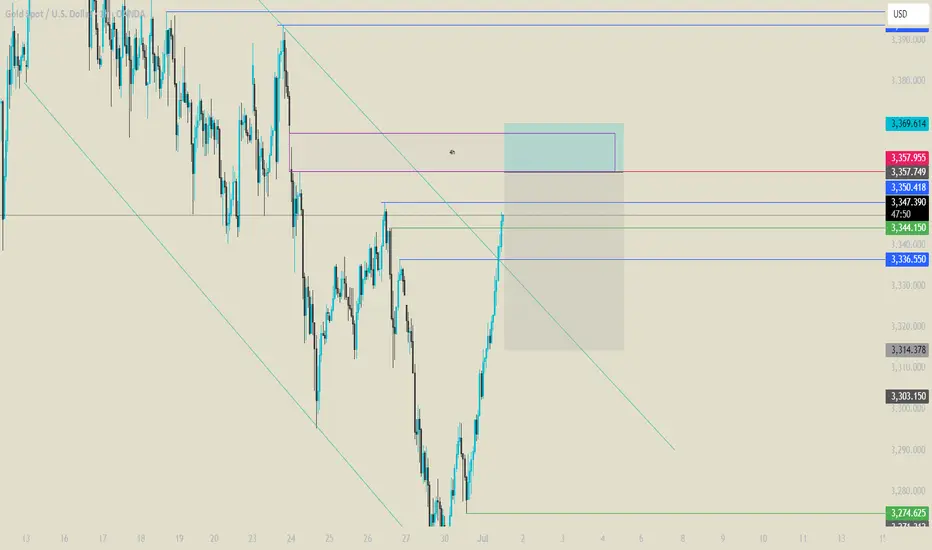
Smart Money Concepts or Inner Circle Trade methodologies.Key Zones and Annotations
FVG (Fair Value Gap) – Marked in green:
Represents an imbalance in price (gap between candles).
Price often returns here to “fill” or mitigate that inefficiency.
BSL (Buy-Side Liquidity) – Marked in blue near the $3,340 area:
Indicates an area above recent highs where stop-losses (liquidity) might be resting.
This area is often targeted before reversals.
SSL (Sell-Side Liquidity) – Marked in red near the $3,270 area:
Represents liquidity below recent lows.
This is a potential bearish target.
Structure Labels
LL (Lower Low), LH (Lower High), HH (Higher High), HL (Higher Low):
Used to track market structure direction (bearish/bullish trend).
ChoCH (Change of Character):
Indicates a shift in market structure, typically a sign of a trend reversal.
Price Projection
The projected path shows a short-term move upward toward the BSL region (~$3,340), suggesting liquidity grab or premium pricing area.
Then, a bearish reversal is projected targeting the SSL zone (~$3,270), suggesting a potential drop after the BSL is taken.
Conclusion
The chart suggests a short-term bullish move to clear buy-side liquidity followed by a bearish continuation targeting lower liquidity zones. This type of analysis is commonly used in Smart Money Concepts (SMC) or ICT (Inner Circle Trader) methodologies.
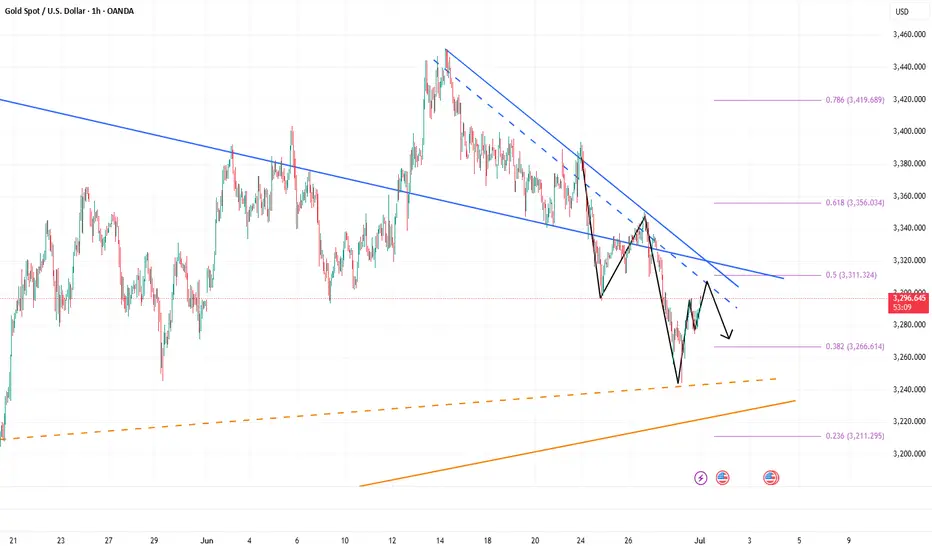
90-day tariffs expire, how to position gold next week📰 News information:
1. 90-day tariffs are about to expire
📈 Technical Analysis:
With the Trump administration's massive tax cut and spending bill officially implemented, the U.S. Treasury may start a "supply flood" of short-term Treasury bonds to make up for the trillions of dollars in fiscal deficits in the future. Concerns about the oversupply of short-term Treasury bonds have been directly reflected in prices. The yield of 1-month short-term Treasury bonds has risen significantly since Monday this week. Slowing wage growth, falling total work hours, stagnant wage income growth and concerns about consumer spending are all signs that support gold.
From a technical perspective, Friday's closing long shadow small candle body, the price closed at a high of 3345 and a low of 3224. The overall idea for next week is to follow the trend and rely on the first short-term support of 3323 below to participate in long positions. Secondly, 3315-3305 is given below. If the support point is lost, then 3300 below is also in danger, and there is no need to overly insist on continuing to do more at low levels in the short-term rhythm. The key pressure above is 3340-3350, and the limit is the pressure of 3360 above.
🎯 Trading Points:
BUY 3325-3323
TP 3333-3340-3350
BUY 3315-3305
TP 3325-3333-3340
In addition to investment, life also includes poetry, distant places, and Allen. Facing the market is actually facing yourself, correcting your shortcomings, confronting your mistakes, and strictly disciplining yourself. I hope my analysis can help you🌐.
FXOPEN:XAUUSD PEPPERSTONE:XAUUSD FOREXCOM:XAUUSD FX:XAUUSD OANDA:XAUUSD TVC:GOLD
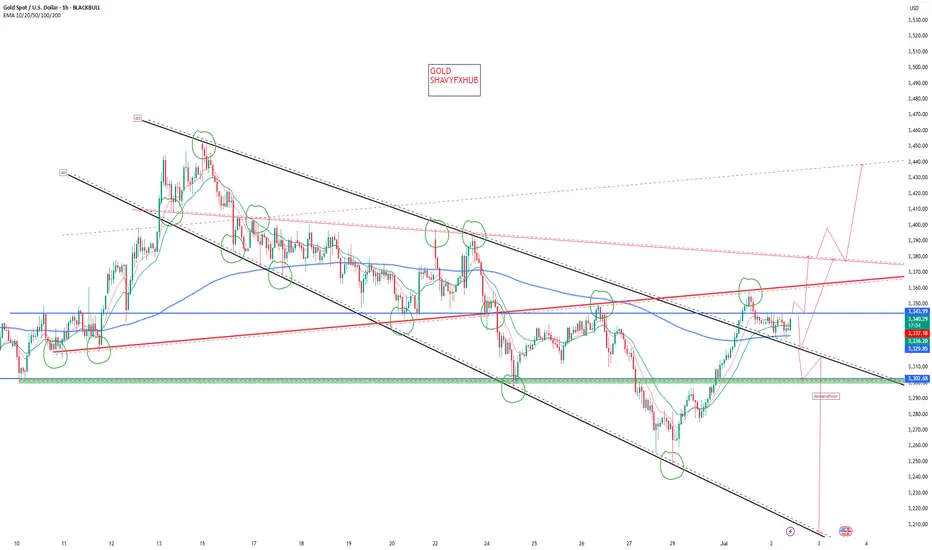
My Weekly Review and Some tierlist for the zones I madeHello guys. its end of the week and I wanna share you my journey since monday until today. I also tell you the real reason why I don't believe the bottom is in yet and holding my swing sell. Thank you for watching.

GOLD The ADP Non-Farm Employment Change for July 2,have a forecast of 99,000 jobs, compared to the previous month’s very weak result of 37,000—the lowest since March 2023. The ADP National Employment Report is a monthly indicator that tracks changes in non-farm private sector employment in the US, based on anonymized payroll data from ADP’s clients, covering about one-fifth of all US private employment.
Who is responsible?
The report is produced by the ADP Research Institute, part of Automatic Data Processing (ADP), in partnership with the Stanford Digital Economy Lab.
Why it matters:
The ADP report is viewed as a leading indicator for the official Non-Farm Payrolls (NFP) report from the Bureau of Labor Statistics (BLS), released two days later.
It provides early insight into US private sector job growth and labor market health, and significant deviations from forecasts can move financial markets.
Note that the ADP report covers only private sector jobs, not government employment, so its numbers can differ from the official NFP.
Summary Table:
Report Date Forecast Previous Responsible Department
July 2, 2025 99,000 37,000 ADP Research Institute (ADP)
In summary:
The ADP Non-Farm Employment Change report, produced by the ADP Research Institute, forecasted a rebound to 99,000 jobs in June after a very weak 37,000 in May, providing an early signal on the health of US private sector employment.
(2)US10Y drops to historical low to 4.193% and currently broken 1hr descending trendline at 4.281% ,4.3% resistance will be watched for breakout buy bond buyers.
(3) DXY Key Points:
The DXY measures the US dollar’s strength against a basket of six major currencies: the euro (57.6% weight), Japanese yen (13.6%), British pound (11.9%), Canadian dollar (9.1%), Swedish krona (4.2%), and Swiss franc (3.6%).
After peaking near 110.075$ in January 2025, the index has softened , trading near 96.600-101.966.on weekly TF 101.966 was a retest to broken weekly demand floor .
The dollar’s decline reflects market expectations of Federal Reserve rate cuts later in 2025, easing inflation pressures, and some geopolitical easing.
the DXY to rebound will henge and depend on Fed policy and global economic conditions.
GOLD buyers are watching for the direction of trade ,
Chinese Demand and Policy:
China is one of the largest gold consumers and holders. Domestic demand, central bank gold purchases, and monetary policy in China heavily influence XAU/RMB. If China’s economy slows or trade tensions with the US worsen, demand for gold as a safe haven may increase, supporting XAU/RMB even if the dollar is strong.
China's recent opening of the Shanghai Gold Exchange's (SGE) first offshore gold vault in Hong Kong on June 26, 2025, represents a significant development with potential, albeit indirect, implications for XAU/USD (gold priced in US dollars) .
Key Aspects of the Hong Kong Gold Vault:
Location and Operation: The vault is located in Hong Kong and operated by Bank of China's Hong Kong unit .
Yuan-Denominated Trading: All transactions and settlements in the vault are denominated exclusively in yuan, either via cash or physical bullion delivery . Two new yuan-denominated gold trading contracts were launched alongside the vault .
Strategic Objectives:
Increased Influence on Gold Pricing: China, as the world's leading gold producer and consumer, aims to gain greater control and influence over global gold pricing mechanisms .
Yuan Internationalization: The initiative seeks to accelerate the international usage of the yuan, supporting China's broader de-dollarization efforts . This allows China to import gold in yuan, reducing reliance on the US dollar for commodity trading .
Enhanced Global Reach: The vault expands the SGE's physical infrastructure beyond mainland China, creating a new gateway for international gold trading and solidifying Hong Kong's role as a key financial hub .
Physical Settlement: It facilitates the physical settlement of gold contracts outside mainland China .
Implications for XAU/USD:
While the new vault directly promotes yuan-denominated gold trading, its implications for XAU/USD are primarily indirect and long-term:
De-dollarization Efforts: By promoting yuan-denominated gold trading, China is actively working to reduce global reliance on the US dollar in commodity markets . If successful, a more diversified global gold trading landscape could gradually diminish the dollar's sole influence over gold prices, potentially leading to less direct inverse correlation between the dollar and gold .
Increased Demand and Liquidity: The vault aims to attract more international participants to yuan-denominated gold markets, potentially increasing overall gold demand and liquidity in the Asia-Pacific region . While this demand is primarily yuan-driven, a generally stronger global gold market could indirectly support XAU/USD .
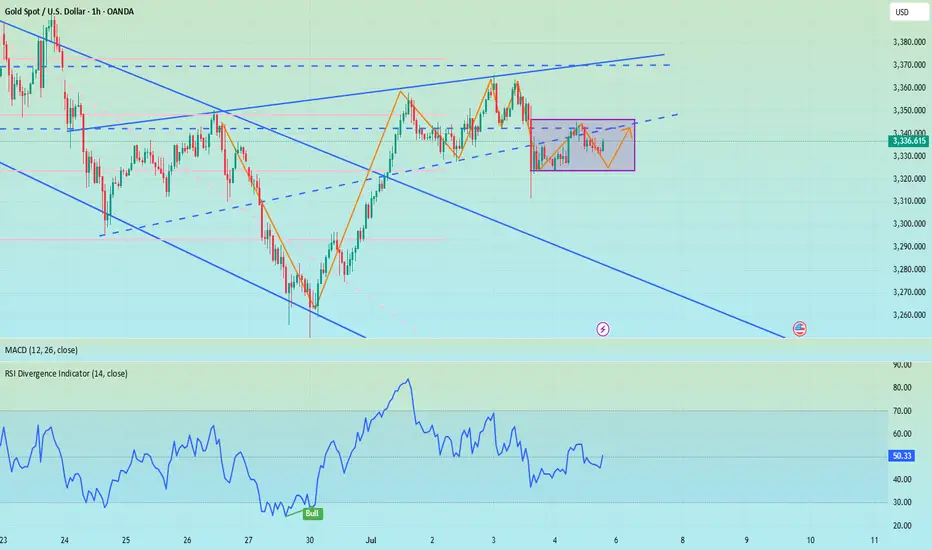
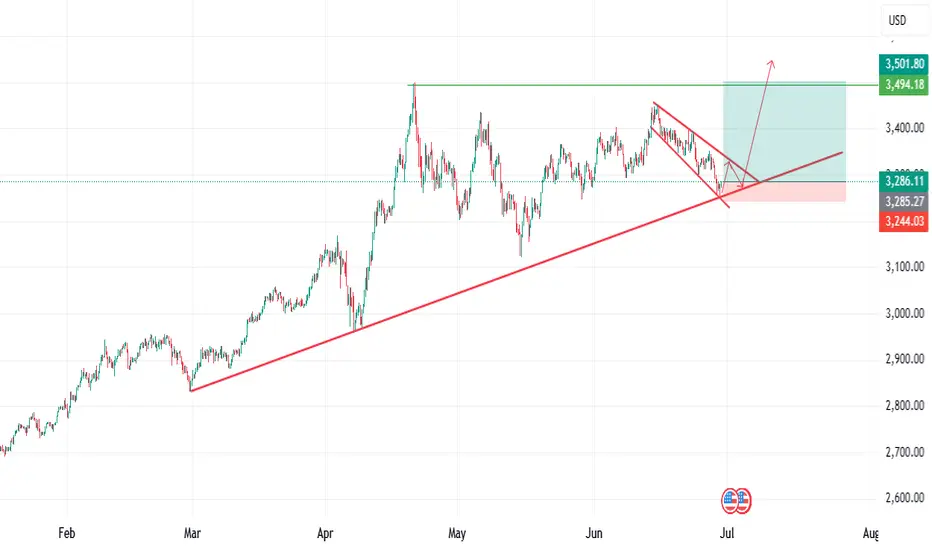
XAUUSD is about to be bullishfrom the chart, you will understand that xauusd is about to be bullish.
Reasons;
1] Third trendline touch, which is signal for reversal
2] Falling wedge pattern
Caution; Wait for the falling wedge break out for your entry. Wait patently and trade responsibly.
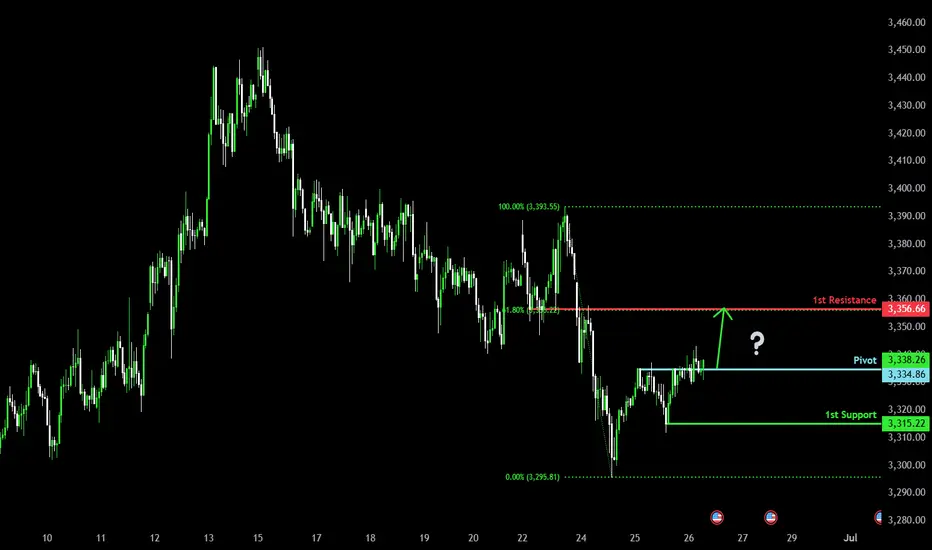
Potential bullish rise?The Gold (XAU/USD) is reacting off the pivot and could rise to the 1st resistance.
Pivot: 3,334.86
1st Support: 3,315.22
1st Resistance: 3,356.66
Risk Warning:
Trading Forex and CFDs carries a high level of risk to your capital and you should only trade with money you can afford to lose. Trading Forex and CFDs may not be suitable for all investors, so please ensure that you fully understand the risks involved and seek independent advice if necessary.
Disclaimer:
The above opinions given constitute general market commentary, and do not constitute the opinion or advice of IC Markets or any form of personal or investment advice.
Any opinions, news, research, analyses, prices, other information, or links to third-party sites contained on this website are provided on an "as-is" basis, are intended only to be informative, is not an advice nor a recommendation, nor research, or a record of our trading prices, or an offer of, or solicitation for a transaction in any financial instrument and thus should not be treated as such. The information provided does not involve any specific investment objectives, financial situation and needs of any specific person who may receive it. Please be aware, that past performance is not a reliable indicator of future performance and/or results. Past Performance or Forward-looking scenarios based upon the reasonable beliefs of the third-party provider are not a guarantee of future performance. Actual results may differ materially from those anticipated in forward-looking or past performance statements. IC Markets makes no representation or warranty and assumes no liability as to the accuracy or completeness of the information provided, nor any loss arising from any investment based on a recommendation, forecast or any information supplied by any third-party.
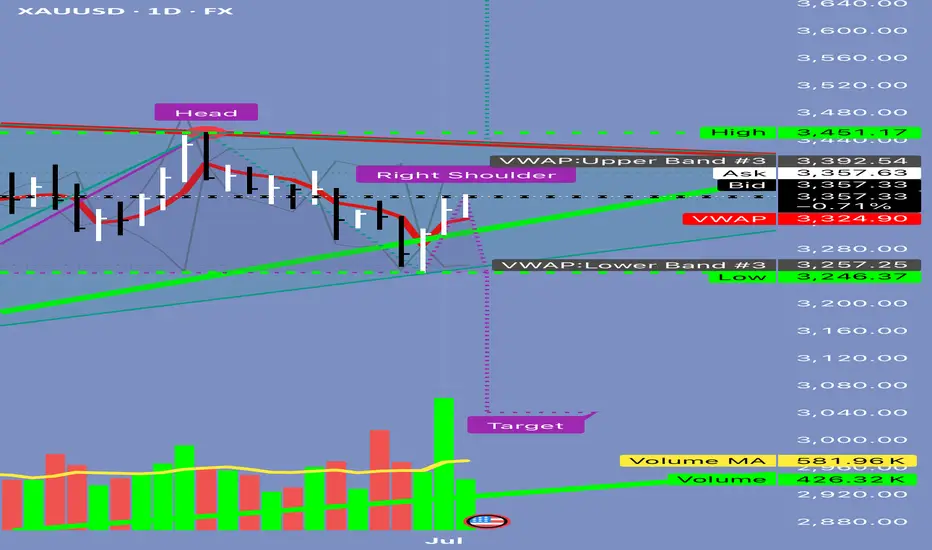
Gold at Key Level Before NFP – Big Move Loading ?📉 Fundamental Analysis
Gold remains in a strong bullish structure, supported by multiple macroeconomic and political drivers:
ADP Employment Report Missed Expectations: With a shocking -33K reading, market sentiment shifted firmly against the US Dollar, pushing gold higher.
Fed’s Easing Outlook: Markets are now pricing in a 90% probability of a rate cut in Q3, weakening real yields and supporting demand for gold.
Trump’s “Super Bill” Momentum: Political cohesion among Republicans has re-ignited fiscal stimulus expectations, fuelling concerns over long-term US debt sustainability—another tailwind for gold as a safe haven.
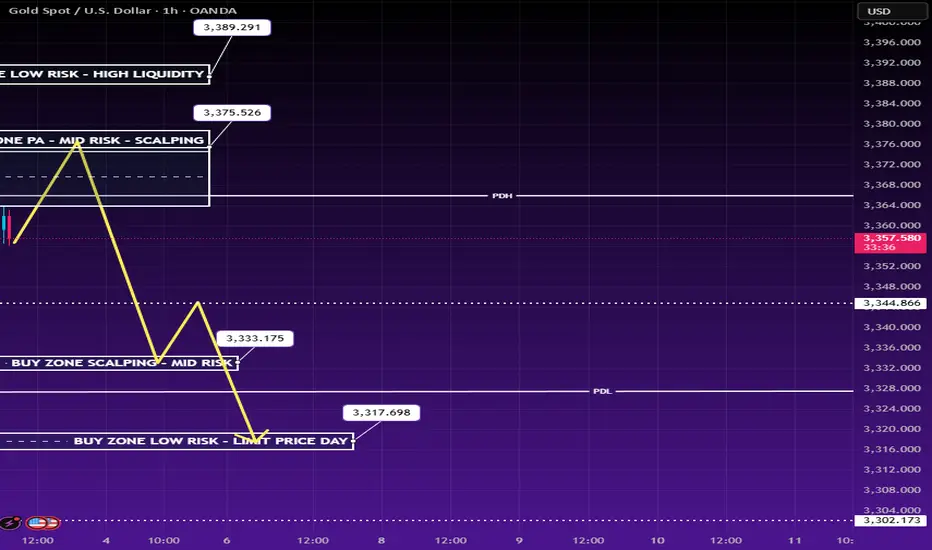
🧠 Smart Money Technical Framework (H1)
Price has moved into a Premium FVG Zone, showing signs of potential exhaustion after forming a clear CHoCH and bullish BOS. The current zone (3,375 – 3,376) aligns with a mid-risk sell region, where price may experience short-term rejection before revisiting demand zones.
Market structure suggests liquidity sweep potential towards the downside before any continuation of the larger bullish trend.
📊 Trading Strategy – Smart Money Zones & Key Levels
🔵 BUY SCALP: 3,334 – 3,333
🔴 SL: 3,329
✅ TP: 3,340 → 3,344 → 3,350 → 3,360
🔵 BUY ZONE LOW RISK: 3,317 – 3,316
🔴 SL: 3,311
✅ TP: 3,320 → 3,325 → 3,330 → 3,336 → 3,345 → 3,350 → 3,360
🔴 SELL SCALP ZONE: 3,375 – 3,376
🔴 SL: 3,380
✔️ TP: 3,370 → 3,366 → 3,360 → 3,355 → 3,350
🔴 SELL ZONE HIGH PROBABILITY: 3,388 – 3,390
🔴 SL: 3,394
✔️ TP: 3,384 → 3,380 → 3,376 → 3,370 → 3,366 → 3,360
📌 Notes:
Be cautious ahead of NFP data and the upcoming US bank holiday—expect liquidity traps and sudden volatility.
This setup is ideal for intraweek scalping and liquidity-based reversals.
All trades follow Smart Money Concepts logic: premium vs. discount zones, CHoCH + BOS confirmations, and institutional order flow anticipation.
XAUUSD Today's strategyGold prices are consolidating around $3,350 today, with the current resistance level above seen at $3,370 and the support level below at $3,340.
From a technical perspective, the 4-hour chart shows an ascending triangle pattern, with the bottom gradually lifting. If the price can effectively break through the $3,370 resistance, it is expected to subsequently launch an assault on the $3,400 integer mark. In terms of technical indicators, the RSI currently stands at 58, which has not yet entered the severely overbought range, suggesting there is still room for upward movement; the MACD indicator also shows that bullish momentum is slowly recovering, waiting for a breakout signal to confirm the direction.
On the operational front, considering going long around $3,340 could be a viable option. It is particularly important to note that the U.S. non-farm payroll data will be released today, which may have a significant impact on the short-term trend of gold. It is advisable to liquidate positions and wait on the sidelines before the data release to avoid potential risks from sharp fluctuations.
XAUUSD
buy@3335-3345
tp:3360-3370
I am committed to sharing trading signals every day. Among them, real-time signals will be flexibly pushed according to market dynamics. All the signals sent out last week accurately matched the market trends, helping numerous traders achieve substantial profits. Regardless of your previous investment performance, I believe that with the support of my professional strategies and timely signals, I will surely be able to assist you in breaking through investment bottlenecks and achieving new breakthroughs in the trading field.
XAUUSD | BearishGold seems to be entering into a bearish trend after testing its resistance area.It is going to print new LHs and LLs.
Gold short from 3357Aiming for that gap . i think today gold will close it and reversal on the ny session is coming.
Short gold, it will fall again when encountering resistanceIn the short term, gold retreated to around 3274 and then rebounded again, and it is only one step away from 3300. Will gold regain its bullish trend again?
I think it is difficult for gold to break through in the short term. Although gold retreated to around 3274 and successfully built a double bottom structure with the second low point and the low point of 3245, it only increased the rebound space; it is not enough for gold to regain its bullish trend. Since gold fell and broke through, the confidence of bulls has been hit hard. The previous support at the technical level has formed a strong resistance area after the top and bottom conversion, and to a certain extent helped the short force. In the short term, gold faces resistance in the 3310-3320 area. Before gold breaks through this area, the short energy still has the upper hand.
Therefore, shorting gold is still the first choice for short-term trading.
It is appropriate to consider shorting gold in batches in the 3300-3320 area, and look at the target: 3385-3375-3365
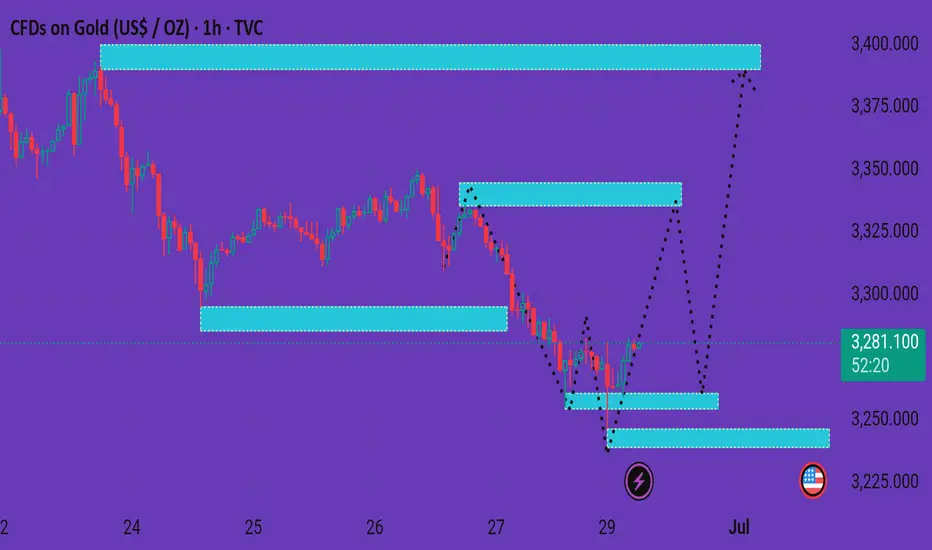
Xauusd market The chart you've shared is a 1-hour timeframe for Gold (CFDs on Gold, US$ / OZ) and seems to illustrate a potential bullish reversal scenario. Here's a detailed breakdown:
---
🔍 Chart Overview
Current Price: 3,280.920
Recent Movement: Price has been in a downtrend but recently formed a potential bottom with some sideways consolidation.
---
🟦 Highlighted Zones
1. Support Zone (Bottom - ~3,240)
Marked with a U.S. flag emoji (likely news-related support).
Price previously bounced from this zone — a key area of demand.
2. Mid-Level Supply/Resistance Zone (~3,300–3,320)
Price may test this zone if bullish momentum continues.
A key intraday resistance to watch.
3. Upper Supply Zone (~3,360–3,400)
If price breaks the mid-level zone, this is the next potential target.
Final bullish target area.
---
📈 Projected Paths (Dashed Lines)
Primary Scenario:
Bounce from current level → retest mid-resistance (~3,320) → possible breakout → target upper zone (~3,400).
Alternative Scenario:
Slight retracement back to the lower support (~3,260–3,245) before rallying to higher zones.
---
🔄 Interpretation
Bullish Bias: The chart is structured for a bullish reversal.
Confirmation Needed: A break and hold above the mid-resistance (~3,320) would validate the bullish path.
Risk Zone: If price falls below the bottom support (~3,240), the bullish setup may be invalidated.
---
Would you like a trading plan or entry/exit suggestion based on this setup?