XAUUSD Today's strategyGold prices are consolidating around $3,350 today, with the current resistance level above seen at $3,370 and the support level below at $3,340.
From a technical perspective, the 4-hour chart shows an ascending triangle pattern, with the bottom gradually lifting. If the price can effectively break through the $3,370 resistance, it is expected to subsequently launch an assault on the $3,400 integer mark. In terms of technical indicators, the RSI currently stands at 58, which has not yet entered the severely overbought range, suggesting there is still room for upward movement; the MACD indicator also shows that bullish momentum is slowly recovering, waiting for a breakout signal to confirm the direction.
On the operational front, considering going long around $3,340 could be a viable option. It is particularly important to note that the U.S. non-farm payroll data will be released today, which may have a significant impact on the short-term trend of gold. It is advisable to liquidate positions and wait on the sidelines before the data release to avoid potential risks from sharp fluctuations.
XAUUSD
buy@3335-3345
tp:3360-3370
I am committed to sharing trading signals every day. Among them, real-time signals will be flexibly pushed according to market dynamics. All the signals sent out last week accurately matched the market trends, helping numerous traders achieve substantial profits. Regardless of your previous investment performance, I believe that with the support of my professional strategies and timely signals, I will surely be able to assist you in breaking through investment bottlenecks and achieving new breakthroughs in the trading field.
XAUUSDK trade ideas
XAUUSD | BearishGold seems to be entering into a bearish trend after testing its resistance area.It is going to print new LHs and LLs.
Gold short from 3357Aiming for that gap . i think today gold will close it and reversal on the ny session is coming.
Short gold, it will fall again when encountering resistanceIn the short term, gold retreated to around 3274 and then rebounded again, and it is only one step away from 3300. Will gold regain its bullish trend again?
I think it is difficult for gold to break through in the short term. Although gold retreated to around 3274 and successfully built a double bottom structure with the second low point and the low point of 3245, it only increased the rebound space; it is not enough for gold to regain its bullish trend. Since gold fell and broke through, the confidence of bulls has been hit hard. The previous support at the technical level has formed a strong resistance area after the top and bottom conversion, and to a certain extent helped the short force. In the short term, gold faces resistance in the 3310-3320 area. Before gold breaks through this area, the short energy still has the upper hand.
Therefore, shorting gold is still the first choice for short-term trading.
It is appropriate to consider shorting gold in batches in the 3300-3320 area, and look at the target: 3385-3375-3365
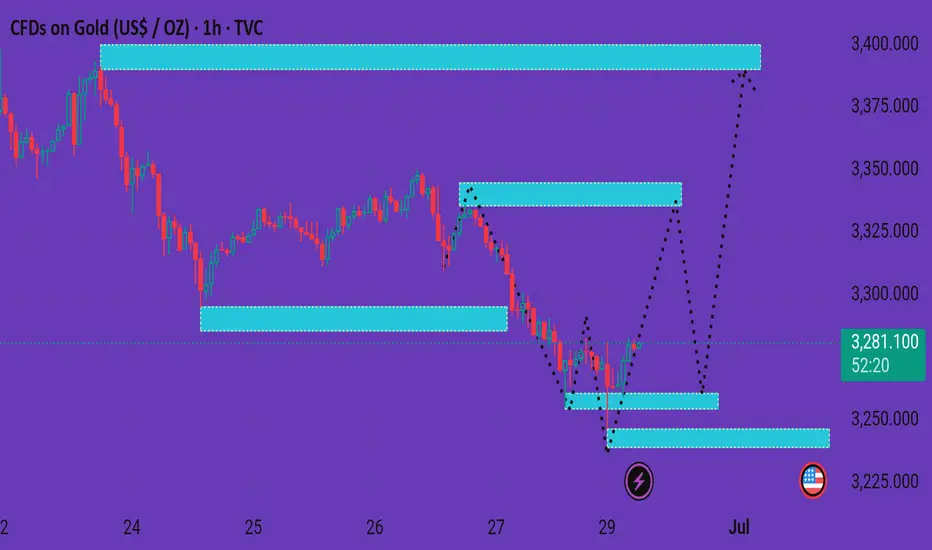
Xauusd market The chart you've shared is a 1-hour timeframe for Gold (CFDs on Gold, US$ / OZ) and seems to illustrate a potential bullish reversal scenario. Here's a detailed breakdown:
---
🔍 Chart Overview
Current Price: 3,280.920
Recent Movement: Price has been in a downtrend but recently formed a potential bottom with some sideways consolidation.
---
🟦 Highlighted Zones
1. Support Zone (Bottom - ~3,240)
Marked with a U.S. flag emoji (likely news-related support).
Price previously bounced from this zone — a key area of demand.
2. Mid-Level Supply/Resistance Zone (~3,300–3,320)
Price may test this zone if bullish momentum continues.
A key intraday resistance to watch.
3. Upper Supply Zone (~3,360–3,400)
If price breaks the mid-level zone, this is the next potential target.
Final bullish target area.
---
📈 Projected Paths (Dashed Lines)
Primary Scenario:
Bounce from current level → retest mid-resistance (~3,320) → possible breakout → target upper zone (~3,400).
Alternative Scenario:
Slight retracement back to the lower support (~3,260–3,245) before rallying to higher zones.
---
🔄 Interpretation
Bullish Bias: The chart is structured for a bullish reversal.
Confirmation Needed: A break and hold above the mid-resistance (~3,320) would validate the bullish path.
Risk Zone: If price falls below the bottom support (~3,240), the bullish setup may be invalidated.
---
Would you like a trading plan or entry/exit suggestion based on this setup?
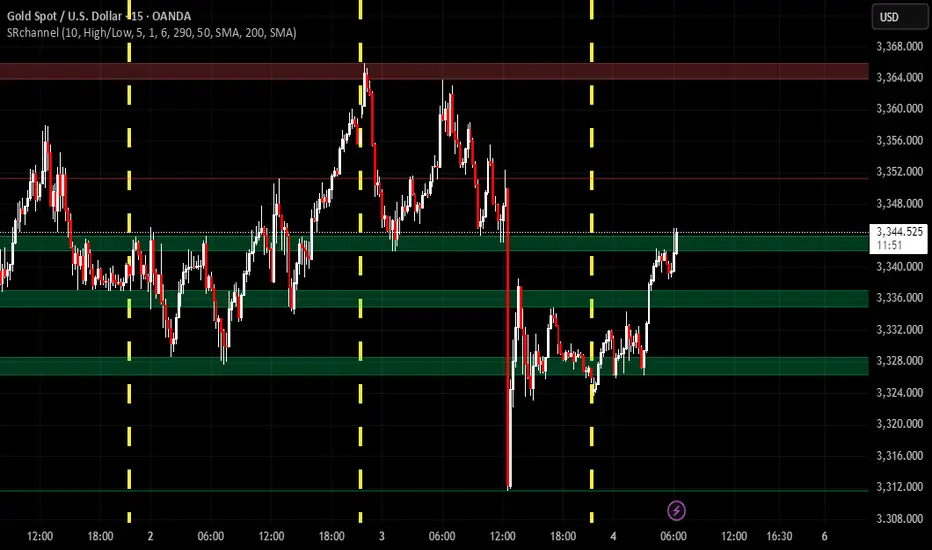
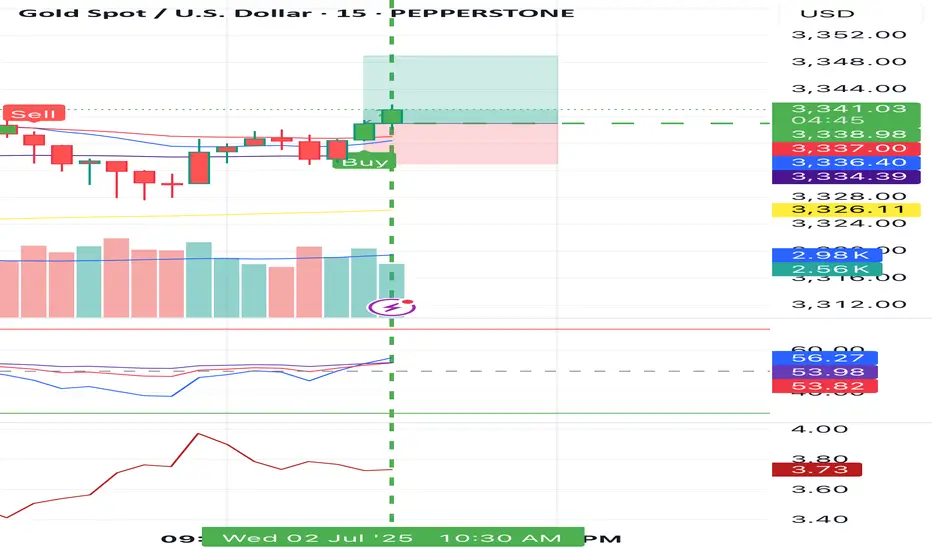
Gold Market Analysis Current Price: 3341.58
Market Behavior:
The price is ranging sideways, trading in a tight consolidation zone just below the resistance zone (around 3344).
Key Resistance Levels:
3344 → Immediate resistance
3348 – 3352 → Next minor supply zone
3357 – 3360 → Strong resistance ahead (if breakout occurs)
Key Support Levels:
3332 – 3330 → Short-term demand
3324 – 3320 → Stronger support zone
📌 Trader Insight:
"Gold is in a consolidation phase between 3330 and 3344. Wait for a confirmed breakout above 3344 for bullish momentum toward 3357+. If rejected again, expect a retest of support near 3332 or deeper."
✅ Trade Setup (Example):
Buy Scenario (Breakout):
Entry: Above 3345
Target: 3357
Stop Loss: Below 3338
Sell Scenario (Rejection):
Entry: Near 3344 resistance, if rejected
Target: 3332 / 3324
Stop Loss: Above 3348
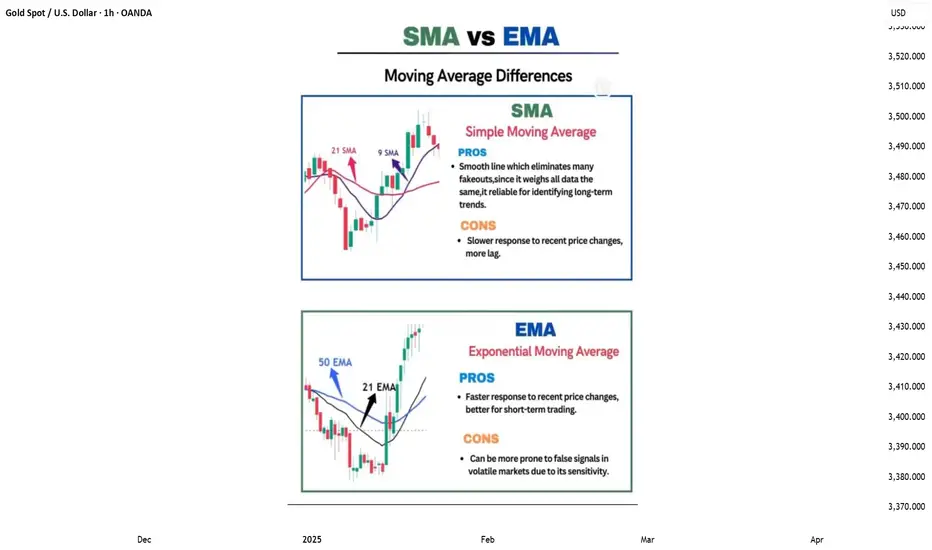
TRADING KNOWLEDGE – MOVING AVERAGE (MA)The Moving Average (MA) is a popular technical indicator that helps smooth out price data to better identify market trends. MA doesn't predict the future but helps traders clearly see the current direction of the market.
🔍 2 Main Types of MA:
🔔 SMA (Simple Moving Average): The average of closing prices over a set period (e.g., SMA 20 = average of the last 20 candles).
🔔 EMA (Exponential Moving Average): Similar to SMA but gives more weight to recent prices, making it more responsive to market changes.
📈 What is MA used for?
📍Trend Identification:
💡Upward sloping MA → Uptrend
💡Downward sloping MA → Downtrend
📍Trading Signals:
💡Price crossing above MA → Buy signal
💡Price crossing below MA → Sell signal
📍Combining Two MAs (Short & Long Term):
💡Short MA crosses above long MA → Buy signal (Golden Cross)
💡Short MA crosses below long MA → Sell signal (Death Cross)
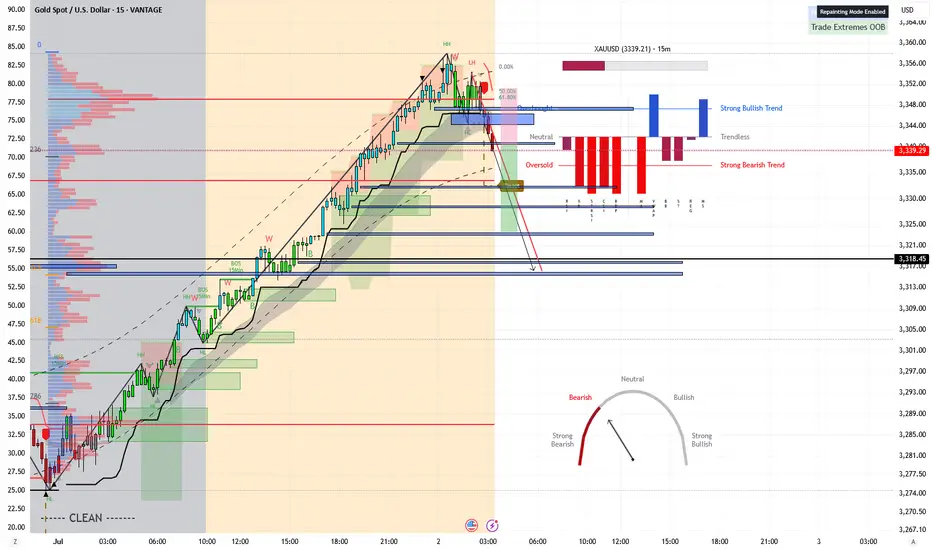
Pre NFP AnalysisSo from the previous video, I profited from the buy and with some losses on my sells. Today I update my thoughts going on forward. Thank you for watching.

Gold Sell- look for sell
- Refine entry with smaller SL for better RR, if you know how
- keep looking for sell even if price goes one more up
A Message To Traders:
I’ll be sharing high-quality trade setups for a period time. No bullshit, no fluff, no complicated nonsense — just real, actionable forecast the algorithm is executing. If you’re struggling with trading and desperate for better results, follow my posts closely.
Check out my previously posted setups and forecasts — you’ll be amazed by the high accuracy of the results.
"I Found the Code. I Trust the Algo. Believe Me, That’s It."
XAUUSD - SELL After a reasonable big run up like this they will take profits
Looks like it's roiling over watching Super Trend and break of
Buffer Zone with Bearish Continuation Candle can easily Shoot back up if Wicks but should be plenty of room to make money on this one.
Hardest part is being patient
Selling seems to capitulate everyone wants to capture as much profit as possible or should I say Algo's
NY also current session so they have plenty of push and Greedy as can be !
USD has turned Strong for now also
Don't forget to protect profits when you deem fit should it run into profit trading Forex - Gold is very unpredictable their game is to take yr money deliberately - do the opposite just to snag yr hard earned cash.
Lets See : )
going longit swept that level expecting going long
and it should move so impulsively
CAPITALCOM:GOLD
GOLD XAUUSD potential 1-2 setup to downsideLooking at an potential 1-2 setup to the downside wave 3 of 5. adding to my previous gameplay
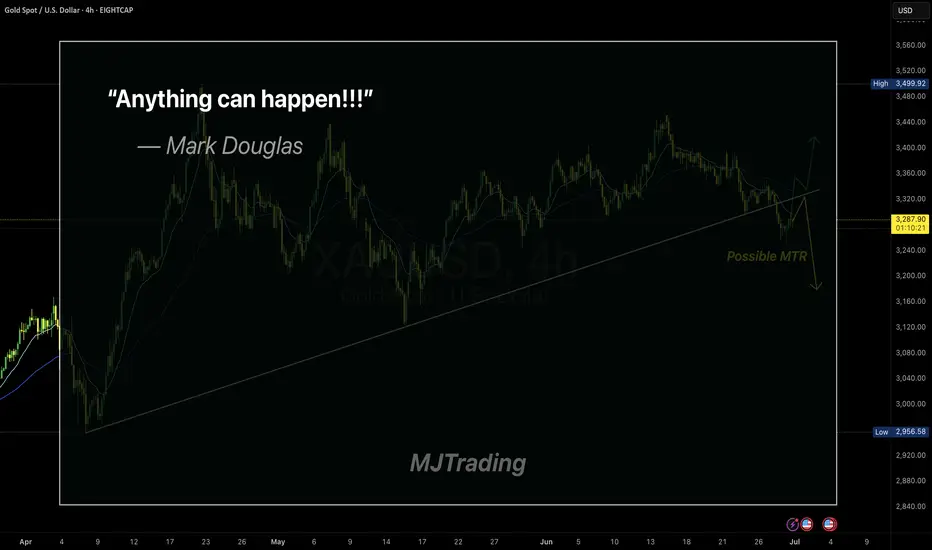
Embracing Uncertainty
In trading, the illusion of certainty is often our biggest enemy.
Even the cleanest setups—like a MTR (Major Trend Reversal)—can fail.
Mark Douglas said it best:
“Anything can happen.”
This simple truth is what keeps professional traders humble and disciplined.
Respect the market, manage your risk, and never assume you know what comes next.
Stay sharp.
#MJTrading
#GoldTrading #XAUUSD #TradingPsychology #AnythingCanHappen #MarkDouglas #ForexMindset #TradingQuotes #PriceAction #RiskManagement #MindOverMarkets #ChartOfTheDay #MJTrading
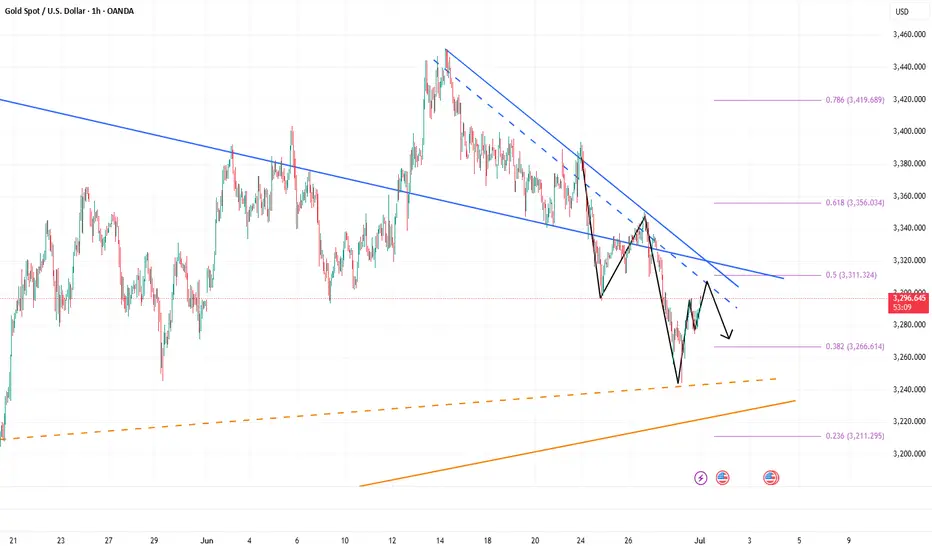
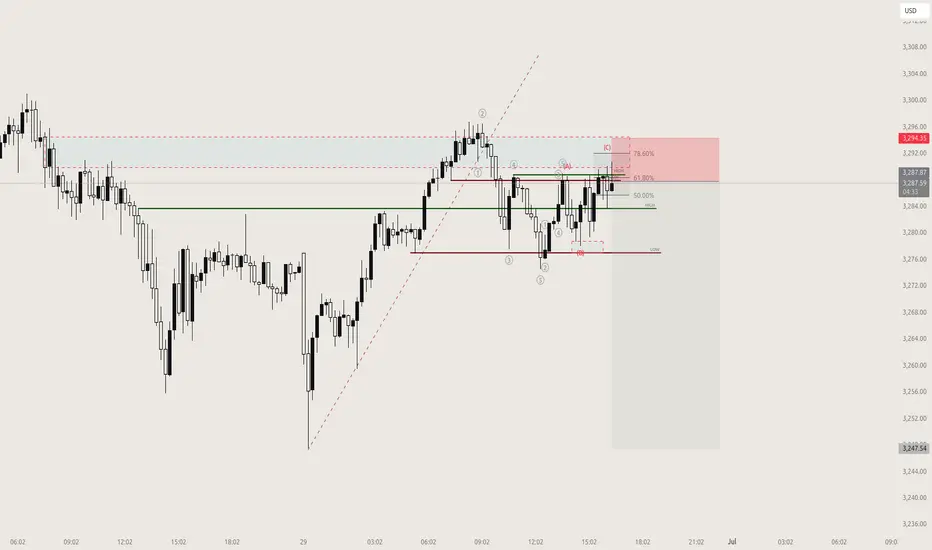
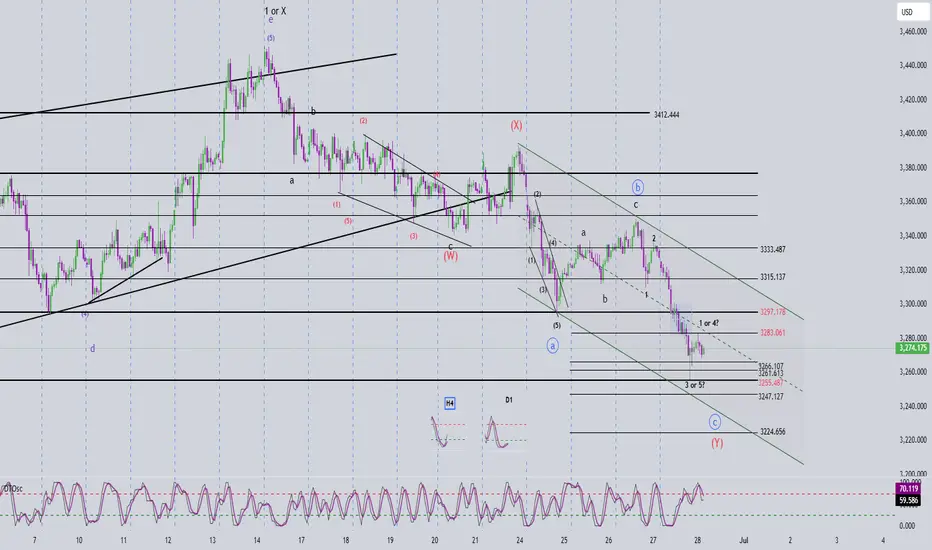
Elliott Wave Analysis – XAUUSD Trading Plan for June 30, 2025
🌀 Elliott Wave Structure
On the H1 chart, we observe a double zigzag correction WXY (in red). Currently, Wave Y appears to be developing as a green abc structure.
In this abc structure:
+ Wave a started with a leading diagonal (5-wave triangle).
+ Wave b followed as a typical abc correction (in black).
+ Wave c is currently unfolding as a clear 5-wave impulsive move, characterized by sharp and rapid price action.
The key issue now is to determine whether:
+ The price has completed wave 5 (black), or
+ It has only completed wave 3 (black) within the green wave c.
If the current movement is wave 3 (black), we should expect a wave 4 correction, followed by one more leg down to complete wave 5. In this scenario, wave 5 will be confirmed if the price breaks below 3255. There are two potential target zones for wave 5:
+ Zone 1: 3247
+ Zone 2: 3224
If wave 5 has already completed, the upward move to 3283 could be wave 1 of a new bullish trend. The next pullback would be wave 2, with an expected target between 3266 – 3261.
⚡️ Momentum Analysis
D1 timeframe: Momentum is in the oversold region, suggesting a high probability of a bullish trend in the upcoming week. This supports the view that wave c (green) of wave Y (red) is nearing completion.
H4 timeframe: Momentum is turning bullish, indicating the current upward movement may continue. This adds to the uncertainty about whether wave 3 or wave 5 has ended.
🧭 Trading Plan
📍 BUY ZONE 1
Entry: 3264 – 3261
SL: 3254
TP1: 3283 | TP2: 3297 | TP3: 3315
📍 BUY ZONE 2
Entry: 3247 – 3244
SL: 3237
TP1: 3283 | TP2: 3297 | TP3: 3315
⚠️ Important Note
This trading plan assumes either wave 3 or wave 5 has completed. Therefore, if in the early Asian session, the price does not touch the 3264 – 3261 zone but instead rises above 3283 without closing above 3297, and then drops back below 3283, we should avoid buying at 3264 – 3261.
Instead, we should wait for a potential entry at the 3247 – 3244 zone.
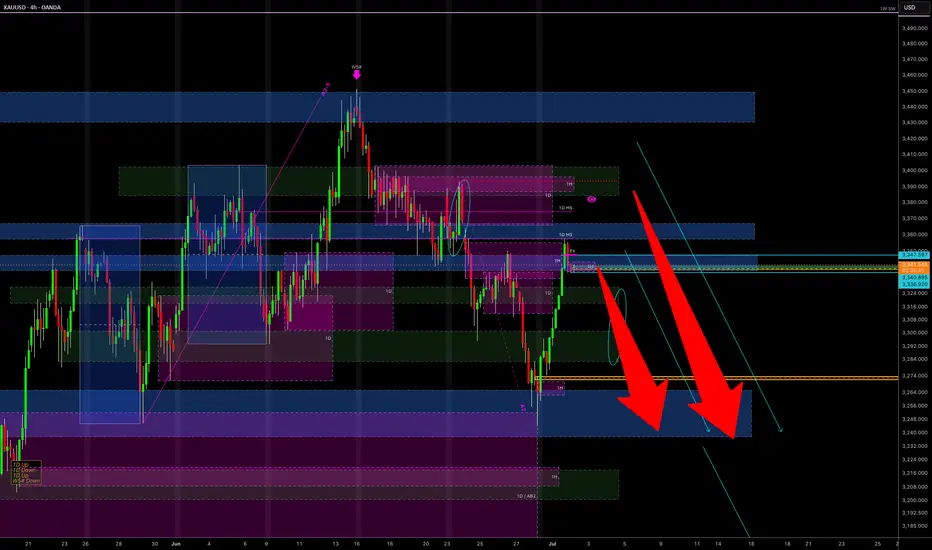
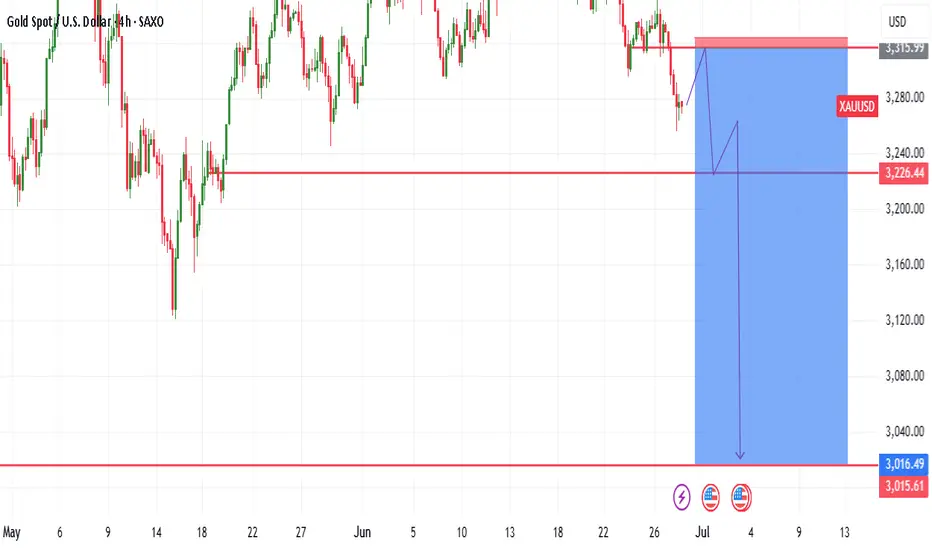
GOLD TOP DOWN ANALYSIS FOR MON. 30TH JUNE - FRI 4TH JULY, 2025Gold looks bearish heading into the new week. We had the formation of a weekly engulfing candle last week. I expect a pullback buy at market open from the current level to a take-profit level of 3316.
After that, I expect a sell-off from the 3318 level down to the 3000 level for the rest of the week.
I will be posting daily updates here, cheers!
Exclusive trading strategy, short gold!From the current gold structure, we can see that gold still needs to continue to retest the 3320-3310, or even the 3305-3295 area; so in the short term, we can still seize the opportunity to consider shorting gold in batches in the 3340-3360 area.
Trading signal:
@3340-3360 Sell, TP:3325-3315-3305
A reliable trader must have an explanation for everything and respond to everything. I have always been committed to the market and insist on writing the most useful core strategies for traders. The transaction details can be seen in the channel!
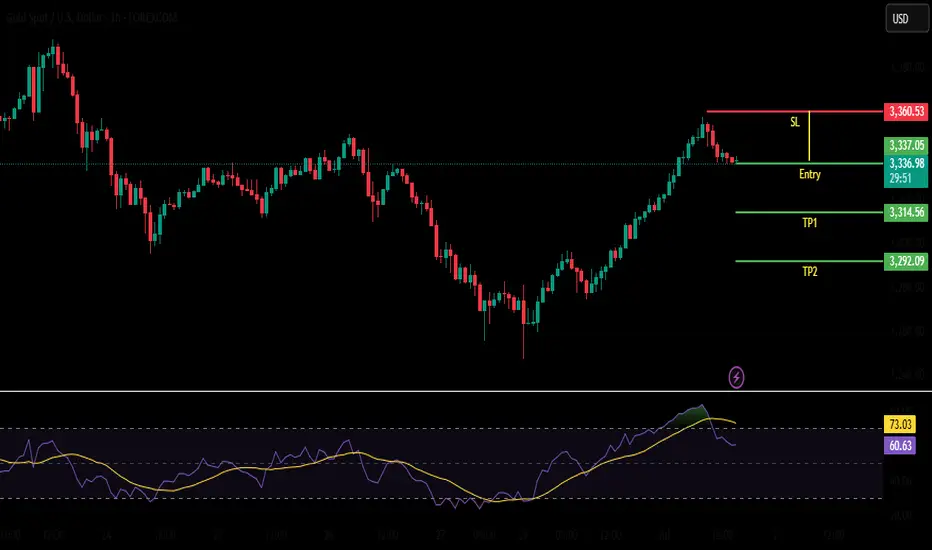
#GOLD Buy 3338.98#GOLD Buy 3338.98
SL 3332.98
TP 3340.98
TP 3348.98
TP 3362.98
Trade at your own risk
Protect your capital
The Wizard 🧙♂️ SWFX
X1: GOLD/XAUUSD Long Trades Risking 1% to make 1.8%X1:
#XAUUSD/#GOLD Long Trades
GOLD/XAUUSD Long for day trade, with my back testing of this strategy, it hits multiple possible take profits, manage your position accordingly.
Risking 1% to make 1.8%
Note: Manage your risk yourself, its risky trade, see how much your can risk yourself on this trade.
Use proper risk management
Looks like good trade.
Lets monitor.
Use proper risk management.
Disclaimer: only idea, not advice
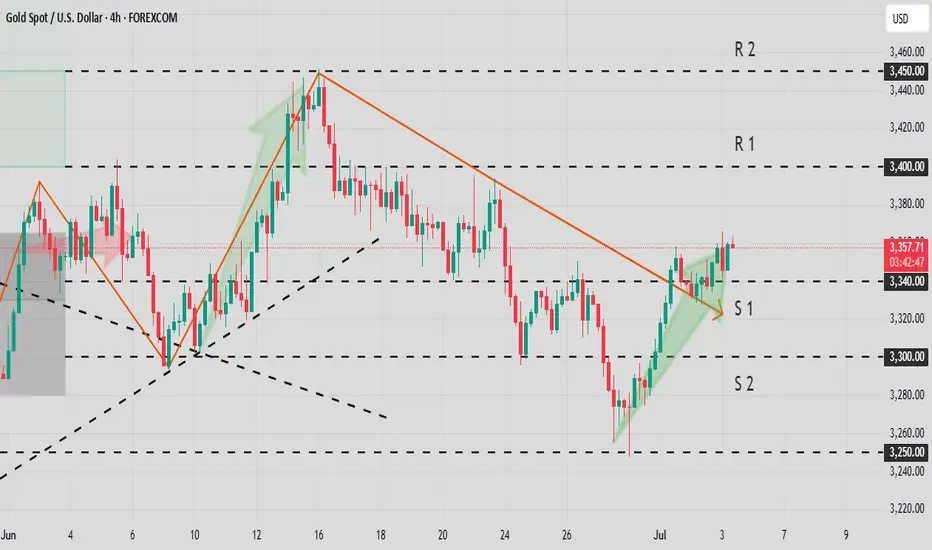
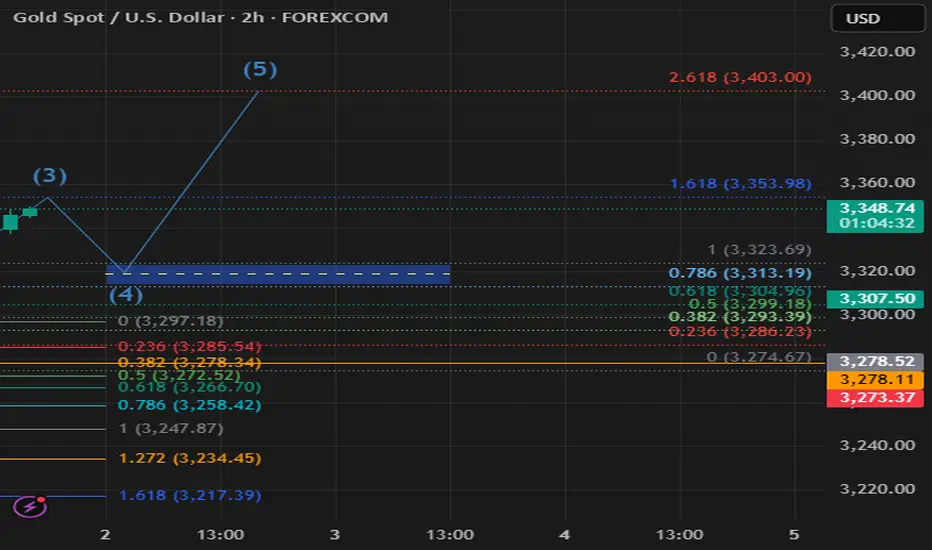
XAU/USD Start July 20251. i start after XAU/USD break previous High and correction (fibbo 32.0) respected. based on elliot wave strategy we can targeting end of wave 3 at 3353 area and than correction wave 4 (target at fibbo 32.0 - 50.0). after target correction, continue wave 5 at target 3403 area.
2. fundamentally speaking, new months new quarter. there ins't new catalist and sentiment. Macro Economic this week focus on labour market at US and FED projection to cut rate.
3. War at Iran and Israel, Russia and Ukraine, India and Pakistan, Trade War case, etc,.
4. Will be update
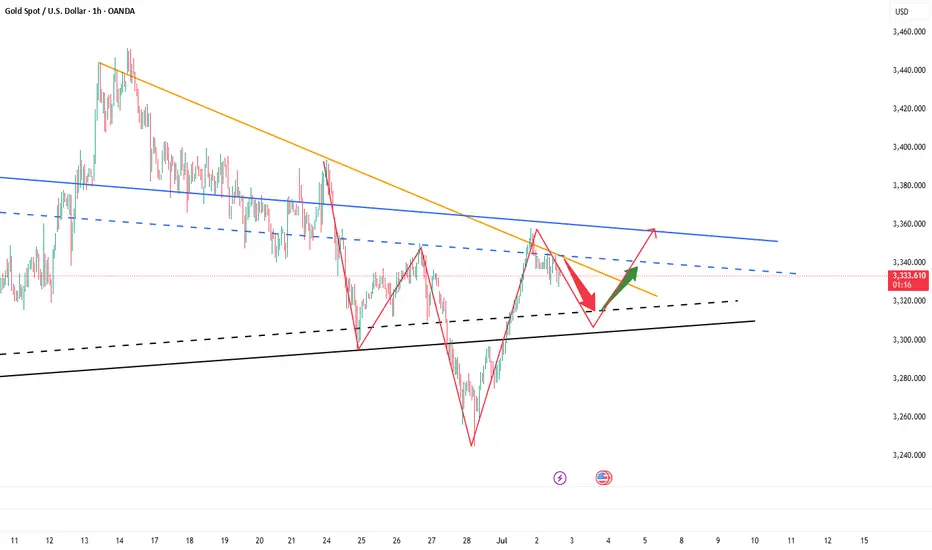
GOLD - bottom out here? What's next??#GOLD.. perfect move as per our analysis and now market looking bottom out here.
Our immediate supporting area is now 3298-98
Keep close with and keep in mind that
We will go for cut n reverse below 3298 on confirmation .
Good luck
Trade wisely
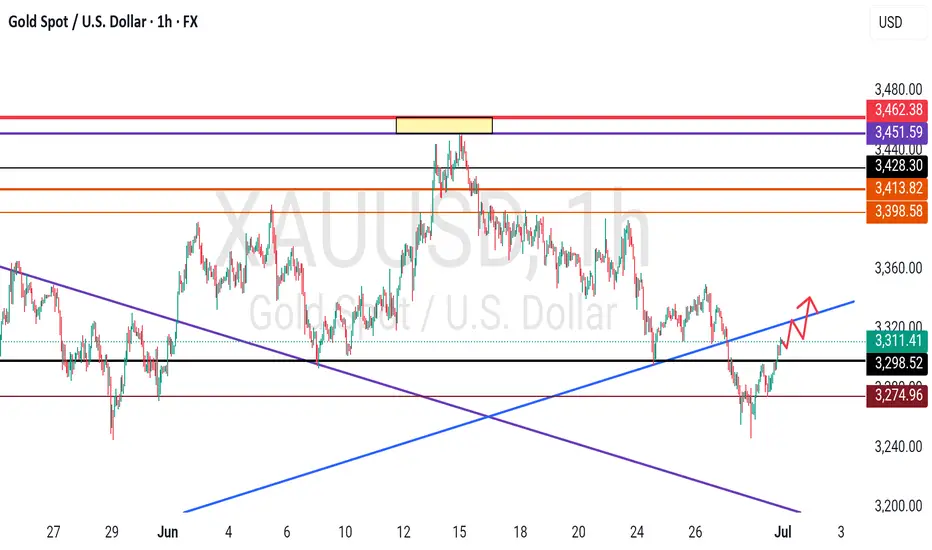
Never hold a short position blindly!In the 4-hour timeframe, consecutive bullish surges have broken the previous weak consolidation pattern. Focus on the key resistance level around 3350 above; for short-term support below, pay attention to the 3315 level, with the critical support zone between 3295-3300 being the primary focus. Overall, maintain the main theme of participating in long positions at lower levels within this range. For prices in the middle of the range, it is advisable to adopt a "wait-and-see" approach, avoid chasing trades impulsively, and patiently wait for key levels to enter positions.

Why the Best Strategies Don’t Last — A Quant TruthOver the years, I’ve built strong connections with traders on the institutional side of the market.
One of the most interesting individuals I met was a former trader at Lehman Brothers. After the collapse, he transitioned into an independent quant. I flew to Boston to meet him, and the conversations we had were eye-opening, the kind of insights retail traders rarely get exposed to.
We didn’t talk about indicators or candlestick patterns.
We talked about how fast and aggressive algorithmic trading really is.
He told me something that stuck:
" People think hedge funds build one algorithm, run it for years, and collect returns. That’s rarely the case. Most algos are extremely reactive. If something stops working, we don’t fix it — we delete it and move on. That’s how the process works."
This isn’t an exception — it’s standard practice.
What stood out most in our talks was how adaptable these algorithms are. If market conditions shift — even slightly — the logic adapts immediately. These systems aren’t built on beliefs or opinions.
They’re built to respond to liquidity, volatility, and opportunity — nothing more.
This level of responsiveness is something most retail traders never factor into their approach, but it’s core to how modern markets operate.
█ How Quant Funds Use Disposable Strategies — And What Retail Can Learn
One of the most misunderstood realities in modern trading is how top quantitative funds like Two Sigma, Citadel, and Renaissance Technologies deploy, monitor, and replace their strategies.
Unlike traditional investors who develop a strategy and stick with it for years, many quant funds take a performance-first, outcome-driven approach. They:
Build hundreds of strategies,
Deploy only the ones that currently work, and
Retire or deactivate them the moment performance drops below their internal thresholds.
This is a deliberate, statistical, and unemotional process — and it's something that most retail traders have never been taught to think about.
█ What This Means
Quantitative firms often run:
100s of models simultaneously,
Each targeting a specific edge (e.g. trend-following, mean reversion, intraday order flow),
With tight risk controls and performance monitoring.
When a model:
Falls below a minimum Sharpe ratio (risk-adjusted return),
Starts underperforming vs benchmark,
Experiences a breakdown in statistical significance…
…it is immediately deprecated (removed from deployment).
No ego. No "fixing it."
Just replace, rebuild, and redeploy.
█ It runs live… until it doesn’t.
If slippage increases → they pull it.
If volatility regime changes → they pull it.
If too many competitors discover it → they pull it.
If spreads tighten or liquidity dries → they pull it.
Then? They throw it away, rebuild something new — or revive an old one that fits current conditions again.
█ Why They Do It
⚪ Markets change constantly
What worked last month might not work this week — due to regime shifts, volatility changes, or macro catalysts. These firms accept impermanence as part of their process.
⚪ They don’t seek universal truths
They look for temporary edges and exploit them until the opportunity is gone.
⚪ Risk is tightly controlled
Algorithms are judged by hard data: drawdown, volatility, Sharpe ratio. The moment a strategy fails to meet these metrics, it’s shut off — just like any risk engine would do.
⚪ They don’t fix broken models — they replace them
Time spent “tweaking” is time lost. New strategies are always in the pipeline, ready to rotate in when older ones fade.
█ Research & Real-World Validation
"Modern quantitative funds must prioritize real-time adaptability and accept that any statistical edge has a short shelf life under competitive market pressures." Adaptive Trading Agents” (Li, 2023)
Donald MacKenzie’s fieldwork on HFT firms found that algos are treated like disposable tools, not long-term investments.
Studies on adaptive algorithmic trading (e.g., Li, 2023; Bertsimas & Lo, 1998) show that funds constantly evaluate, kill, and recycle strategies based on short-term profitability and regime changes.
A former Two Sigma quant publicly shared that they regularly deploy hundreds of small-scale models, and once one fails risk thresholds or decays in Sharpe ratio, it’s immediately deprecated.
Walk-forward optimization — a method used in quant strategy design — is literally built on the principle of testing a strategy in live markets and discarding it if its forward performance drops.
█ Why Retail Rarely Hears This
Retail traders are often taught to:
“Stick with a system”
“Backtest 10 years”
“Master one setup”
But in the real quant world:
There is no perfect system. There are only edges that work until they don’t. And the moment market structure shifts — new volatility, different volume profile, regime change — the strategy is gone, no questions asked.
█ What This Means for Retail Traders
⚪ Don’t idolize “one perfect system.”
What worked in April might not work in June. Treat your strategies as temporary contracts, not lifelong beliefs.
⚪ Build modular logic.
Create systems you can tweak or retire quickly. Test new regimes. Think in frameworks, not fixed ideas.
⚪ Learn from regime shifts.
Volatility, spread, volume profile, macro tone — track these like a quant desk would.
⚪ Use metrics like:
- Win streak breakdown
- Market regime tracker
- Edge decay time (how long your setups last)
█ Final Thought
The best traders — institutional or retail — understand that there’s no such thing as a permanent edge. What matters is:
Having a repeatable process to evaluate strategy performance,
Being willing to shut off or rotate out what’s no longer working,
And staying adaptable, data-driven, and unemotional.
If you start treating your strategies like tools — not identities — you’ll begin operating like a professional.
-----------------
Disclaimer
The content provided in my scripts, indicators, ideas, algorithms, and systems is for educational and informational purposes only. It does not constitute financial advice, investment recommendations, or a solicitation to buy or sell any financial instruments. I will not accept liability for any loss or damage, including without limitation any loss of profit, which may arise directly or indirectly from the use of or reliance on such information.
All investments involve risk, and the past performance of a security, industry, sector, market, financial product, trading strategy, backtest, or individual's trading does not guarantee future results or returns. Investors are fully responsible for any investment decisions they make. Such decisions should be based solely on an evaluation of their financial circumstances, investment objectives, risk tolerance, and liquidity needs.
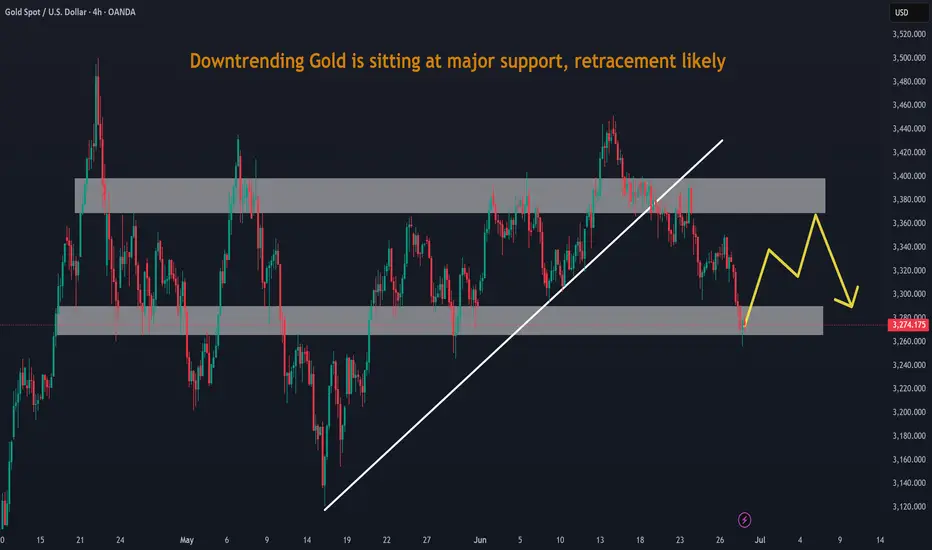
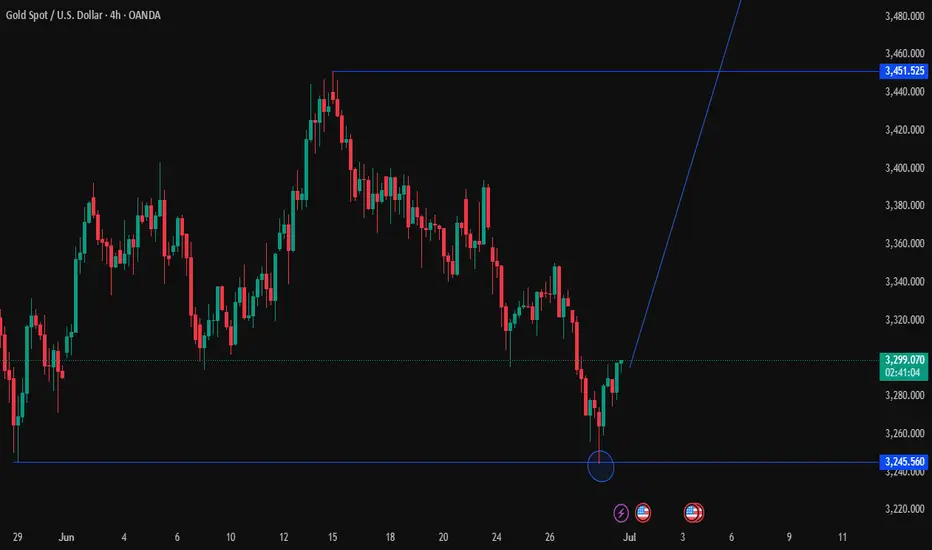
Downtrending Gold is sitting at major support, retracement likelDowntrending Gold is sitting at major support, retracement likely.