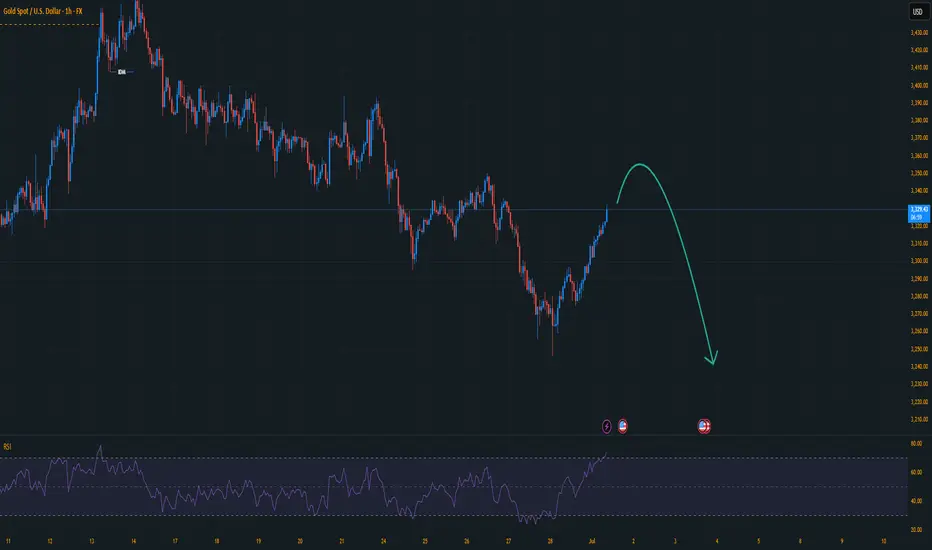
XAUUSD Maintains Bullish MomentumTechnical Analysis of XAUUSD – 15-Minute Chart – July 1st, 2025
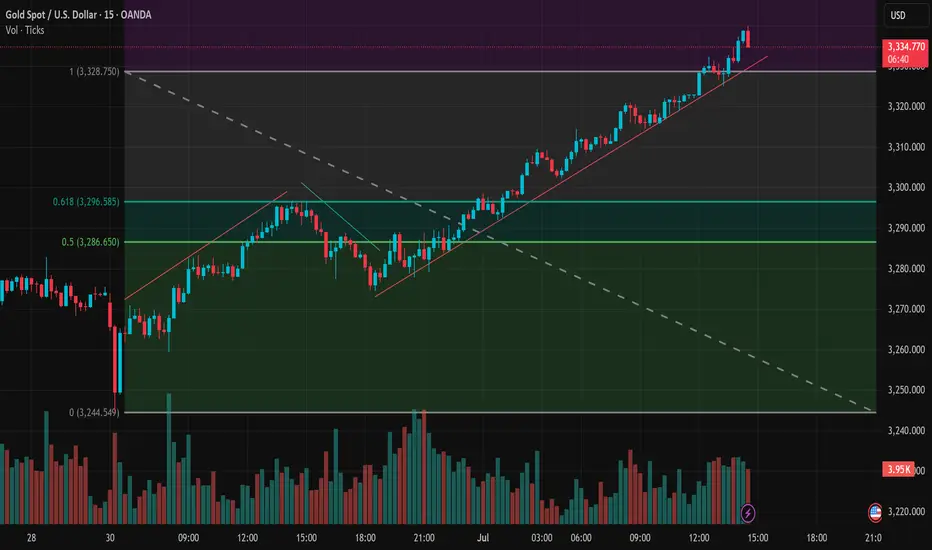
In the latest trading session, XAUUSD continues to demonstrate a strong short-term uptrend. The 15-minute chart clearly shows a series of higher highs and higher lows, indicating that buyers remain in control.
1. Trend Structure
After a brief pullback from the June 30th high, price quickly rebounded and has been respecting the rising trendline, reflecting strong buying momentum.
From midnight (July 1st) to the present, a sequence of bullish candles—especially long-bodied green candles—has appeared, accompanied by increasing volume, confirming that strong capital inflow is entering the market.
2. Trading Volume
Volume has been gradually increasing along with the price rise, especially during minor breakout points. This suggests real buying pressure, not a false pump.
3. Key Support and Resistance Zones
Short-term support: Around 3,320 USD – a confluence of the rising trendline and recent swing lows.
Next resistance zone: Between 3,345 – 3,350 USD – previously a strong supply area. It should be closely monitored to see if price can break through.
4. Suggested Trading Strategy
Priority should be given to buying on dips, especially if price retraces to the 3,320 – 3,325 area and confirms with bullish candlestick patterns or volume support.
Avoid chasing entries near 3,345 – 3,350 without a clear breakout confirmation.
Conclusion:
XAUUSD is showing a clearly defined bullish trend in the short term. Buyers remain dominant, but caution is advised around key resistance levels. Wait for confirmation before expanding positions.
What do you think about this rally? Are you already in the trade or still on the sidelines? Drop your thoughts below – let’s discuss!
XAUUSDK trade ideas
6.30 Safe haven disappears, gold loses its luster!Gold did not break through the upper pressure at midnight last Friday. Gold fell directly after opening in the morning on Friday. The bears broke through the previous 3295 support line, and the lowest reached 3255 in the evening. It closed at around 3274, and the daily line also closed in the form of a big Yin line.
From the 4-hour analysis, the upper short-term resistance focuses on the 3295-3301 line, and the 3316 line is focused on. In terms of operation, it is still rebounding and continuing to be short and follow the trend to fall. The short-term support below focuses on the 3250-3255 line. The overall high-altitude participation tone remains unchanged relying on this range. I will remind you of the specific operation strategy during the session, and pay attention to it in time.
Gold operation strategy:
1. Short gold rebounds at the 3295-3301 line, and short gold rebounds at the 3314-16 line, stop loss at 3326, target 3255-3260 line, and continue to hold if it breaks;

GOLD +2500 pips setup — Trendline Holds , Fed Pressure Builds !📊 GOLD XAU/USD Daily Analysis
✅ Technical View:
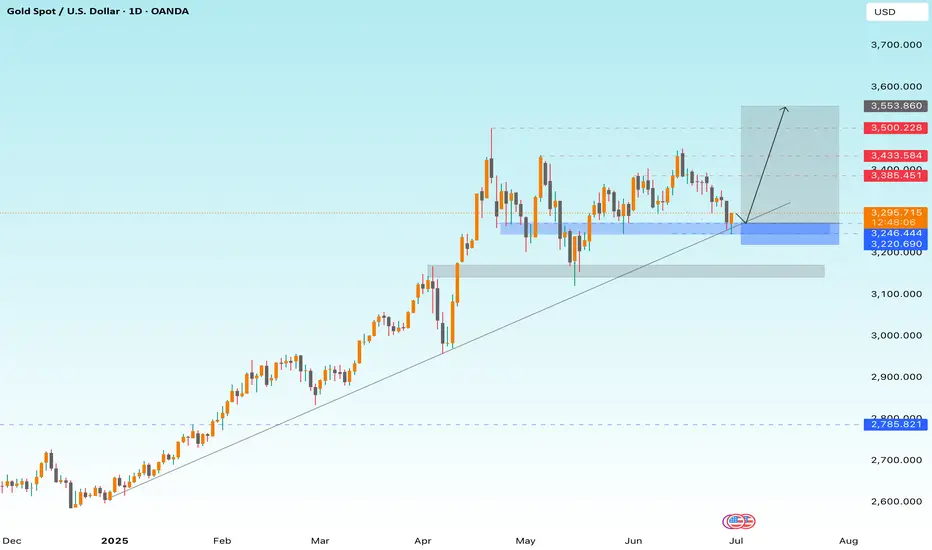
Gold continues to respect a strong bullish trendline, holding above key demand zones (3220 – 3290).
A solid retest of the trendline and the blue demand area supports the bullish continuation.
Upside targets are:
3385 (first target)
3433 – 3500 (next resistances)
3553 (extended target if momentum holds).
✅ Fundamental Insight:
Ongoing market pressure on the Federal Reserve to cut interest rates is boosting gold’s safe-haven appeal.
Lower US yields and increased uncertainty strengthen the bullish bias for gold in the mid-term.
🎯 Key Levels:
✅ Supports: 3220 – 3290 (main) | 2785 (long-term)
✅ Resistances: 3385 – 3433 – 3500 – 3553
📢 If you like strong, clear setups:
Don’t forget to Like 👍 – Comment 💬 – Share 📤 – and Follow 🔔 me here on TradingView for more powerful ideas every week!
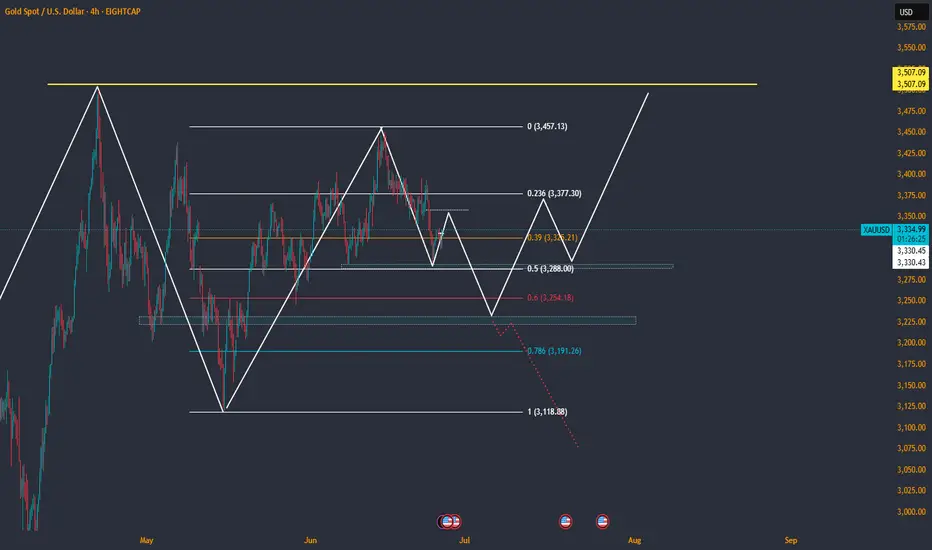
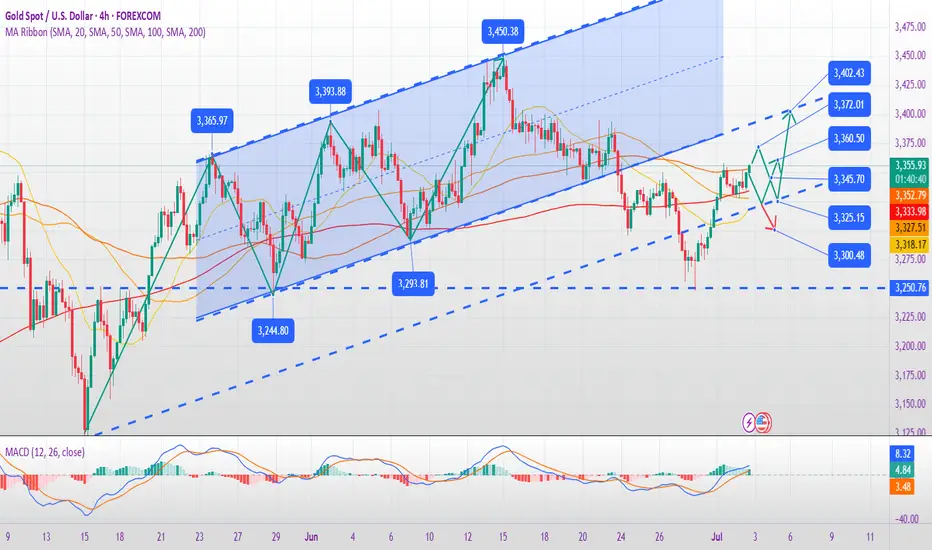
XAUUSD 4hour TF - June 29th, 2025XAUUSD 4hour Neutral Idea
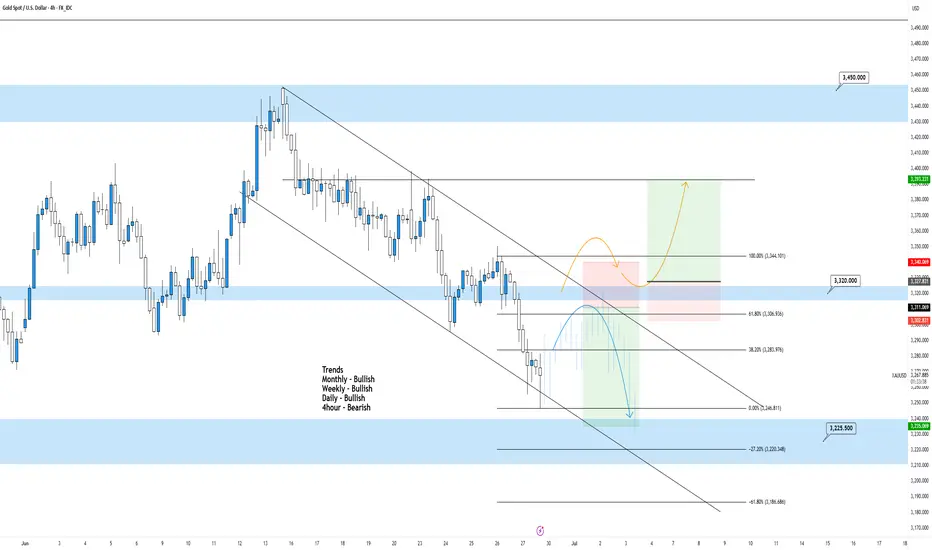
Monthly - Bullish
Weekly - Bullish
Daily - Bullish
4hour - Bearish
Gold has been on the rally of a century for a while and isn’t showing too many signs of slowing down long term. For now we do have a couple opportunities I can bring to your attention.
4hour bearish continuation - For this to happen we would like to see price action come back to our pocket of confluence near the 3,320.000 level followed by bearish conviction. If this happens look to target lower toward major support levels like 3,225.500.
4hour trend reversal - If we are to see a reversal of the 4hour trend we would need to see price action pop back above the 3,320.000 resistance area. Look for strong bullish conviction above this level and target higher toward appropriate levels of resistance.
UPDATE 26th June 2025 Consolidation Phase Consolidation Phase still running.
It have a potential to retest a lower support.
During this consolidation period, we will continue to monitor any fluctuations ( war, geopolitic, US economic, etc ) that will affect the movement of gold prices.
So becareful at support level / key level.
Goodluck !
If you agree...click Boost
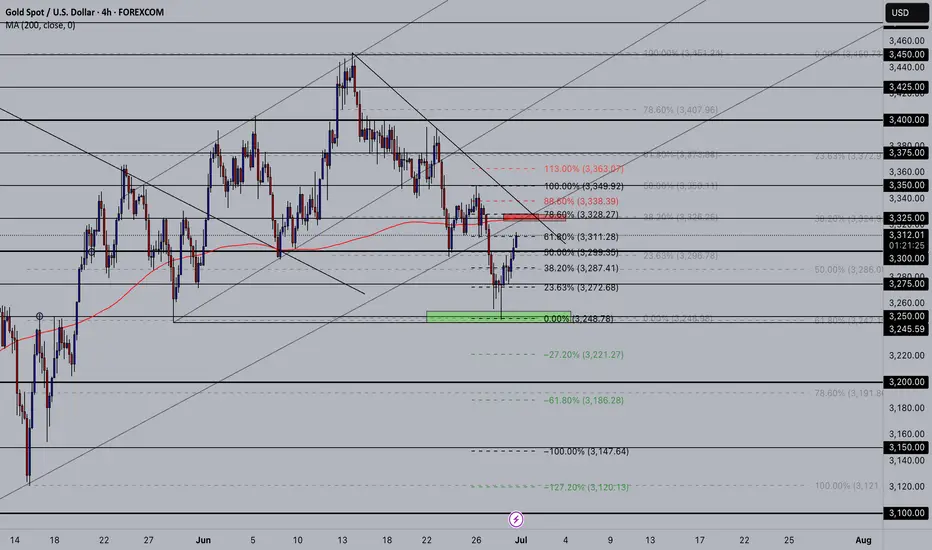
"Gold at Critical Zone – Parabolic Curve Support or Breakdown? 📈 Gold Parabolic Structure | Base 4 Breakout Setup | $4,000 Target
Sharing my analysis on Gold’s ongoing parabolic trend, which has followed a textbook progression of Base 1 → Base 4 since mid-2022. The price has respected a structural curved trendline, and we are currently in Base 4 consolidation — often the final pause before a blow-off rally.
Current Setup:
Gold is consolidating between $3,200 – $3,400, forming Base 4.
There is weekly bearish divergence, indicating momentum loss, but this is normal in late-stage parabolas.
I expect a retest of the $3,200 zone, near the parabolic curve support, possibly with a fakeout wick below — a common shakeout before the final rally.
Seasonality suggests the first week of July is typically bearish, which aligns with this potential retest.
Trade Plan (If Setup Confirms):
Watch for a strong bullish reversal candle near $3,200 (parabolic curve support).
Entry above the high of that bullish candle.
Stop loss just below the candle’s low.
Target: $4,000+, which aligns with typical blow-off potential (+20–25% from Base 4 breakout).
If Gold breaks and holds above $3,400, it could begin the vertical phase of the move.
Parabolic Move Concept Recap:
Base 1: Accumulation
Base 2: Confirmation
Base 3: Acceleration
Base 4: Final pause before blow-off
After Base 4, price often rallies sharply before forming a major top.
This is a high-reward but high-risk phase. Manage risk and don’t chase late entries once the move begins.
Would love to hear your thoughts and variations on this setup.
#Gold #XAUUSD #ParabolicTrend #TechnicalAnalysis #BlowOffTop #Base4

XAU/USD Gold LONG 1:1 XAU/USD Gold LONG 1:1
Let's try to catch the low of the 4h candle, limit order.
Enjoy!
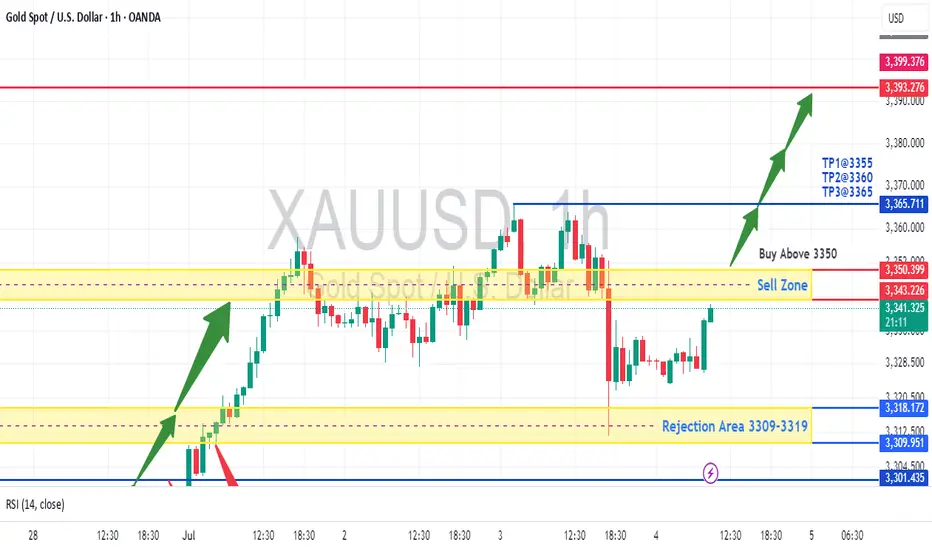
XAUUSD - Retesting 3400 before DeclineThe chart shows a potential buy setup for gold (XAUUSD) with the following key points:
Price Action: Gold is trading at 3,341.465, above the suggested "Buy Above 3350" level, indicating a bullish bias.
Support/Resistance: The rejection area at 3309-3319 held as support, and price has moved higher, confirming buyer interest.
Take Profit Levels: TP1 (3355), TP2 (3360), and TP3 (3365) provide clear upside targets.
RSI Confirmation: The RSI (14) at 54.21 shows moderate bullish momentum without being overbought.
Volume & Close: The slight increase in price (+0.09%) with supportive volume suggests accumulation.
Trade Idea: Enter long above 3350 with stops below 3309, targeting TP1-TP3. The rejection zone and RSI support further upside.
Disclaimer: This is not financial advice. Please consult with a financial advisor before making any investment decisions. We are not responsible for your loss because we are not SEBI registered and this analysis based on technical aspects and only for educational practice. Do your own research.
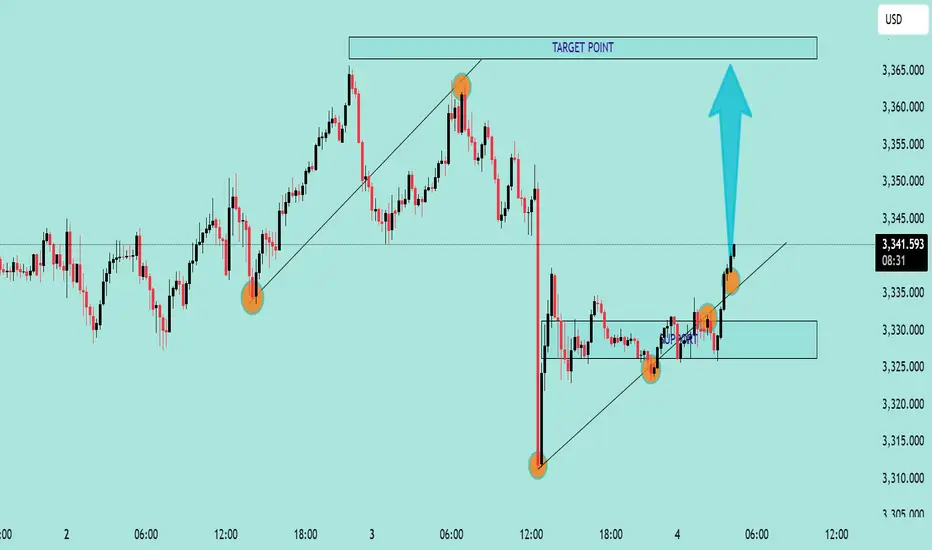
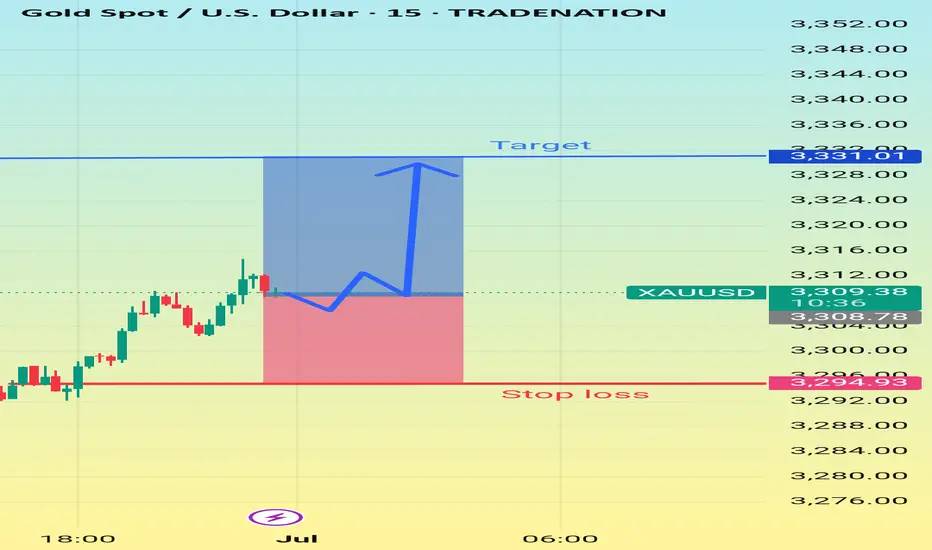
Gold/USD Bullish Breakout Toward Target Zone Gold/USD Bullish Breakout Analysis 🚀🟢
The chart illustrates a strong bullish breakout from a consolidation zone, signaling upward momentum:
🔍 Key Technical Observations:
Support Zone: The price respected the support area around 3,325 – 3,330 USD, forming a solid base for reversal.
Bullish Structure: Series of higher lows and higher highs indicate a bullish trend formation.
Breakout Confirmation: Price broke above short-term resistance with a strong bullish candle, indicating buying pressure.
Trendline Support: The ascending trendline has held well, confirming trend continuation.
Target Point 🎯: Projected target is near 3,365 USD, which aligns with a previous resistance and Fibonacci confluence zone.
✅ Conclusion:
The breakout above resistance, supported by a bullish structure and momentum, suggests further upside potential toward the 3,365 USD target zone. As long as price holds above the breakout level, bullish bias remains valid.
🛑 Watch for invalidation if price falls back
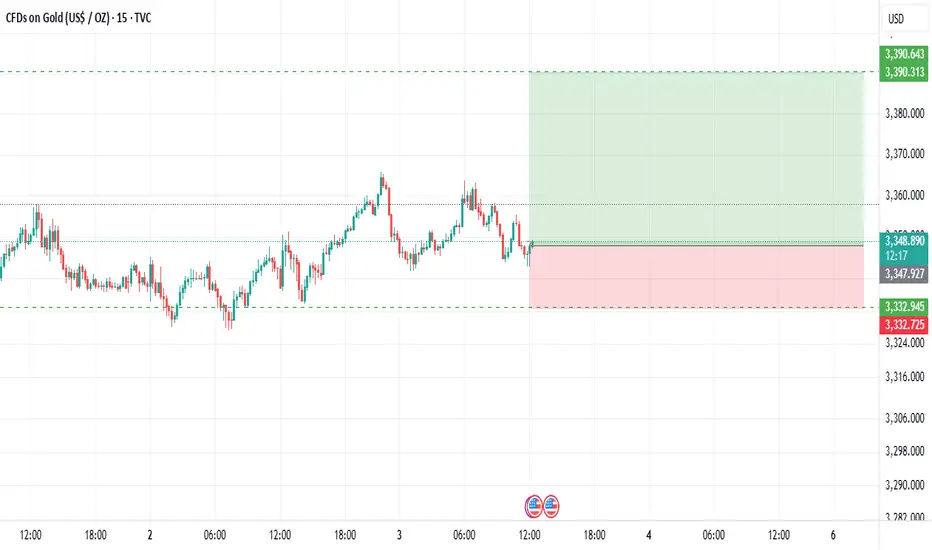
GOLD 15M BULL CONTINUATIONBull still in control to at list 3390
I will hold this trade till tomorrow and if we are not there by the time of NFP will close it manual
Will update here
Gold Move is it going down again ? gold is doing range now we have strong bearish candle and move it respect we can see down side but now wait.
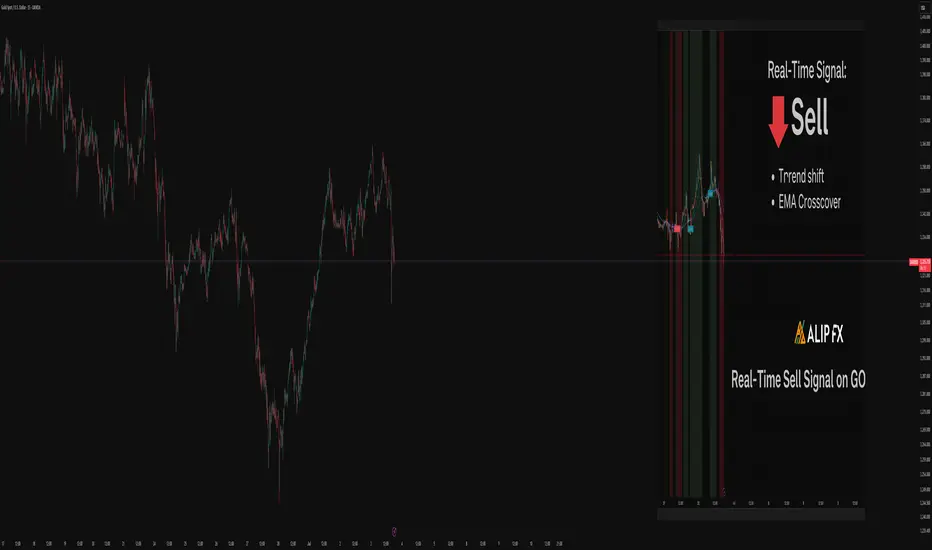
Live Signal from ALIP FX Smart Scalper | XAUUSDThe ALIP FX Smart Scalper indicator just issued a SELL signal on XAUUSD (Gold) on the 15-minute timeframe.
The trend filter turned red, EMA structure aligned to the downside, and the signal confirmed by strong momentum.
📉 Scenario: Short bias while the trend remains bearish.
🕒 Timeframe: M15
📌 Reminder: Wait for candle close and confirmation before entry.
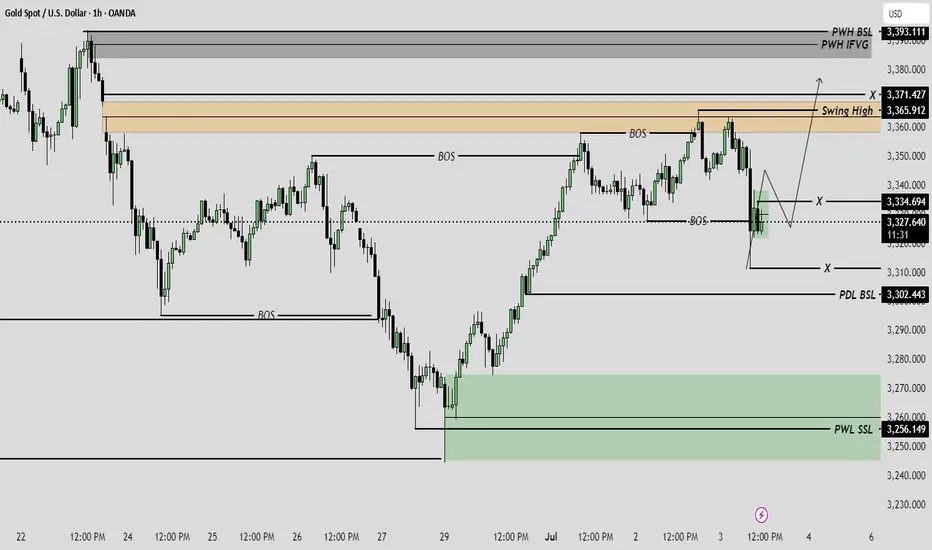
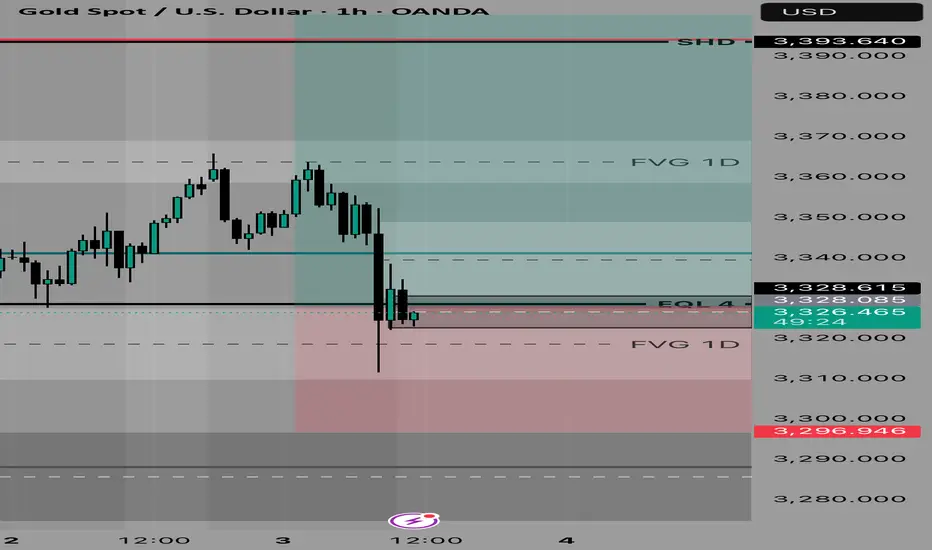
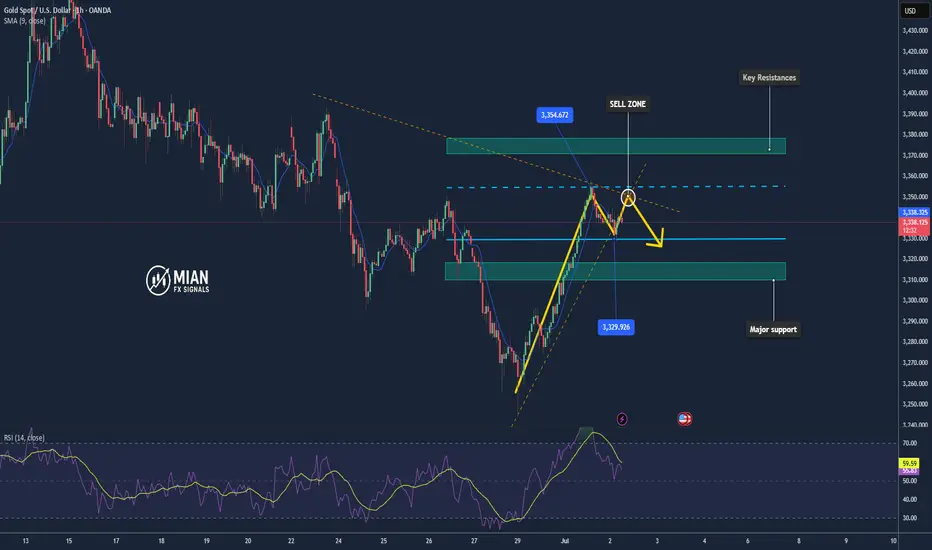
Analysis and strategy of the latest gold trend on July 3:
1. Analysis of gold news
The current market focus is as follows:
Trump tax reform is advancing & trade agreement is approaching
The tax reform was passed by the Senate, and the deadline for trade negotiations on July 9 is approaching, which has triggered a rise in risk aversion.
The Fed's attitude is subtle
Although Powell did not explicitly support the July rate cut, he emphasized that more data is needed for support, and did not rule out the possibility. This "dovish" attitude supports the medium- and long-term bullish expectations for gold.
The upcoming big non-agricultural data (July 3 US trading session)
This means that the market will quickly reflect the gap between expectations and reality in the next 24 hours, and volatility may increase.
2. Gold technical analysis
Summary of recent trends:
Gold rose strongly on Tuesday, reaching a high of $3,358;
Stagflation signals appeared on Wednesday, and the risk of chasing long positions at high levels is extremely high;
The current market bullish sentiment is high, but the technical side has entered the overbought zone, and the bullish momentum is weakening.
Key resistance/support levels:
Resistance zone: 3357-3367 USD: Near Tuesday's high, it is an important defensive position for short sellers;
Support zone: 3325-3315 USD: If it falls below, short sellers may further exert their strength, with the target directly pointing to 3300 USD.
Today's operation strategy suggestion:
Main idea: short selling on rebound
Currently in a high-level oscillation stage, it is recommended to short sell at high levels and buy at low levels, and be cautious in chasing up.
Short order strategy:
Entry position: short near $3365
Stop loss: above $3375
Target: 3326 / 3315 / 3300
Long order strategy (conservative):
If it pulls back to around $3315 and stabilizes, you can short long with a small position
Stop loss: below $3305
Target: 3326 / 3340
III. Comprehensive judgment and suggestions
Gold is currently in a news-intensive & technically overbought stage, and volatility will increase;
There is a high probability that the intraday Asian and European sessions will fluctuate weakly, waiting for the US non-agricultural guidance direction;
If the ADP and Challenger layoffs data are strong, gold will face obvious downward pressure in the short term;
Don't chase the highs, follow the trend, and risk control is the key.
📌Warm Tips:
Maintain trading discipline and do not trade with emotion;
Before the non-agricultural data, appropriately reduce positions or stop profits;
Pay more attention to the linkage changes between US bond yields and the US dollar index, which have a great impact on gold.
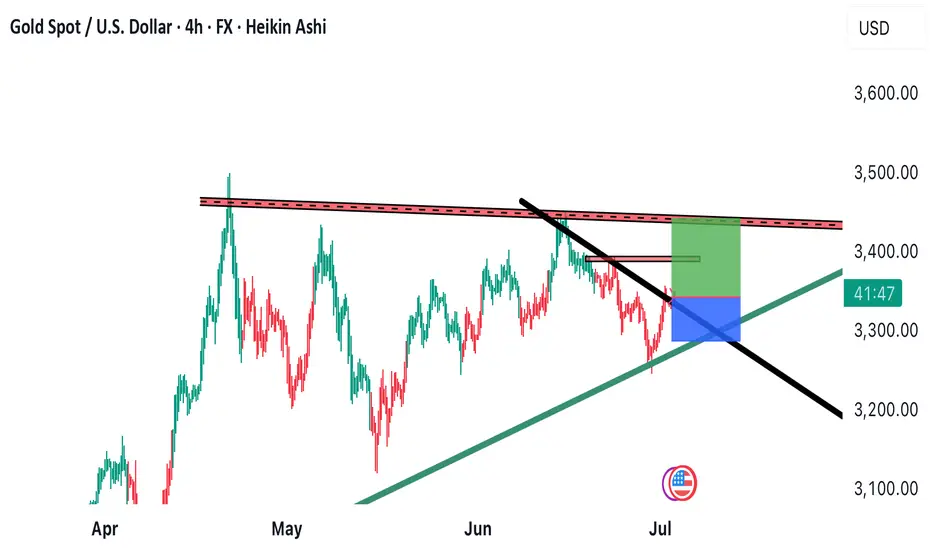
BUY. gold against the dollar using "Heikin Ashi" Analysis
The chart for the price of gold against the dollar using "Heikin Ashi" candles on a 4-hour timeframe. Here are the details:
Price Analysis:
1. Ascending Triangle:
- The price is fluctuating within an ascending triangle, indicating the possibility of a continued uptrend.
- The upper level of the triangle acts as resistance at around $3,350.
2. Support Line:
- The ascending support line (green line) supports the price movement, enhancing the chances of the uptrend continuing.
3. Resistance Level:
- The level indicated by the red line represents the resistance that, if broken, could lead to a significant price increase.
Opening a Buy Position:
1. Confirmation of Breakout:
- Wait for confirmation of a breakout above the resistance level ($3,350) before starting to open a buy position.
- Closing a candle above the resistance level can be used as a confirmation signal.
2. Risk Management:
- Set a stop-loss below the support line of the triangle to minimize risks in case of a pullback.
3. Price Target Advice:
- Entry Price: $3,350.00
- First Target: $3,375.00
- Second Target: $3,400.00
- Third Target: $3,430.00
- 🚨 Stop Loss: $3,329.00
4. Ongoing Technical Analysis:
- Periodically review the analysis to ensure the trend continues and to identify potential changes.
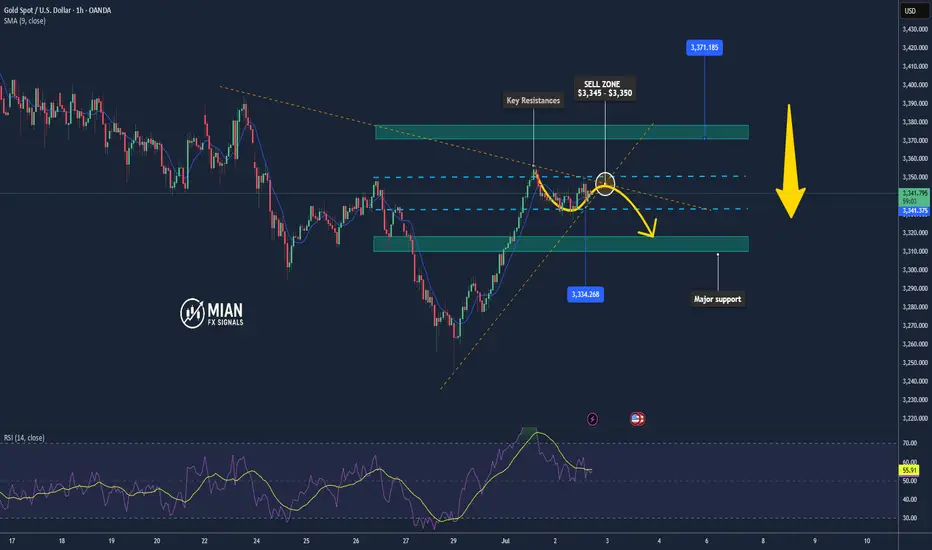
Gold Sees Volatile Swings – Pullback Risk Remains📊 Market Highlights:
Gold surged to $3,351 earlier today after weaker-than-expected US ISM manufacturing data, which boosted expectations of a Fed rate cut. However, profit-taking quickly pushed prices down to $3,334 before recovering to $3,342.
📉 Technical Analysis:
• Key Resistance: $3,351
• Nearest Support: $3,334
• EMA: Price is above EMA 09 → uptrend still intact.
• Candles / Volume / Momentum: H1 candle shows a long upper wick, indicating selling pressure near the recent high. Bullish momentum is slowing, and volume has started to normalize.
📌 Outlook:
Gold may face a short-term pullback if it fails to break above $3,351 and the USD strengthens during the US session.
________________________________________
💡 Suggested Trading Strategy:
🔻 SELL XAU/USD at: $3,345 – $3,350
🎯 TP: $3,334
❌ SL: $3,353
🔺 BUY XAU/USD at: $3,332 – $3,334
🎯 TP: $3,350
❌ SL: $3,323
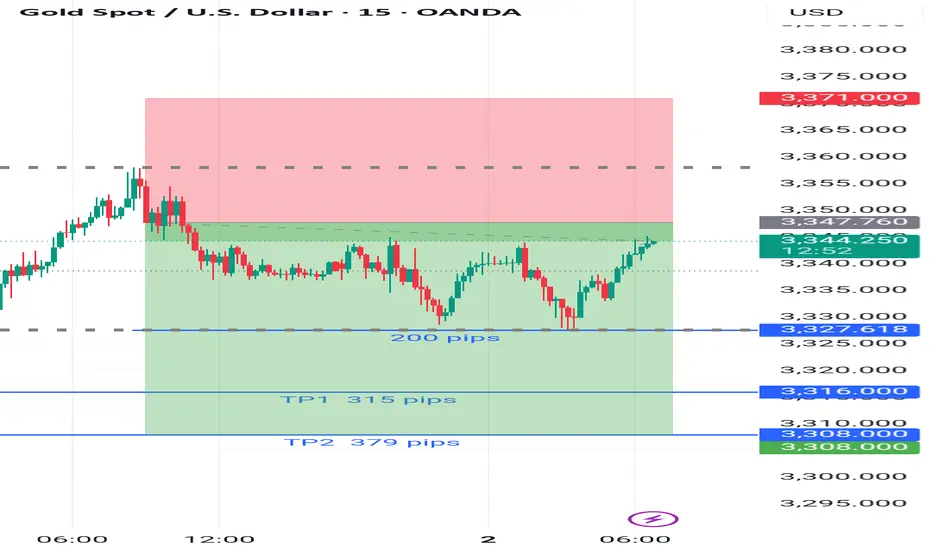
AFTER - XAU/USD - Jul 1,2025 DoneCongratulations guys 200 pips profits
✅ XAU/USD Trade Recap – Jul 1,2025
Bias: Short (Sell Position)
🔹 Entry Price: Around $3,348
🔻 Stop-Loss: $3,371
🎯 Take-Profit Target: $3,327 (✅ Hit – 200 pips)
📉 Result: First target partially reached – trade closed with +200 pips in profit.
Price rejected the resistance area and moved downward, allowing for a clean exit before reaching TP1 and TP2. Conservative profit-taking secured gains without risking reversal.
💡 Summary:
Smart and disciplined execution. The market respected the setup, and you locked in profits safely at 200 pips before any retracement.
Gold Pulls Back Slightly After Peaking at $3,357📊 Market Overview:
Gold rallied to $3,357 yesterday following weak US manufacturing PMI, sparking expectations of an upcoming Fed rate cut. This morning, prices are pulling back to around $3,340 as traders await the FOMC meeting minutes for further guidance.
📉 Technical Analysis:
• Near resistance: $3,357
• Key resistance: $3,370
• Near support: $3,330
• Major support: $3,318
• EMA: Price is still above the 09 EMA, but starting to slope downward → short-term weakness emerging.
• Candlestick & momentum: Doji candle with a long upper wick on H4 chart around $3,357 → showing fading bullish momentum. RSI dropping out of overbought zone confirms potential short-term pullback
📌 Outlook:
Gold is currently in a mild downward correction, and may continue to decline toward $3,330 – $3,318 if the FOMC minutes do not suggest strong dovish intent.
💡 Suggested Trading Strategy:
🔻 SELL XAU/USD at: $3,350 – $3,354
🎯 TP: $3,330
❌ SL: $3,359
🔺 BUY XAU/USD at: $3,328 – $3,332
🎯 TP: $3,350
❌ SL: $3,318
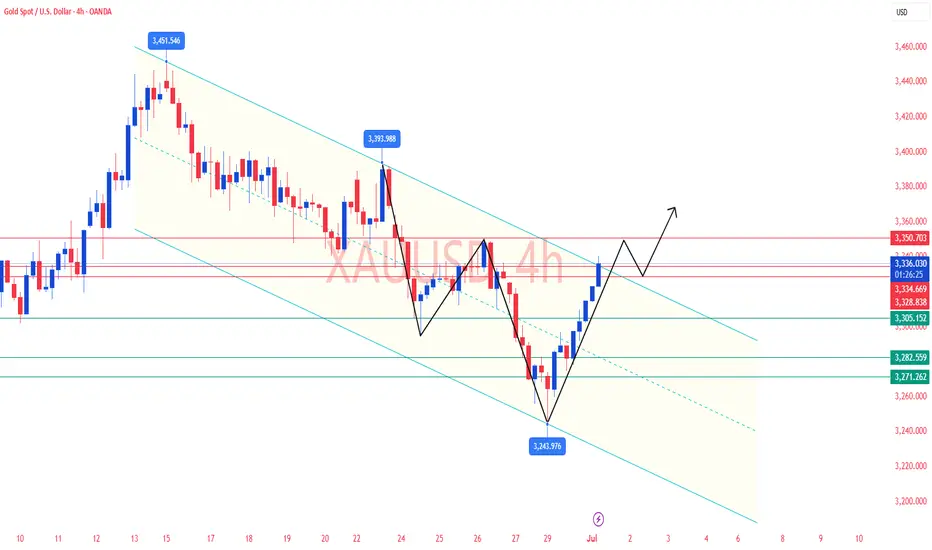
Gold Analysis and Trading Strategy – July 1✅Yesterday, gold staged a strong “V-shaped reversal,” surging violently from the intraday low of $3247 to a high of $3309. The daily chart closed with a large bullish candlestick featuring a long lower shadow, initially confirming the validity of short-term bottom support and signaling a strong bullish rebound.
✅Fundamental Overview:
The U.S. Dollar Index recorded its sixth consecutive monthly decline, further falling today to 96.87—the longest losing streak since 2017. This reflects growing market expectations for future Fed rate cuts. A weakening dollar has strengthened non-U.S. currencies and reduced the holding cost of gold, providing upward momentum for gold prices.
✅Technical Analysis:
Gold is currently in a technical rebound phase. After reclaiming the key $3300 level yesterday, the short-term trend has returned to a bullish stance. A bullish consolidation structure is now confirmed. However, on the daily chart, prices are still capped below the 10-day and 20-day moving averages (around $3330–3340), while the RSI remains in a weak adjustment phase below the midline, suggesting medium-term direction remains uncertain. In the short term, bulls dominate. The 4-hour chart shows consecutive bullish candles breaking above the middle Bollinger Band, with a golden cross forming near the $3285 area. The 1-hour chart shows Bollinger Bands expanding upward, with prices riding the upper band and moving averages in bullish alignment.
🔴Key Resistance Levels: 3328 – 3335 – 3348
🟢Key Support Levels: 3305 – 3282 – 3271
✅Trading Strategy for Asia–Europe Session:
🔹 Long Positions:
🔰If gold remains firmly above $3300, consider entering long positions on pullbacks to the $3305–3308 zone. Set a stop-loss below $3300 and aim for a target range of $3328–3335.
🔰If the price breaks above the $3328 resistance with volume confirmation, consider adding to long positions near $3330, with upside targets at $3345–3350.
🔹 Short Positions:
🔰If gold rallies toward $3328 but fails to break through, and upward momentum weakens, consider light short positions. Set a stop-loss above $3335, with downside targets at $3310–3305.
🔰If the price unexpectedly breaks below the $3280 support, possibly triggering algorithmic selling, the correction may extend further toward the $3250–3260 range.
✅Currently, gold continues to show a moderately bullish trend, and the European session is expected to fluctuate within the core range of $3300–3335. Strategically, it's recommended to prioritize buying on dips, with shorts considered only on failed rallies. If upcoming U.S. data strengthens expectations for Fed rate cuts, gold could break above the $3350 threshold. Conversely, if the data is strong or geopolitical risks ease, be cautious of a potential pullback, with key defense support at $3280.
XAUUSD short from red zoneWill give gold a short a shot. It is pretty much a technical trade only. I will look to take a 200 pips out of it.
Goodluck
Gold is rising. Second starting point?Information summary:
1. The US dollar index has experienced the longest consecutive monthly decline since 2017. The weakening of the US dollar has increased the attractiveness of gold denominated in US dollars to non-US dollar holders, becoming an important support factor for gold prices.
2. Trump's continued pressure on the Federal Reserve to cut interest rates has formed a resonance effect with the weakening of the US dollar, which has jointly pushed up the short-term attractiveness of gold.
Multiple factors are intertwined, and gold has risen slightly again.
Market analysis:
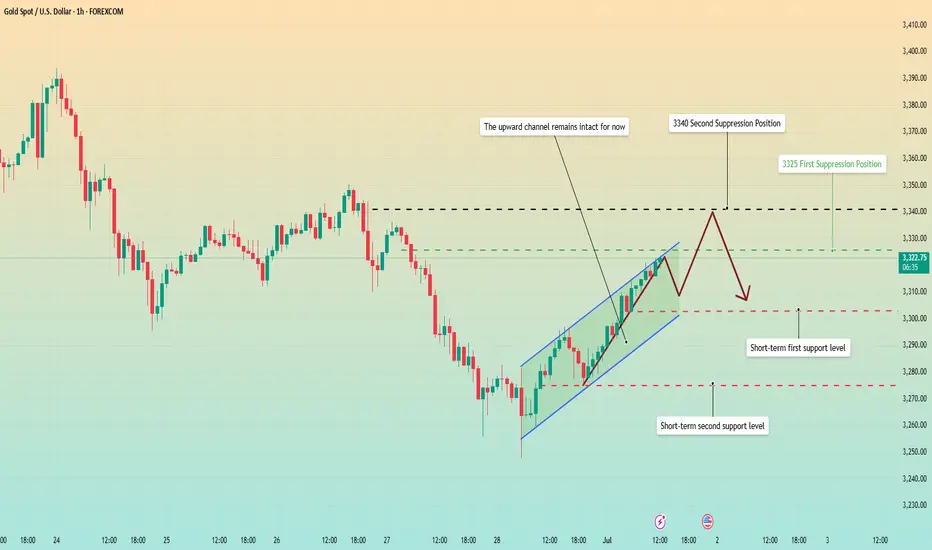
Gold bottomed out and rebounded on Monday, showing a positive closing, and above 3300. After falling sideways for 5 consecutive trading days last week, although it fell for a short time on Monday, it did not continue. In this case, whether a new high can be reached, the watershed is the 3295 line. As long as the European session breaks the high, the long position is near the starting point of 3305 in the early trading session.
At present, the main focus is on the upper resistance around 3325. It opened directly upward on Tuesday, but did not break through too much space, unless it directly broke through 3325-3330; then the next resistance is around 3340. At present, the bulls are still running at a high level. The upward trend line generated after the reversal is more obvious, and the trend line has good effectiveness.
Since the current market is in the first wave of rise, the high point has not been confirmed. Quaid believes that when the high point is clear and the price falls back to the support area, consider entering the market to go long based on the support level. Of course, aggressive trading can choose to buy around 3320 and choose a suitable high point to take profit.
Operation strategy:
Short near the rebound 3340, stop loss 3350, profit range 3310-3300
Long near the fall 3305, stop loss 3290, profit range 3320-3335