Definitive Micro-Analysis & Actionable Forecast: XAUUSDHigh-Level Strategy (Monthly/Weekly/Daily Recap)
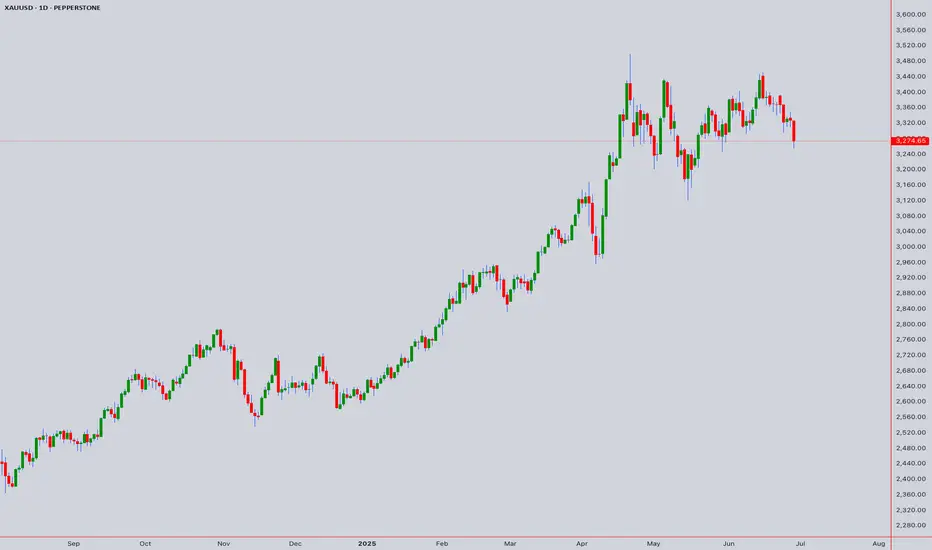
Overall Market Condition: The primary trend has shifted from Bullish to Bearish/Corrective due to the Monthly Bearish Engulfing and Weekly Three Black Crows patterns.
Immediate Tactical Bias: The Daily Bullish Harami pattern strongly indicates a pause in the downtrend and the high probability of a short-term corrective rally (a "bounce").
Our Goal: To map out the entry, targets, and invalidation levels for this anticipated bounce.
Deep Dive: The Lower Timeframes (4H, 1H, 30M, 15M, 5M)
Consolidation After the Low (4H & 1H):
Candlestick Reading : As observed, after the low was made (~2318), the price action on the 1H and 4H charts has stopped making new lows. Instead, it is building a base, characterized by a series of Dojis and Spinning Tops. This is a classic sign of indecision and absorption, where selling pressure is drying up and buyers are beginning to tentatively step in. This is the "coiling spring" phase before the bounce.
The Trigger (15M & 5M):
Candlestick Reading: On the 15M and 5M charts, we are looking for the very first sign that buyers are taking control. The ideal trigger would be a clear, small-scale Bullish Engulfing or Tweezer Bottom pattern forming at the bottom of this consolidation range. As of the last candle on the 5M chart, we see a small green candle attempting to move up, but the trigger is not yet confirmed.
The Full Storyboard: From Entry to Exit with Price Levels
For those interested in further developing their trading skills based on these types of analyses, consider exploring the mentoring program offered by Shunya Trade.
I welcome your feedback on this analysis, as it will inform and enhance my future work.
Regards,
Shunya Trade
⚠️ Disclaimer: This post is educational content and does not constitute investment advice, financial advice, or trading recommendations. The views expressed here are based on technical analysis and are shared solely for informational purposes. The stock market is subject to risks, including capital loss, and readers should exercise due diligence before investing. We do not take responsibility for decisions made based on this content. Consult a certified financial advisor for personalized guidance.
XAUUSDK trade ideas
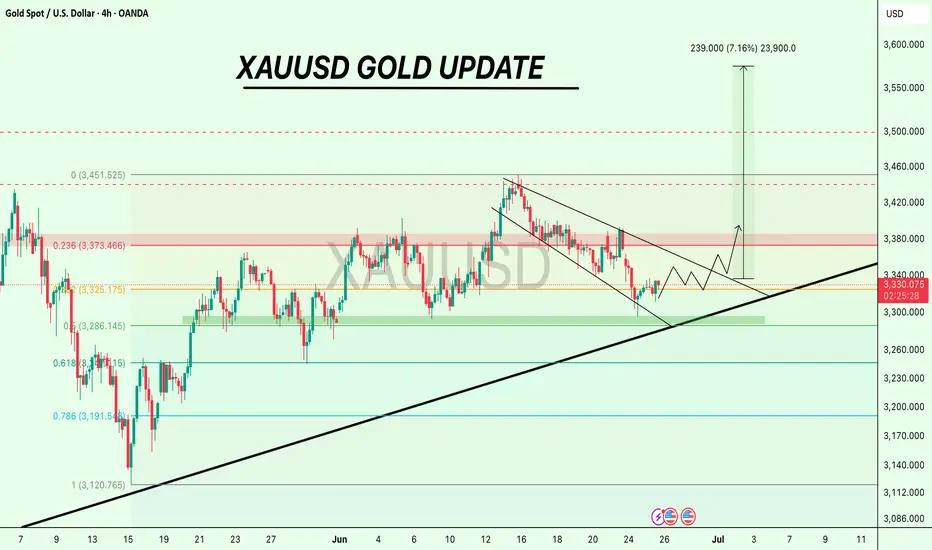
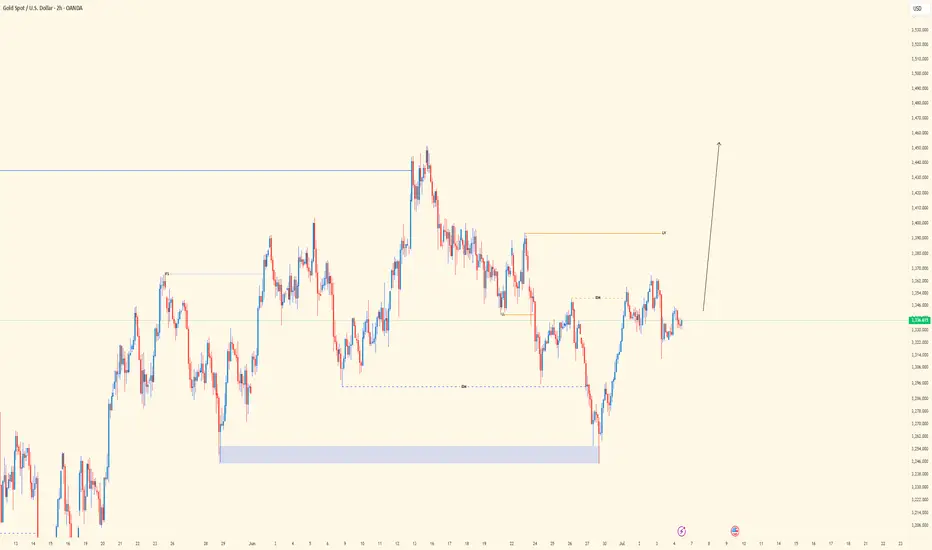
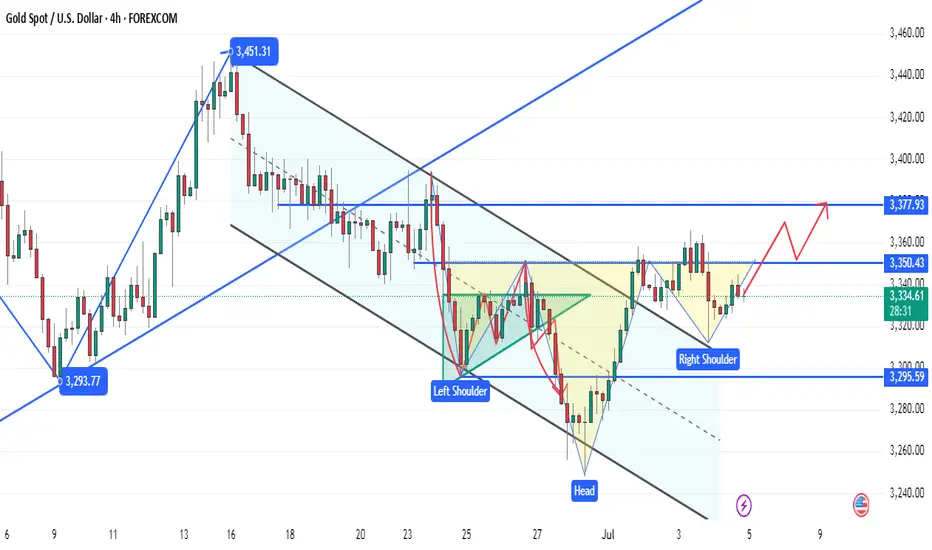
$XAUUSD Holding Key Support, Bounce Incoming?Gold is still holding the key support zone around $3,285–$3,290, which aligns closely with the 0.5 Fib retracement level.
As long as this area holds, we could see a push toward $3,320, and if momentum follows through, $3,373 (Fib 0.236) is the next key level to watch.
The structure looks solid, and buyers are showing interest.
Keep an eye on a breakout above the descending trendline. 👀
DYOR, NFA
#XAUUSD #GOLD
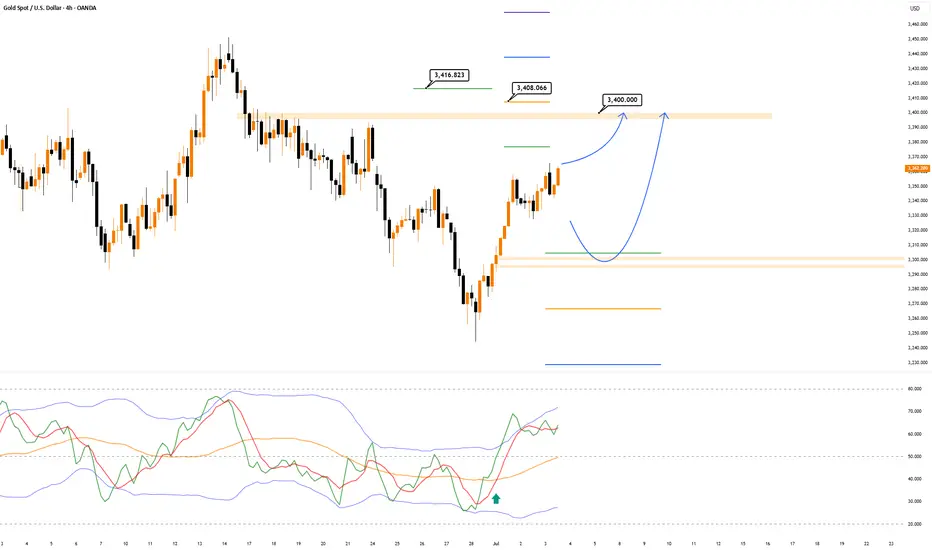
XAUUSD Forming Bullish Continuation Patternhi traders,
let's have a look at Gold on 3D time frame.
✅ Technical Outlook:
Uptrend Still Intact
Price action remains firmly within a higher high, higher low structure, confirming that Gold is still in an active uptrend.
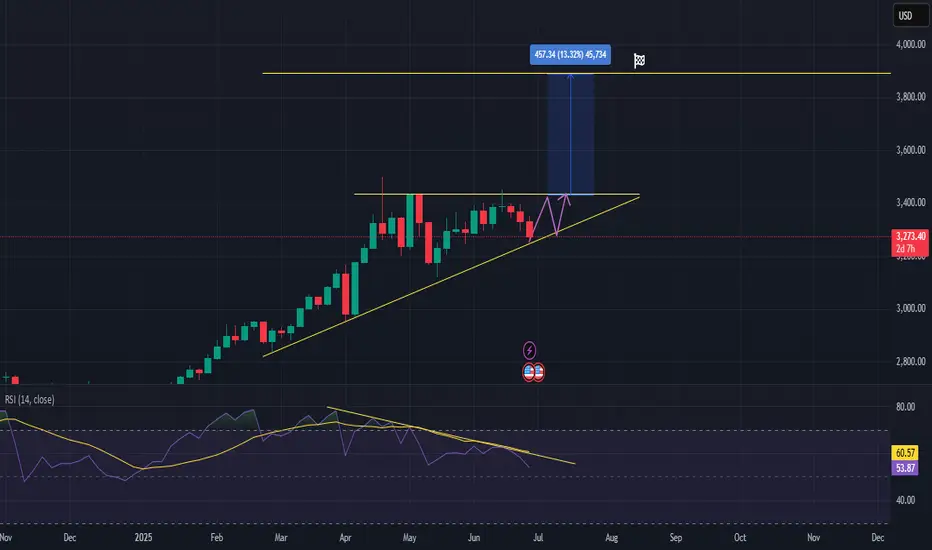
* We can observe the Ascending Triangle Formation.
An ascending triangle has formed, with the price consistently finding support on a rising trendline while pressing against the horizontal resistance around $3,430.
This pattern typically acts as a bullish continuation, especially within strong trends.
Potential Breakout Target
If XAUUSD breaks above the horizontal resistance, the measured move (height of the triangle) points to a potential upside of ~13.32%, targeting the $3,880–3,900 zone.
RSI Observations
The RSI is consolidating just above 50 and remains in bullish territory. A breakout above the RSI trendline would further support bullish momentum.
📌 Trade Scenario (Plan A – Bullish Breakout):
Entry: Upon breakout and daily close above ~$3,430
Target: ~$3,880
Support Trendline: Acting as dynamic support
📌 Alternate Scenario (Plan B – Retest):
Price may retest the ascending trendline support before attempting a breakout. This would offer a lower-risk entry opportunity with tighter invalidation.
🧠 Summary:
Gold remains in a strong uptrend, and the formation of an ascending triangle suggests a likely continuation to the upside. Watch for a breakout confirmation above the horizontal resistance for a potential high-probability long setup.
GOLD (XAUUSD) | 4H OB Respected | waiting for 30m LH BreakPair: XAUUSD
Bias: Bullish
Timeframes: 4H, 30M, LTFs
• 4H showing strong bullish structure — OB respected cleanly, confirming higher timeframe demand.
• On 30M, now patiently waiting for the break of LH to confirm continued bullish intent. After that, looking for a sweep off a fresh internal OB for LTF entry confirmation.
🔹 Entry: After LH break + sweep + CHoCH on LTFs
🔹 Entry Zone: Within fresh internal OB post-LH break
🔹 Target: Near structure highs
Mindset: Let the structure speak. No guesswork — wait for your levels, your break, and your confirmation. Precision over prediction.
Bless Trading!
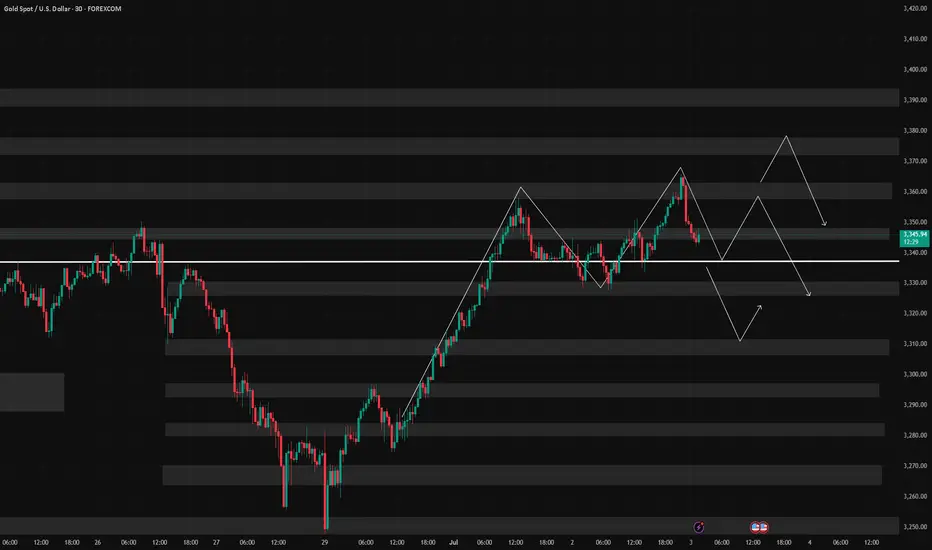
Gold Daily Review
Dear traders, the sell-off last night directly brought the bulls back to their original form. The closing price of 3325 made most of the gains accumulated hard this week spit back. To me, this wave of market is a typical "data killing". The June non-agricultural data came out halfway, and the employment data was so strong that even the old foxes on Wall Street were surprised. Now the market's bet on the September rate cut has dropped directly from 70% to less than 50%. How can gold, which is "interest rate sensitive", withstand such a critical blow?
From a technical perspective, the negative line of the daily line is indeed ugly, but I think the bulls should not die. Look at the 4-hour chart. The Bollinger Bands have begun to "tighten their belts", and the 3310-3365 box is clearly drawn. Today is Independence Day. The US market closed early. Those Wall Street wolves probably ran to the Hamptons for a pool party. We are likely to play a "lying flat" market in the Asian and European markets. I calculated with my fingers that the 40 USD range of 3310-3350 is enough for us to toss around. Remember - short orders at the upper edge of 3345 should be as fast, accurate and ruthless as "whack-a-mole", and long orders at the lower edge of 3325 should be as patient as a fisherman!
The news is now "ice and fire". On the one hand, Trump's "big and beautiful" tax cut bill has just passed the test successfully. After this shot of booster, the US dollar and US bond yields are soaring like stimulants; on the other hand, drones in the Middle East are causing trouble again, and the small flame of geopolitical risk has not been extinguished. If you ask me, gold is like a "schizophrenic patient" now, jumping back and forth between inflation narratives and risk aversion sentiment.
Specific strategy:
① Directly "operate from a height" near the rebound of 3345, set the stop loss at 3352, and the target position is the 3330-3320 range. Remember that this position is the "previous high neckline position" and the probability of breaking is not high.
② You can "lighten your position and fish" when it falls back to 3325. The defensive position of 3315 must be strictly guarded, and the target position is the pressure zone of 3335-3345
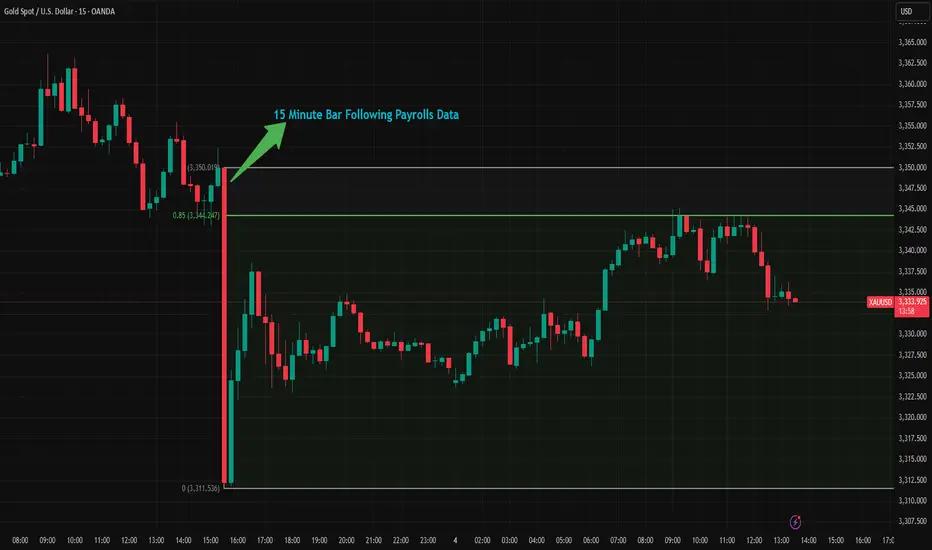
Why is the 147k Beat in Payrolls Data Not as Strong as it Seems?Yesterday’s U.S. nonfarm payrolls report came in above expectations, but a closer look at the details reveals a less encouraging picture. Despite the headline beat, market reactions quickly faded. For instance, gold initially dropped from 3350 to 3311 in the first 15 minutes after the release but has since recovered more than 75% of that decline. So why is the June jobs report not as strong as it first appeared?
According to the BLS report, nonfarm payrolls increased by 147k in June, surpassing the consensus estimate of 106k. However, when breaking down the numbers, private payrolls rose by just 74k, well below expectations. Most of the gains came from government and healthcare hiring. Government jobs accounted for 73k new positions, and 63k of those came from the education sector alone.
Some analysts suggest the high net hiring in education may be due more to a lack of firings, a consequence of a tight labor market in that sector. Meanwhile, the 59k increase in healthcare jobs is part of a long-term trend. Over the past two years, the U.S. has added an average of 70k healthcare jobs per month. This growth is largely driven by the needs of an aging population and reduced payrolls during and after the pandemic that have yet to fully recover.
If you exclude government and healthcare hiring, U.S. payrolls increased by just 15k in June.
The unemployment rate also came in better than expected, falling to 4.1% from 4.2%, while markets had anticipated a rise to 4.3%. However, this decline was driven by a drop in the labor force participation rate, which fell to 62.3% from 62.6% in just two months , a worrying sign that fewer people are actively participating in the labor market.
In the first 15 minutes after the data came, gold fell to 3311 from 3350. In the following 18 hours, gold recaptures 85% of the loss. Gold is still over the broken bearish trendline in 1-H timeframe. With tariff deadline in 9th July and incoming 10-12 tariff letters coming in from Trump in the next few days, gold could have potential to go upwards with market understands this jobs data is not strong as it seems.
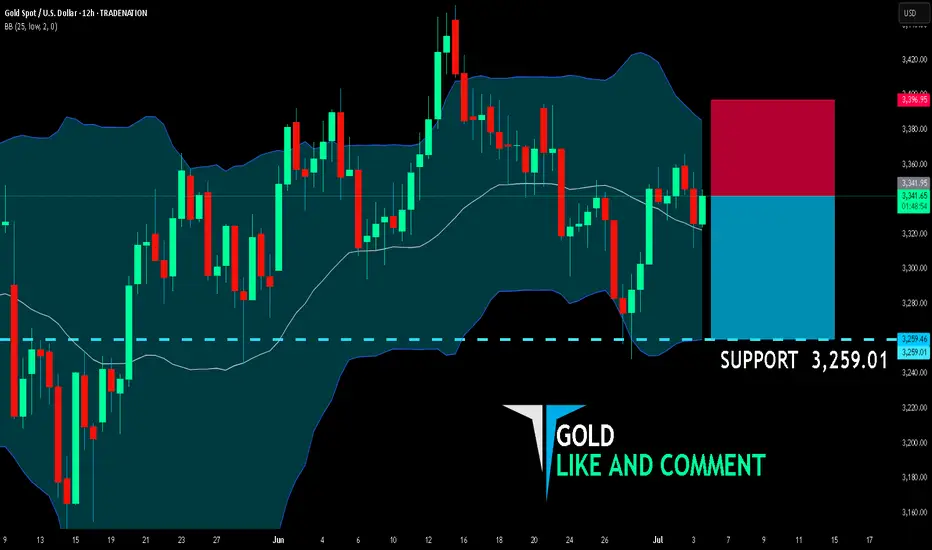
GOLD BEARS ARE STRONG HERE|SHORT
GOLD SIGNAL
Trade Direction: short
Entry Level: 3,341.95
Target Level: 3,259.01
Stop Loss: 3,396.95
RISK PROFILE
Risk level: medium
Suggested risk: 1%
Timeframe: 12h
Disclosure: I am part of Trade Nation's Influencer program and receive a monthly fee for using their TradingView charts in my analysis.
✅LIKE AND COMMENT MY IDEAS✅
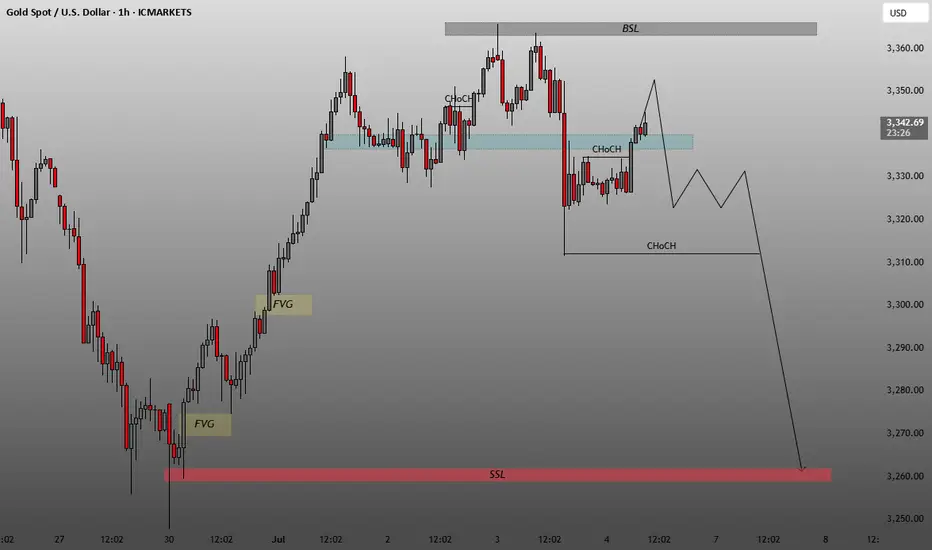
Indicates the target for potential bearish liquidity grab.BSL (Buy-Side Liquidity):
Marked near $3,360 at the top (gray zone).
Represents an area where buy stops may be resting above recent highs.
SSL (Sell-Side Liquidity):
Marked around $3,260 at the bottom (red zone).
Indicates the target for potential bearish liquidity grab.
FVG (Fair Value Gap):
Highlighted in yellow near $3,270–$3,280.
Unfilled imbalance that may attract price.
ChoCH (Change of Character):
Two ChoCH labels are marked:
One minor bullish ChoCH around the $3,328 area indicating a short-term shift in structure.
One bearish ChoCH below $3,310, suggesting a possible return to bearish bias if broken.
Blue Supply Zone:
An area of previous supply or resistance where price may reverse.
📉
Projected Price Path:
Initial move up into the blue supply zone, possibly to induce buyers or sweep short-term highs.
Followed by a strong bearish rejection, breaking below the lower ChoCH level (~$3,310).
A drop is anticipated all the way to the SSL zone (~$3,260), possibly filling the FVG on the way.
🧠 Summary:
This chart implies a smart money bearish setup:
Short-term liquidity sweep to the upside.
Break of structure (ChoCH) to confirm reversal.
Bearish continuation targeting:
Fair Value Gap (FVG) → ~$3,270s
Sell-Side Liquidity (SSL) → ~$3,260
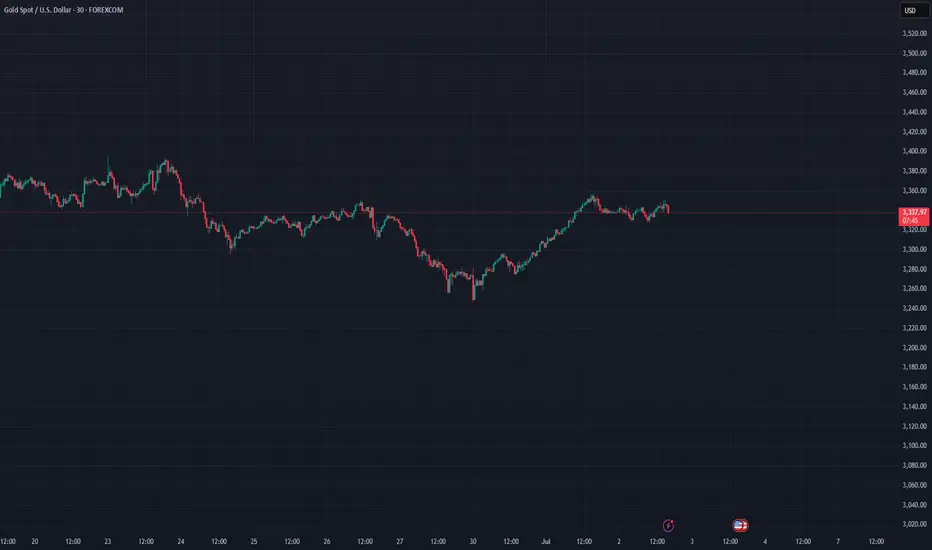
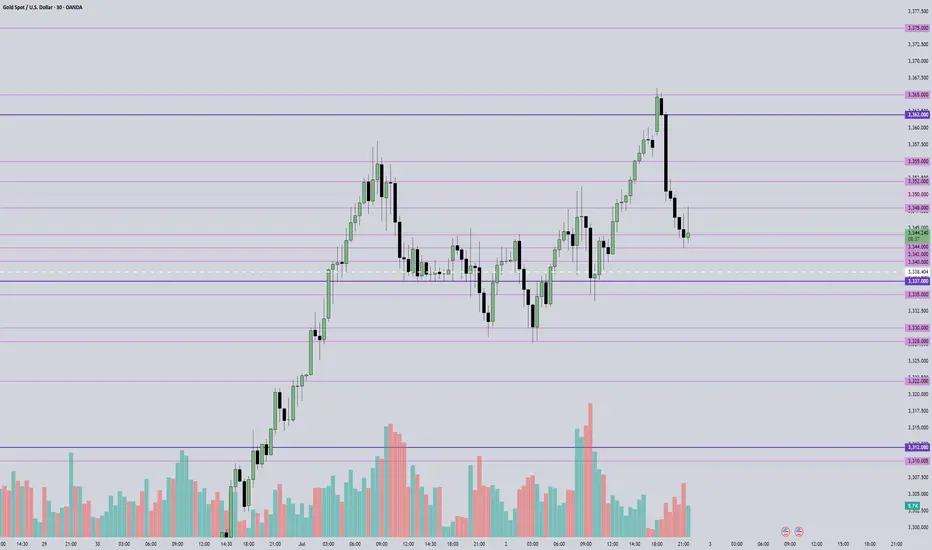
7.4 Non-farm payrolls exploded, and expectations for the Fed’s rOn Thursday, as the strong US employment data dispelled the market's expectations of the Fed's recent rate cut, the US dollar index rose sharply before the US market, returned to above the 97 mark, and once rose to an intraday high of 97.42.
Spot gold fell sharply, once falling to $3311 during the session, a drop of more than $50 from the intraday high, and then recovered some of its losses and remained near 3330 for consolidation.
The current upper suppression position of the daily line is almost here at 3350, and the lower support is located at 3320-25.
So if it is maintained in the range of consolidation, it is likely to be rectified at 3320-50.
Secondly, from the hourly chart:
It can be seen from the trend of 3247 to 3365.
The Fibonacci 618 position is exactly here at 3320.
Although the lowest point last night was pierced to around 3311, it can be seen that the entity still closed above 3320.
As long as 3320 cannot be broken, the best case scenario is to maintain it at 3320-50 for consolidation. If not, once 3350 is broken, the high point of 3365 will definitely not be able to be maintained.
Therefore, for today's operation, try to maintain the high-selling and low-buying range of 3320-50.
Gold Latest Market Trend AnalysisThe data released by the U.S. Bureau of Labor Statistics showed that the U.S. seasonally adjusted non-farm payroll employment in June was 147,000, with the consensus forecast at 110,000. The previous value was revised up from 139,000 to 144,000. The annual rate of average hourly earnings in June stood at 3.7%, below the expected 3.90%, while the prior figure was revised down from 3.90% to 3.8%.
Following the release of the non-farm payroll report, interest rate futures traders abandoned their bets on a Federal Reserve rate cut in July. Currently, the market-implied probability of a Fed rate cut in September is approximately 80%, down from 98% prior to the report. On Thursday, gold exhibited a seesaw pattern, surging initially to hit resistance near $3,365 per ounce before retreating. During the U.S. session, it broke below support levels and further declined to hover around $3,311, where it staged a rebound. Gold remains in a high-range consolidation under selling pressure.
you are currently struggling with losses,or are unsure which of the numerous trading strategies to follow,You have the option to join our VIP program. I will assist you and provide you with accurate trading signals, enabling you to navigate the financial markets with greater confidence and potentially achieve optimal trading results.
Trading Strategy:
sell@3350-3355
TP:3320-3325
Gold Ready to Explode Ahead of NFP and Trump’s “Super Bill”?Gold Ready to Explode Ahead of NFP and Trump’s “Super Bill”? | Global Macro Focus
🌍 MACRO UPDATE – What the World is Watching:
Gold continues its bullish trajectory as the USD weakens sharply following last night’s disappointing ADP jobs report (-33K vs expected +99K). This soft labour data has fueled further speculation that the Fed could begin rate cuts as early as September, with a 90% probability now being priced in.
In the political arena, Donald Trump’s recent statement that House Republicans are aligned to push forward a so-called “Super Bill” has triggered fresh uncertainty around US fiscal policy. This could elevate safe-haven demand for gold, especially if it leads to increased tensions over debt ceilings or government spending.
With the US Non-Farm Payrolls (NFP) due later today and the UK and US markets heading into a long weekend, traders should brace for heightened volatility and liquidity gaps.
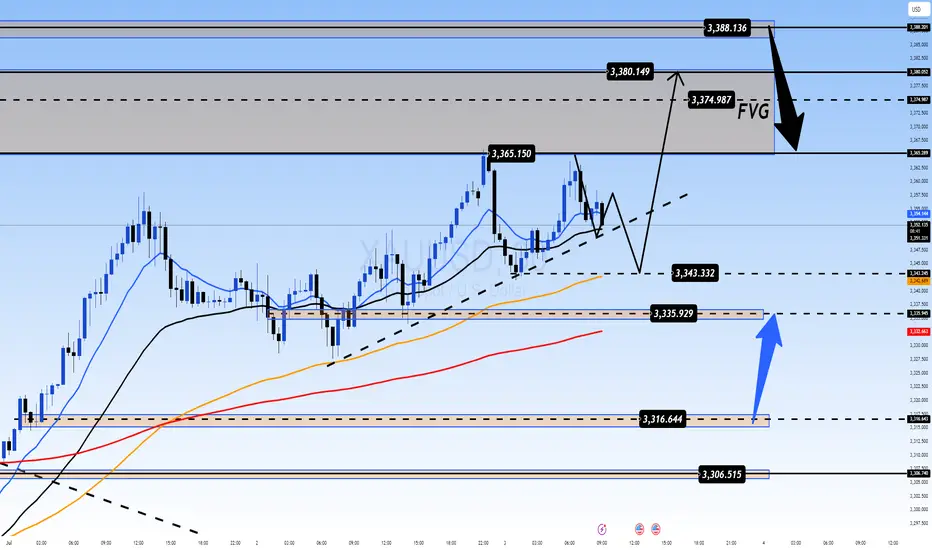
📈 TECHNICAL OUTLOOK – What the Charts Are Saying:
Overall Trend: Bullish structure remains intact as gold breaks and holds above 3365.
EMA Setup: Price trades above EMA 13/34/89/200 – signaling strong upside momentum.
Fair Value Gap (FVG): 3374 – 3388 area remains an unfilled FVG zone; possible magnet for short-term price action.
Key Resistance Levels: 3365, 3374, 3380, 3388, 3393
Key Support Levels: 3343, 3335, 3325, 3316, 3304
Trendline & Structure: The ascending trendline from 3316 remains unbroken, providing a potential bounce point if price corrects.
🎯 TRADE SETUPS – Strategic Zones to Watch:
🔵 Buy (Short-Term Scalp):
Entry: 3335 – 3333
SL: 3329
TP: 3340 → 3350 → 3360 → 3370
🟢 Buy Zone (Swing Perspective):
Entry: 3316 – 3314
SL: 3310
TP: 3320 → 3336 → 3350 → 3360
🔴 Sell Scalp (Reversal Zone)
Entry: 3374 – 3376
SL: 3380
TP: 3370 → 3360 → 3350
⚠️ Sell Zone (High-Risk Rejection):
Entry: 3388 – 3390
SL: 3394
TP: 3380 → 3370 → 3360
🔎 NOTE FOR GLOBAL TRADERS:
With UK markets partially closed and US session shortened ahead of the Independence Day holiday, liquidity may be thin and volatility could spike unexpectedly. Always place stop-loss and avoid emotional entries near key resistance.
💬 Do you believe gold can break and close above the FVG zone (3388) before the weekend volatility hits full throttle? Let’s discuss.
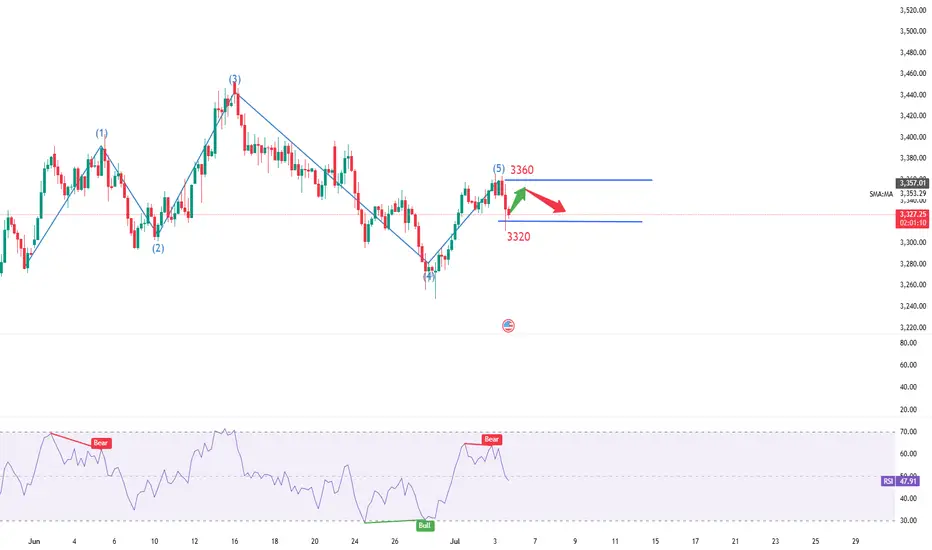
7/3: Focus on Short Positions, Watch Support Near 3320Good morning, everyone!
Yesterday, gold tested support near 3328 but failed to break below it effectively. The price then rebounded toward the 3350 level. At today’s open, gold briefly extended to around 3365 before pulling back.
Technically:
On the daily (1D) chart, the price remains capped by the MA20, with no confirmed breakout yet.
Support levels below are relatively dense, and moving averages are increasingly converging, suggesting a breakout in either direction is approaching.
Key intraday support lies in the 3321–3316 zone.
On the 2-hour chart, we are seeing the first signs of a bearish divergence, indicating a need for technical correction. Much like Tuesday’s setup, there are two possible scenarios:
If 3342–3334 holds, the price may extend slightly higher, intensifying divergence before pulling back;
If 3337 breaks, we could see a drop toward 3320, where correction would occur through a direct decline.
From a fundamental perspective, several high-impact U.S. data releases are scheduled for the New York session, which may increase volatility and make trading more challenging.
Trading suggestion:
For most traders, the safest approach is to wait for data to be released, then look for oversold rebounds or overbought corrections following sharp market reactions.
This style requires patience and strong risk control—avoid being overly aggressive or greedy, as such behavior can easily lead to trapped positions or even liquidation.
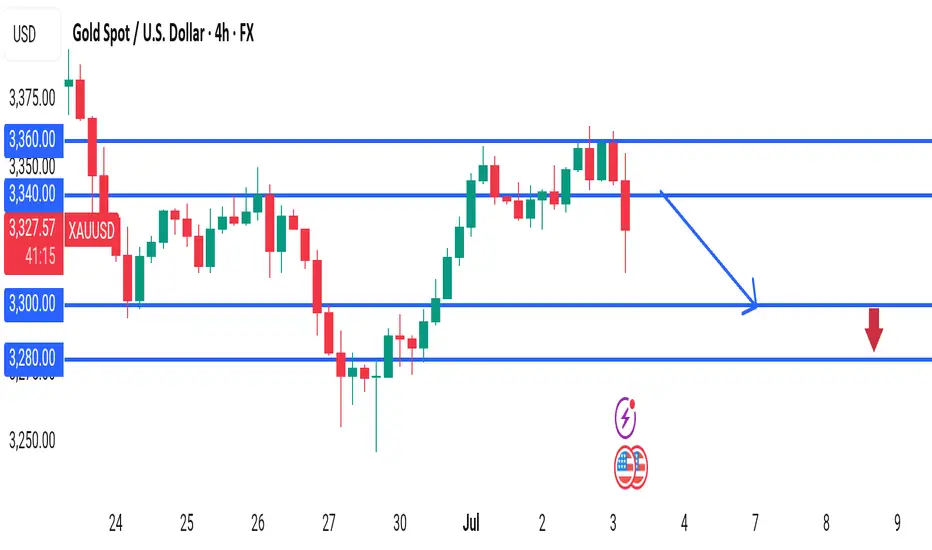
GOLD XAUUSD 4H – Smart Money SELL Opportunity
Gold (XAUUSD) is currently trading around 3,328.96, showing signs of exhaustion near previous highs. Price failed to break above 3,355 zone, indicating liquidity build-up and potential for Smart Money manipulation.
This is a SELL-ONLY setup — waiting for price to react from premium levels to short the market.
---
SELL Trade Plan:
🔻 Sell Limit: 3,340.00 - 3,355.00
🛑 Stop Loss: 3,360.00 (Above liquidity grab zone)
🎯 Take Profit 1: 3,300.00
🎯 Take Profit 2: 3,280.00
---
Why Sell?
✅ Price is approaching major distribution zone.
✅ Liquidity resting above 3,340 - 3,355 likely to attract manipulation wicks.
✅ After manipulation, Smart Money expected to drive price lower.
No buy confirmation. Structure favors sellers — trade what you see, not what you feel.
---
Summary:
Bias: SELL ONLY 🔥
Setup: Wait for price to tap 3,340 - 3,355, rejection confirms entry.
Risk Management: Mandatory — Protect your capital.
---
💬 Drop your thoughts below — are you catching this sell move?
#Gold #XAUUSD #Forex #SmartMoney #TradingView #LiquidityHunt #SellSetup #FrankFx14
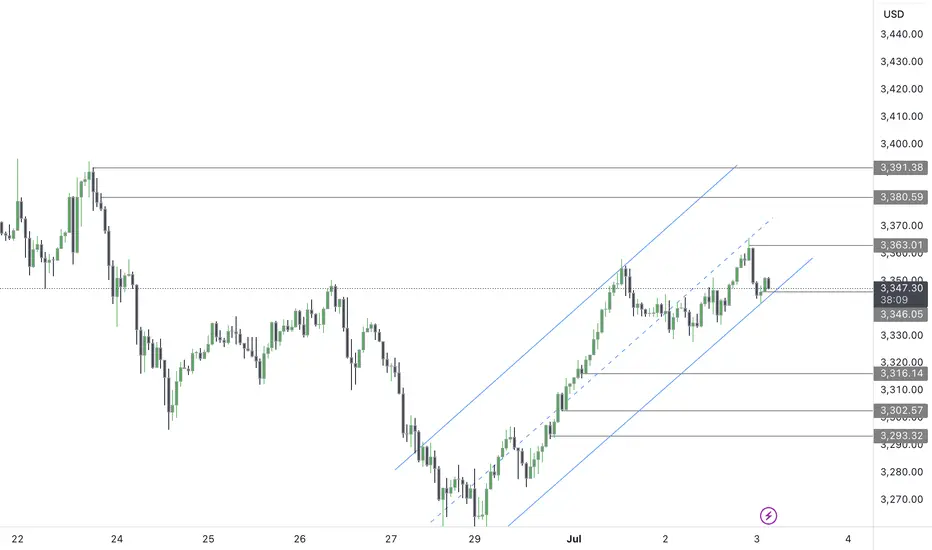
GOLD BULLS We saw gold impose a strong bullish strength since the open of this new week, and even at the beginning of the new month (JULY).
Based on this analysis, this bullish momentum has structured in a bullish trend channel which has been shown, we still have more top liquidity to mitigate as we have made a bearish retracement for a continued bullish rally to 3360's, 3380's and 3400's.
Further updates would be given as the market gains momentum
Trading Game of the Day 2- JULY-2025Trading Plan :-
1-BSL and SSL
2-MSS and CISD
3-iFVG and FVG
4-probabilistic mindset
Thank You

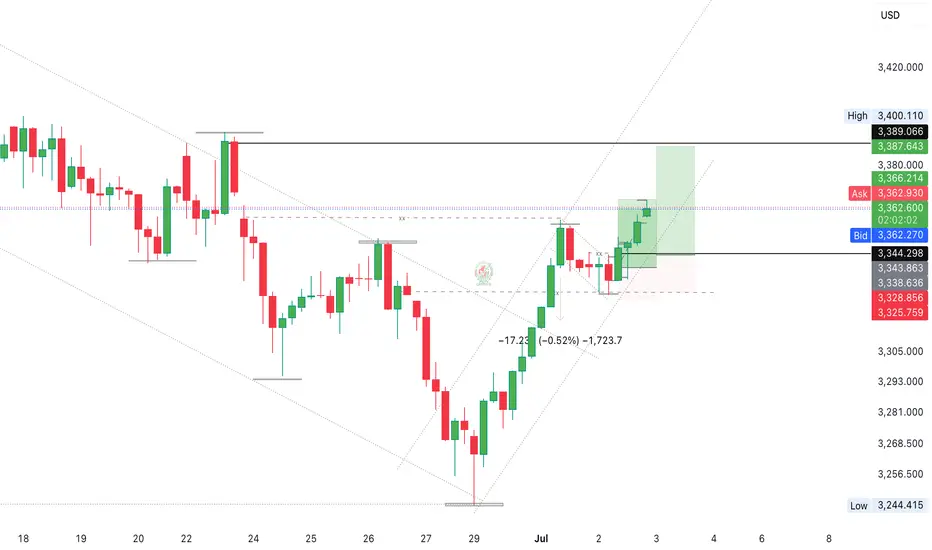
Gold Market Eyes 3380s After 3350s mitigated Gold market currently priced in the 3350s, with the daily candle formation suggesting an intent to mitigate the previous day's open. This setup may trigger a full bullish sentiment, potentially driving price action toward the 3380s. follow for more Insights , comment and boost idea
XAU/USD GOLD Short 4:1XAU/USD GOLD Short 4:1, last idea was correct closed in profits, I will take two positions here.
1. 1:1 TP
2. 4:1 TP
Enjoy!
Gold's price is expected to go up✅ Gold's price is expected to go up, possibly reaching $3400 or more. This could happen after a small pause or a direct climb. A technical signal also supports this upward trend.
❌ However, be careful! The upcoming U.S. jobs report (NFP) can drastically change gold's direction. It's best to wait until the market reacts to that news before making new predictions.
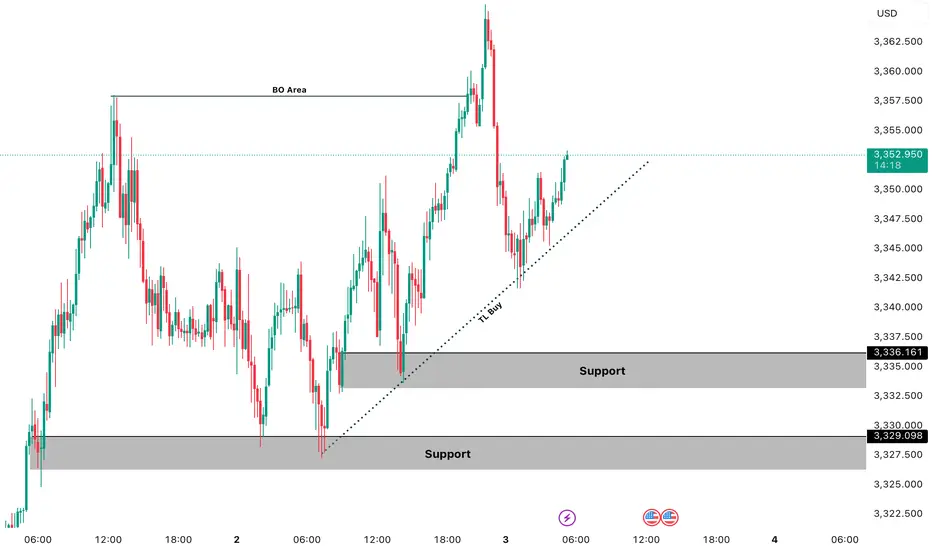
GOLD LOND TRADE IDEA We Are Looking Gold Bullish Today ,
TL BUY AREA : 3347 💡
1ST SUPPORT BUY : 3336, 3333 💡
2ND SUPPORT BUY: 3329, 3325 💡
If Gold Break The Trendline Then We See Gold Bearish Price Then We Buy At Support The Target Will Be ATH Liquidity 3390
If Gold Breaks Also 2nd Support Then Continue Bearish Trend Then We Trade Sell On a2nd Support Break
Manage Trades Properly Dont Forget To Follow Us For More Free Trades
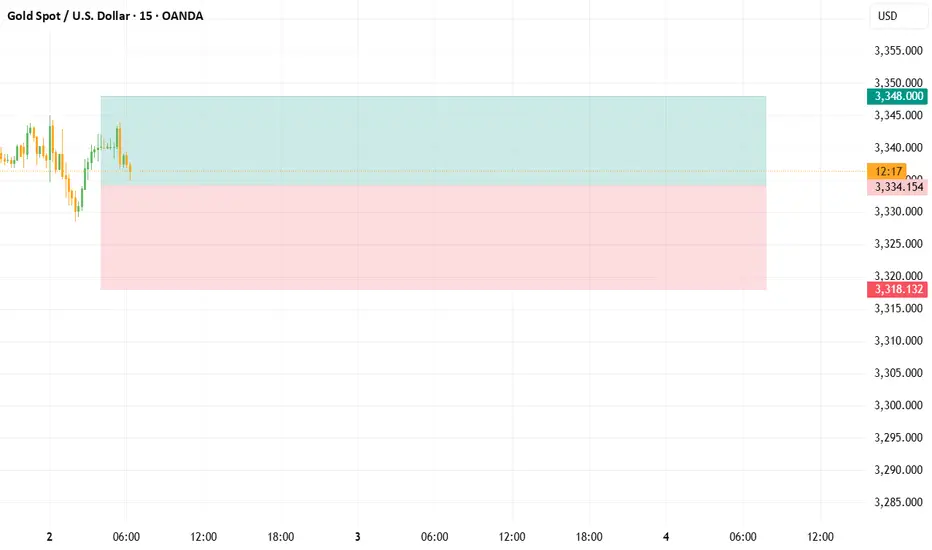
XAUUSD No chasing long or early manual entriesBUY LIMIT - XAUUSD @ 3328.00
TP: 3348.00
SL: 3320.00
Do not increase positions, do not carry orders, not backhanded
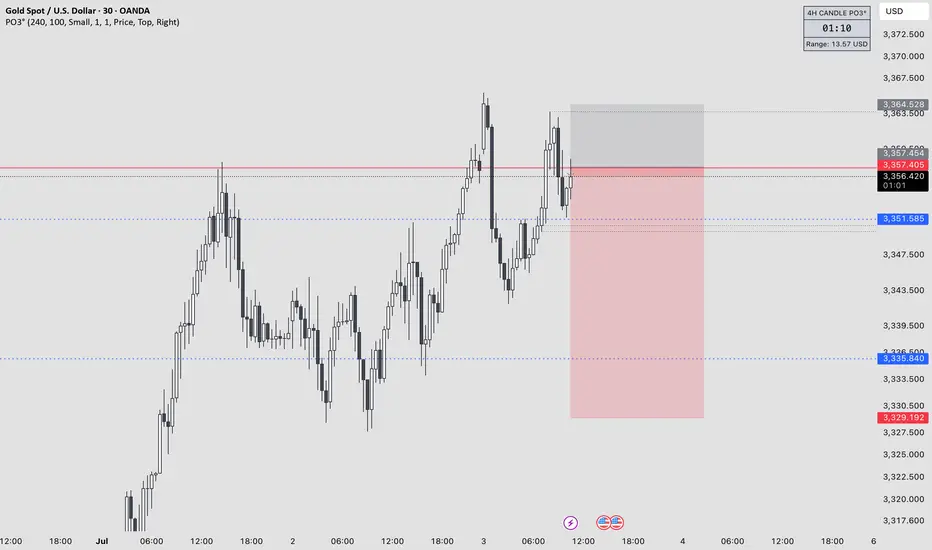
July 3, 2025 - XAUUSD GOLD Analysis and Potential OpportunityAnalysis:
Today, the NFP report will be released during the US session.
Before Asian trading even began, the market saw a sharp downward move.
It’s possible that both the Asian and European sessions will remain range-bound until the data release provides a clear direction.
Until then, treat 3342–3365 as the primary range and focus on selling near resistance and buying near support within this zone.
🔍 Key Levels to Watch:
• 3375 – Resistance
• 3365 – Resistance
• 3358 – Resistance
• 3352 – Resistance
• 3342 – Important support
• 3337 – Support
• 3328 – Key support
• 3310–3312 – Intraday key support zone
• 3300 – Psychological level
📈 Intraday Strategy:
• SELL if price breaks below 3342 → target 3337, then 3333, 3328, 3322
• BUY if price holds above 3348 → target 3350, then 3352, 3355, 3358
👉 If you want to know how I time entries and set stop-losses, hit the like button so I know there’s interest — I may publish a detailed post by the weekend if support continues!
Disclaimer: This is my personal opinion, not financial advice. Always trade with caution and manage your risk.
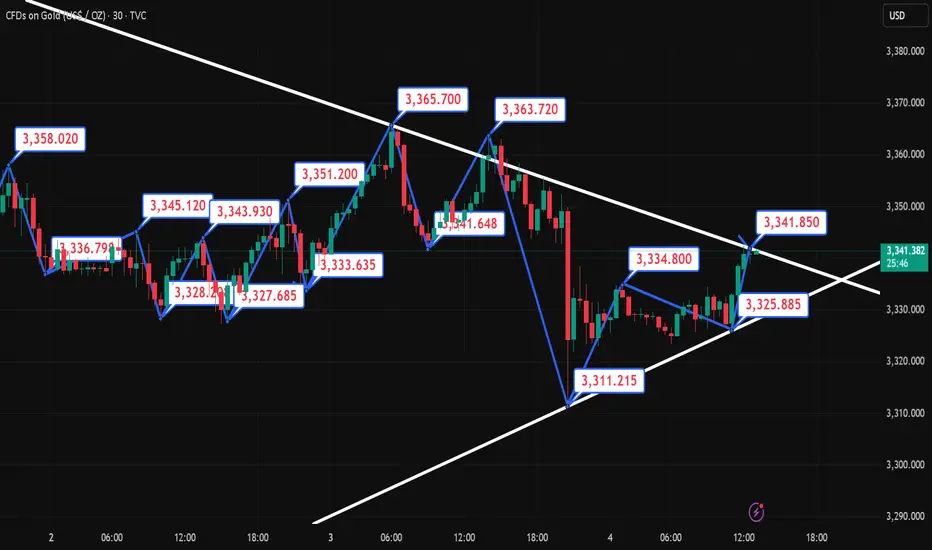
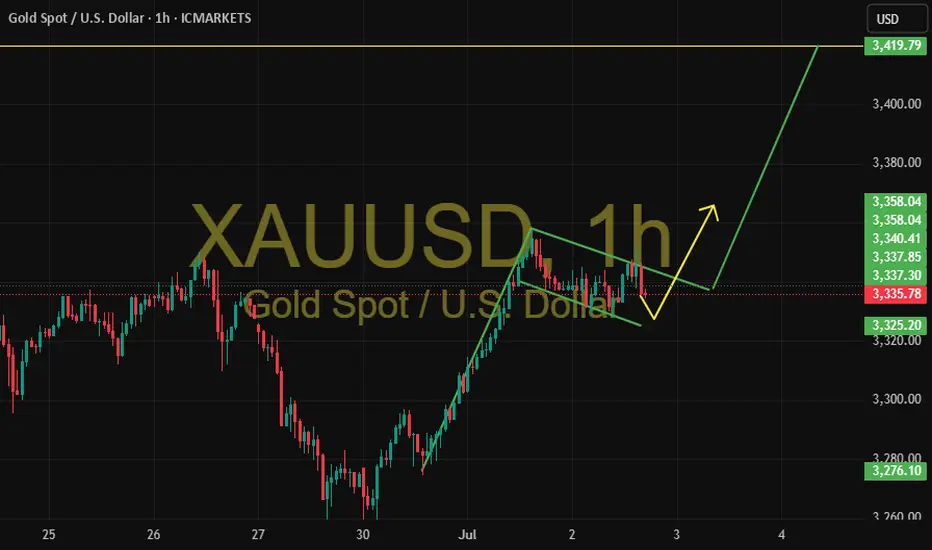
XAUUSD – Bullish Flag Pattern on the Hourly Chart📌 XAUUSD – Bullish Flag Pattern on the Hourly Chart
Gold completed a strong upward move last week and then entered a corrective phase forming a classic bullish flag pattern with a descending channel.
🟡 Currently, price is consolidating within the pattern boundaries. As long as it holds the support area around 3,325, the favored scenario is a continuation of the bullish trend upon an upward breakout.
🎯 Technical target after breakout: 3,419, based on the flagpole height.
📉 In case of a downside break, the scenario will be reassessed.
🔍 This analysis is for educational purposes only and not a trading recommendation.
Report - 2 jully, 2025US Fiscal Policy & Political Outlook:
Donald Trump’s sweeping tax and spending bill — dubbed the “big, beautiful bill” — took a major step forward with its razor-thin Senate passage (51-50), thanks to Vice President JD Vance’s tie-breaking vote. The bill extends Trump’s first-term tax cuts, slashes healthcare and social welfare spending, and increases military and border security budgets. It also proposes eliminating taxes on tips and overtime, aiming to galvanize Trump’s core voter base.
While the bill now moves to the House, it faces strong opposition even among Republicans. Fiscal hawks are deeply concerned about the bill’s projected $3.3 trillion addition to the deficit over the next decade (according to the Congressional Budget Office). Moderates object to Medicaid cuts, which threaten care for low-income Americans. The House vote will be crucial; if it passes before July 4 as Trump desires, it will mark a major policy victory — but at significant fiscal cost.
From a market perspective, this bill’s passage heightens concerns over US debt sustainability, already a major factor in the dollar’s ongoing weakness. Bond investors are bracing for increased Treasury issuance, adding upward pressure to yields despite recent dovish signals from the Fed.
Global Trade Dynamics & Tariff Strategy:
Simultaneously, the White House is pursuing narrower, phased trade deals as Trump’s July 9 tariff deadline looms. While originally promising 90 trade agreements in 90 days, officials are now prioritizing small, targeted “agreements in principle” to avoid immediate trade shocks.
Countries agreeing to narrower deals will escape the harshest “reciprocal” tariffs, maintaining a baseline 10% levy while negotiations continue. This two-track approach reflects both Trump's negotiating style and the complexity of global supply chains.
Meanwhile, the EU is hardening its stance, demanding immediate tariff reductions and threatening retaliatory measures on €95 billion of US goods if talks fail. Japan, on the other hand, has stood firm on protecting its rice farmers, refusing to sacrifice domestic agricultural interests for tariff relief.
These developments underscore the fragility of global trade flows. Investors should monitor sectors sensitive to tariffs (automotive, electronics, agricultural exports), as policy swings could impact earnings forecasts and supply chain costs.
Monetary Policy & Central Bank Positioning:
On monetary policy, Fed Chair Jay Powell hinted that a July rate cut is “not off the table,” softening his earlier stance. This flexibility follows Trump’s intensifying pressure for lower rates. Powell emphasized that decisions would remain “data-dependent,” highlighting strong jobs data and manufacturing strength as key considerations.
Markets reacted by trimming near-term rate cut bets, with two-year Treasury yields rising. Nonetheless, longer-term expectations still price in multiple cuts by end-2026, supporting a softer dollar and equity gains in large US multinationals.
In Europe, ECB policymaker Klaas Knot expressed surprise at the limited economic fallout from aggressive rate hikes, describing the current 2% policy rate as “neutral.” This sets the stage for potential stability in eurozone rates, with the ECB maintaining a vigilant eye on energy prices and trade war risks.
Switzerland & EU Relations: Brexit Echoes:
Switzerland’s agreement to secure continued access to the EU single market illustrates the tension between sovereignty and economic integration. The new framework would require Bern to adopt EU rules dynamically and contribute €375 million annually to the EU budget — sparking strong domestic debate reminiscent of Brexit tensions.
Although offering improved market access (e.g., rejoining Horizon Europe and Erasmus), the deal weakens Switzerland’s direct democracy tradition by mandating rule adoption without a formal vote. The referendum scheduled by 2027 will be pivotal, with risks of economic isolation if rejected.
For investors, stability in Swiss-EU ties is critical for sectors such as finance, pharmaceuticals, and industrial exports. A breakdown could disrupt supply chains and reduce Swiss competitiveness.
China & Hong Kong Equity Divergence:
Hong Kong’s equity market (+20% YTD) is decisively outpacing mainland China’s flat performance. The rally is fueled by flows into tech giants like Tencent and Alibaba, while A-shares lag due to weak consumer sentiment, deflationary pressures, and property market struggles.
Mainland retail investors — who dominate A-share turnover — remain cautious amid falling home prices and tepid stimulus measures. Beijing’s conservative policy approach, possibly influenced by US trade tensions, is delaying more forceful intervention.
For global investors, Hong Kong presents near-term upside due to its tech focus and valuation attractiveness, but mainland exposure demands caution until broader economic stimulus materializes.
Bond Markets & Yield Dynamics:
Gilt markets rallied after Bank of England Governor Andrew Bailey suggested potential slowing of gilt sales (quantitative tightening), easing supply pressure. Similarly, US Treasury Secretary Scott Bessent’s comments on restraining long-term debt issuance supported a rally in US Treasuries, with 30-year yields dipping to two-month lows before rebounding.
Global long-duration bonds remain volatile, driven by fiscal policy risks (like Trump’s tax bill) and evolving central bank guidance. Investors should remain tactical, using duration exposure as a hedge but preparing for abrupt shifts in issuance strategy or inflation surprises.
Health & Science Innovation:
On the science front, a landmark Nature Genetics study highlighted stark differences in how cancer drugs damage healthy blood cells genetically. These findings could pave the way for more personalized chemotherapy, with fewer long-term side effects, especially in children.
Such innovations support the thesis of accelerating healthcare sector breakthroughs, reinforcing bullish sentiment for biotech and specialized pharma companies.
Market overview:
US equities extended gains, with the S&P 500 reaching new highs, while European stocks lagged amid trade war uncertainty. Gold rose above $3,330/oz on renewed safe-haven demand, while Brent crude held around $67/bbl after Middle East tensions eased.