THE KOG REPORT - UpdateEnd of day update from us here at KOG:
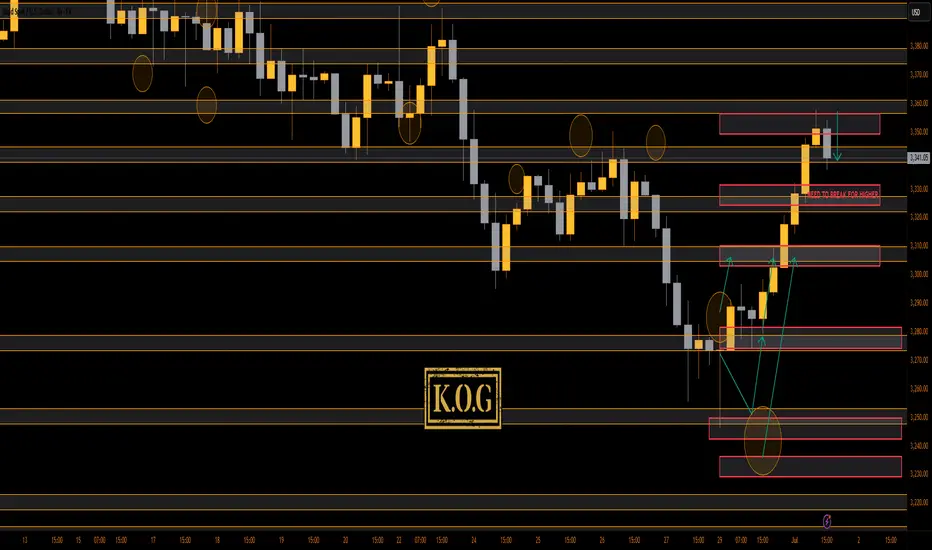
Not a bad start to the week with the path working well, we got the swoop we wanted and the opportunity for the long presented itself. We've completed quite a few of the bias targets as well as the red box targets, so now, with it being the last trading day of the month and quarter and tomorrow being the first, we'll take a back seat.
Support stands at the 3275 level with resistance still at 3404-6. Higher box is defence so we'll stick with it and see if it works how we intended.
KOG’s bias for the week:
Bullish above 3250 with targets above 3278✅, 3285✅, 3297 and above that 3306
Bearish below 3250 with targets below 3240, 3232, 3220 and below that 3212
RED BOX TARGETS:
Break above 3275 for 3279✅, 3285✅, 3289✅ and 3306 in extension of the move
Break below 3260 for 3255, 3251, 3240 and 3235 in extension of the move
As always, trade safe.
KOG
XAUUSDK trade ideas

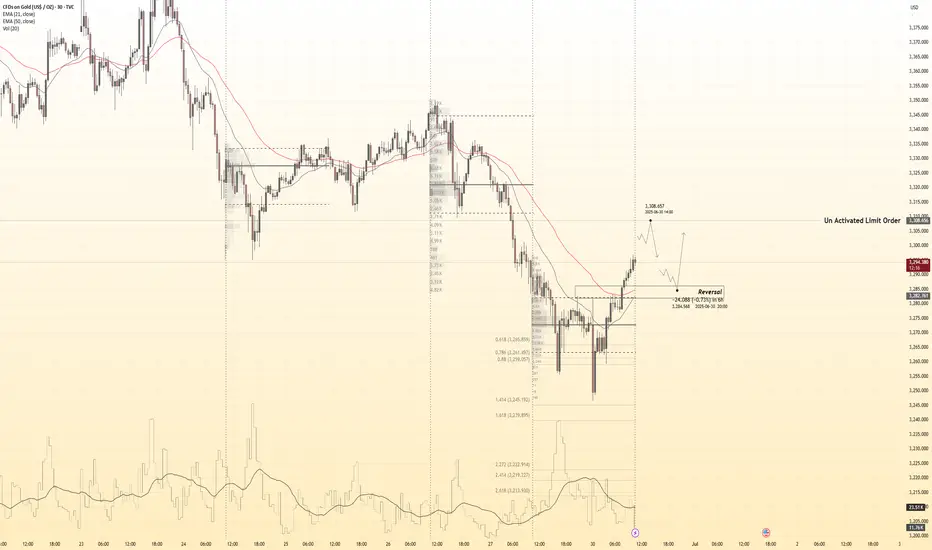
Gold 30 Min Engaged ( Dual Entry's Detected )➕ Objective: Precision Volume Execution
Time Frame: 30-Minute Warfare
Entry Protocol: Only after volume-verified breakout
🩸 Bullish Reversal : 3309
Volume Poc + Value
🩸 Bearish Reversal : 3284
Volume Poc + Value
➗ Hanzo Protocol: Volume-Tiered Entry Authority
➕ Zone Activated: Dynamic market pressure detected.
The level isn’t just price — it’s a memory of where they moved size.
Volume is rising beneath the surface — not noise, but preparation.
🔥 Tactical Note:
We wait for the energy signature — when volume betrays intention.
The trap gets set. The weak follow. We execute.
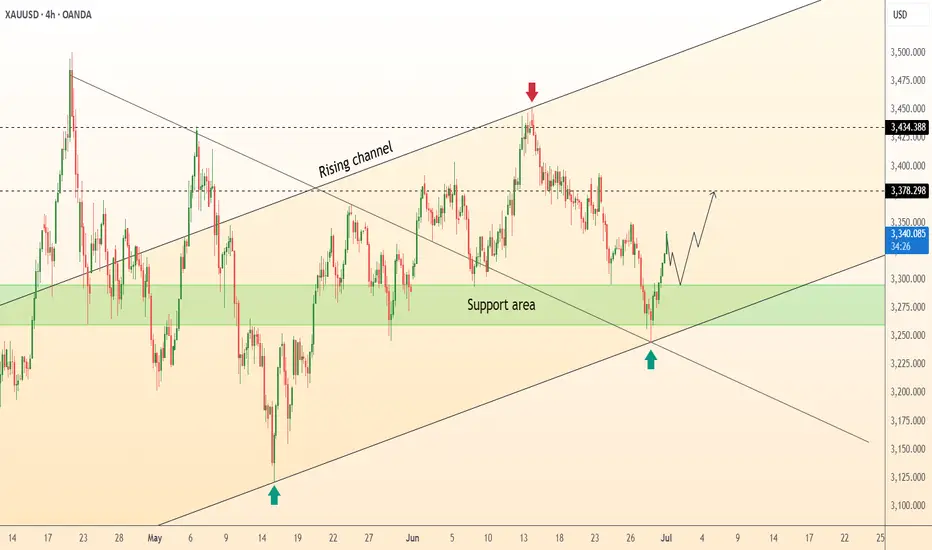
DeGRAM | GOLD held the support area📊 Technical Analysis
● Bullish rebound from the green 3 250-3 300 demand, where the rising-channel base and May’s inner trend-line intersect, prints a higher low and invalidates the prior break.
● Price is reclaiming the channel median; a push through 3 378 unlocks the June swing cap at 3 434, while risk is contained by the fresh pivot turned support at 3 300.
💡 Fundamental Analysis
● Softer US ISM-Mfg prices and a dip in 2-yr yields eased dollar pressure, while IMF data show another uptick in official gold purchases—both restoring near-term bid.
✨ Summary
Long 3 300-3 320; hold above aims 3 378 → 3 434. Invalidate below 3 250.
-------------------
Share your opinion in the comments and support the idea with a like. Thanks for your support!
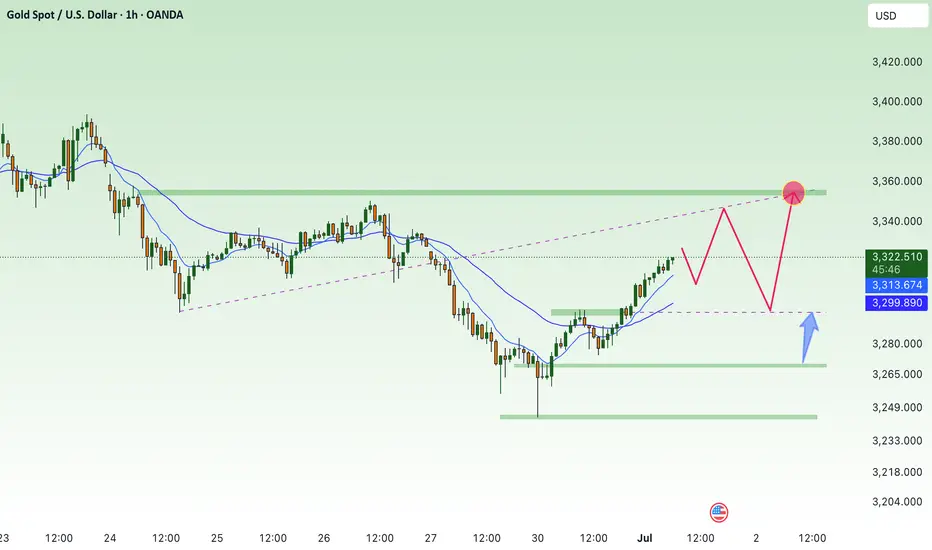
Gold price recovers above 3300⭐️GOLDEN INFORMATION:
Gold (XAU/USD) trades at $3,292 after rebounding from an intraday low of $3,246 and looks set to close out June with a modest gain of over 0.18%. However, its upward momentum has been restrained by easing geopolitical tensions in the Middle East and growing optimism over forthcoming trade agreements. Meanwhile, analysts at Citi expect Gold to consolidate within the $3,100 to $3,500 range throughout the third quarter.
In Washington, US Treasury Secretary Scott Bessent expressed confidence that the “One Big Beautiful Bill” will make progress in the coming hours. The sweeping tax reform legislation, which narrowly passed the Senate over the weekend, includes major tax deductions funded by reductions in Medicaid spending and green energy incentives.
⭐️Personal comments NOVA:
Gold price recovers above 3300 , ahead of NF reports this week . Accumulates above 3300
⭐️SET UP GOLD PRICE:
🔥SELL GOLD zone: 3353- 3355 SL 3360
TP1: $3340
TP2: $3330
TP3: $3320
🔥BUY GOLD zone: $3272-$3270 SL $3265
TP1: $3283
TP2: $3295
TP3: $3310
⭐️Technical analysis:
Based on technical indicators EMA 34, EMA89 and support resistance areas to set up a reasonable BUY order.
⭐️NOTE:
Note: Nova wishes traders to manage their capital well
- take the number of lots that match your capital
- Takeprofit equal to 4-6% of capital account
- Stoplose equal to 2-3% of capital account
THE KOG REPORT - UpdateEnd of day update from us here at KOG:
We said we would stick with the plan and look for the higher levels on Gold, which we did and worked well. Once we approached the red box however, you'll notice we broke straight through it. The indicators then gave us numerous long signals which meant we either got in with the madness of the move, or, simple waited for the red box target to hit and then attempt the short on the RIP, which is moving nicely at the moment.
Now resistance is on the flip 3350 with support below 3333-5 which is we're we are looking for a potential bounce. We have made a big move today so not expecting much towards the end of the session.
KOG’s bias for the week:
Bullish above 3250 with targets above 3278✅, 3285✅, 3297✅ and above that 3306✅
Bearish below 3250 with targets below 3240, 3232, 3220 and below that 3212
RED BOX TARGETS:
Break above 3275 for 3279✅, 3285✅, 3289✅ and 3306✅ in extension of the move
Break below 3260 for 3255, 3251, 3240 and 3235 in extension of the move
As always, trade safe.
KOG
Watch me make $125 liveafter a brutal night in the markets looking to recoup from the losses I took and regain my momentum before we close the trading week tomorrow.

GOLD (XAUUSD): Your Trading Plan for Monday
Gold went strongly rejected from a key daily support on Friday.
Your confirmation signal for a pullback trade from that will
be a bullish breakout and an hourly candle close above
3283 intraday resistance.
After that the price will likely reach 3292 level.
❤️Please, support my work with like, thank you!❤️
I am part of Trade Nation's Influencer program and receive a monthly fee for using their TradingView charts in my analysis.

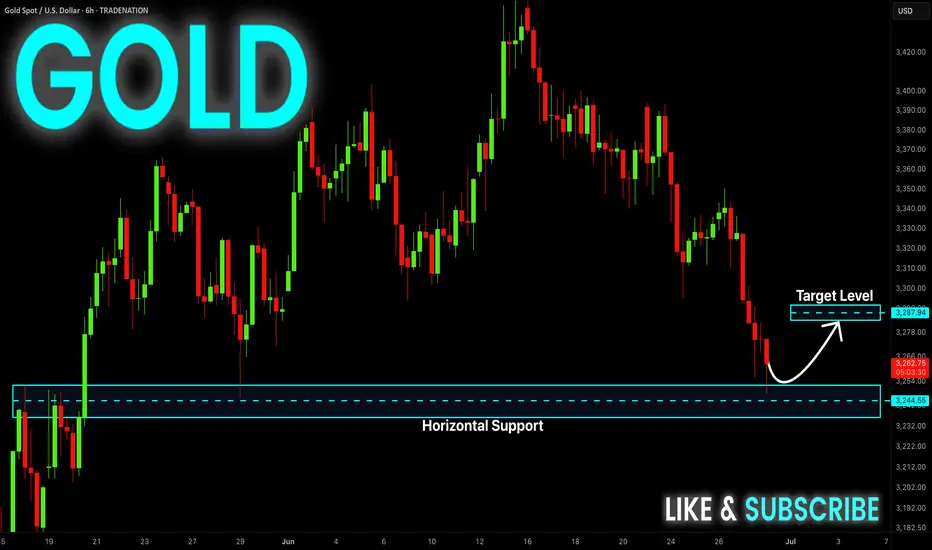
GOLD Support Ahead! Buy!
Hello,Traders!
GOLD keeps falling just
As I predicted but the price
Will soon hit a horizontal support
Around 3235$ from where we
Will be expecting a local
Bullish rebound
Buy!
Comment and subscribe to help us grow!
Check out other forecasts below too!
Disclosure: I am part of Trade Nation's Influencer program and receive a monthly fee for using their TradingView charts in my analysis.
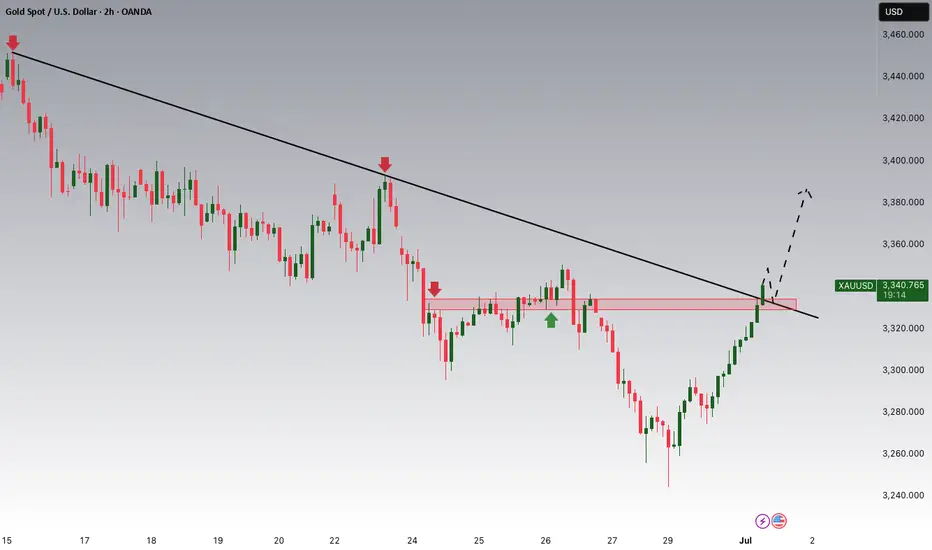
Gold Breakout and Potential RetraceHey Traders, in today's trading session we are monitoring XAUUSD for a buying opportunity around 3,330 zone, Gold was trading in a downtrend and successfully managed to break it out. Currently is in a correction phase in which it is approaching the retrace area at 3,330 support and resistance area.
Trade safe, Joe.
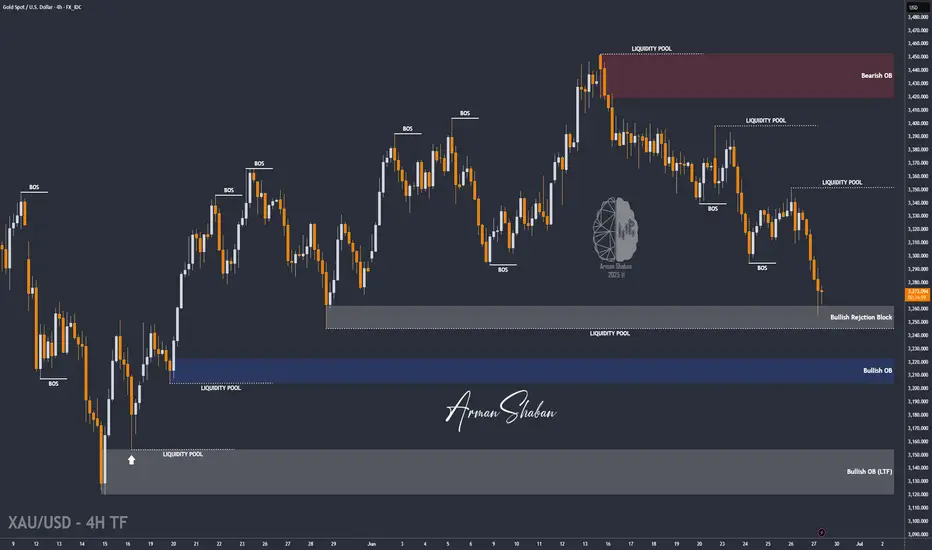
XAUUSD : Ready for More Upside Before Another Fall ?By analyzing the gold chart on the 4-hour timeframe, we can see that price initially followed our bullish scenario, climbing 140 pips up to $3336. However, after hitting that level, gold reversed and entered the bearish scenario, dropping below $3300 and eventually finding support around $3255.
This area acted as a strong demand zone, and we’ve since seen a rebound. Currently, gold is trading around $3273, and as long as price holds above the marked demand zone (Bullish Rejection Block), we may expect another bullish move before price potentially targets the liquidity below $3245 and $3203.
Please support me with your likes and comments to motivate me to share more analysis with you and share your opinion about the possible trend of this chart with me !
Best Regards , Arman Shaban
XAUUSD-Gold stalls below $3350 as USD weakness continuesGold remains delicately balanced as traders in Asia and Europe proceed with caution. Despite recent USD weakness lending some support, buyers haven’t broken above $3350.
📉 USD Weakness & Market Sentiment – Fragile Recovery?
🔻 Dollar Wobbles: Talk of Fed leadership change is stirring doubt over the USD’s trajectory, adding political risk that may benefit gold.
⚖️ Mixed Sentiment: Gold consolidates in a tight range after early‑week drop. With PCE data and Fed speeches ahead, traders await the next catalyst.
📊 Technical Structure – Consolidation Underway
Gold trades below short‑term EMAs, hinting at a bearish pause or stealth accumulation. Current levels near $329X.
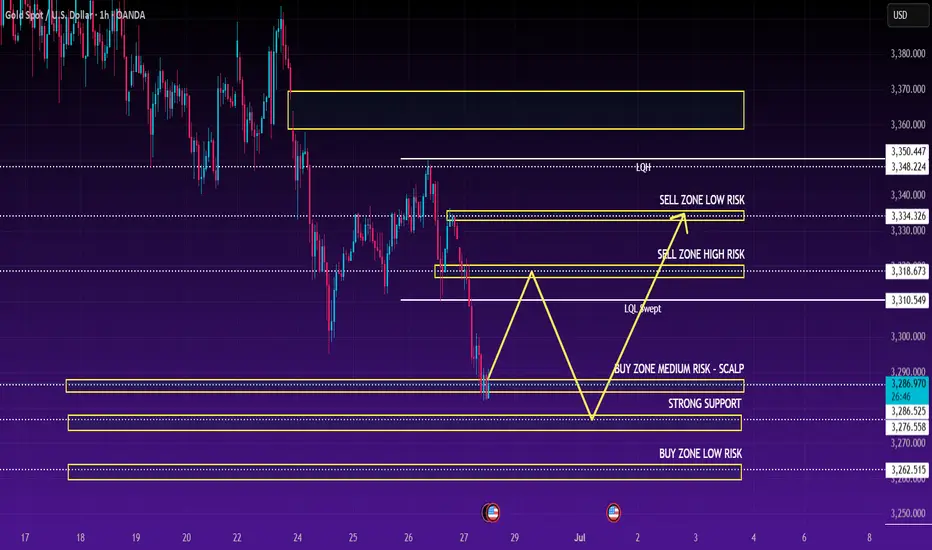
Key Zones:
🟢 Demand (Buy): $3264 / $3276 / $3294
🔴 Supply (Sell): $3313 / $3321 / $3330 / $3341
🎯 Intraday Trading Plan:
🛒 BUY ZONE: $3264–$3266 (SL: $3270; TPs: $3280 → … → $3320)
⚡️ BUY SCALP: $3282–$3284 (SL: $3278; TPs: $3288 → … → $3330)
📉 SELL ZONE: $3331–$3333 (SL: $3337; TPs: $3326 → … → $3300)
⚠️ SELL SCALP: $3313–$3315 (SL: $3320; TPs: $3310 → … → $3280)
🧭 Watchlist: Friday’s PCE, Fed commentary & Middle East tensions may sway price
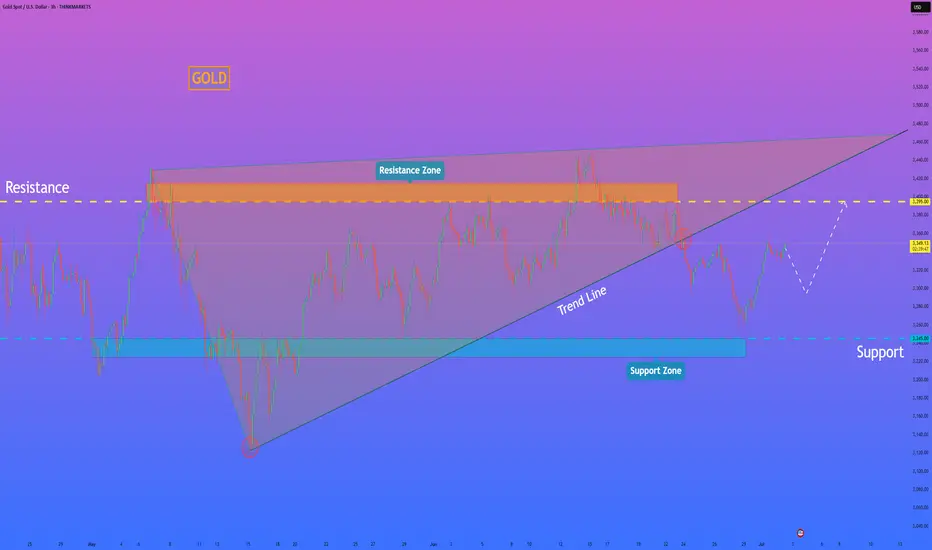
HelenP. I Gold will make small correction and then continue growHi folks today I'm prepared for you Euro analytics. In this chart, we can see how the price declined to the 3245 support level, which coincided with the support zone, and then started to grow. In a short time, it reached the 3395 resistance level, which coincided with the resistance zone, and then dropped to the trend line, breaking two levels, and made a gap. After this movement, the price started to grow in a wedge and soon reached the support level, which broke it and continued to rise next. Later, it made a correction to the 3245 level and then continued to move up and reached the resistance level. Price bounced from this level and corrected, after which it turned around and rose to the resistance line of the wedge pattern, breaking the 3395 resistance level. But soon, it turned around and corrected to the trend line. Not a long time ago, price exited from the wedge, fell to the support level, and then started to grow. For this case, I expect that XAUUSD will make a small correction. Then I think it can continue to grow and reach the 3395 resistance level, which is my current goal. If you like my analytics you may support me with your like/comment.❤️
Disclaimer: As part of ThinkMarkets’ Influencer Program, I am sponsored to share and publish their charts in my analysis.
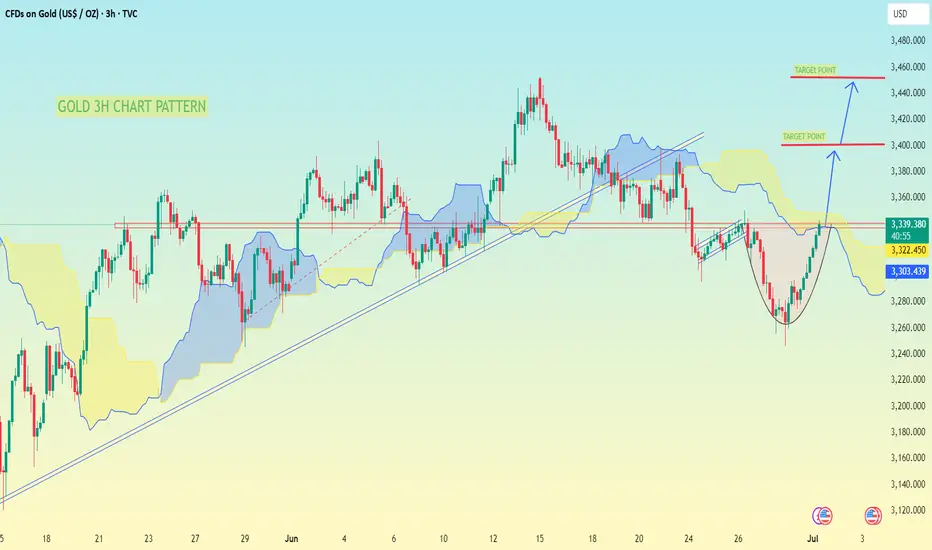
GOLD 3H Chart Pattern, I have marked a cup formationGOLD 3H Chart Pattern, I have marked a cup formation, which often indicates a bullish reversal setup. Based on the chart:
Key Levels:
Current Price Zone: Around 3,323 - 3,330
First Target: Near 3,380 - 3,400
Final Target: Near 3,440 - 3,460
Analysis:
Price is forming a cup pattern with resistance around 3,380 - 3,400
Break above 3,400 could lead towards the final target zone of 3,440 - 3,460
Watch for price reaction near Ichimoku Cloud; clean breakout above the cloud confirms bullish momentum
Suggested Targets:
✅ First Target: 3,380 - 3,400 USD
✅ Second Target: 3,440 - 3,460 USD
Note: Wait for confirmation above 3,330 - 3,340 and bullish momentum to continue.
If you want, I can also give stop-loss and entry suggestions based on this chart. Let me know!
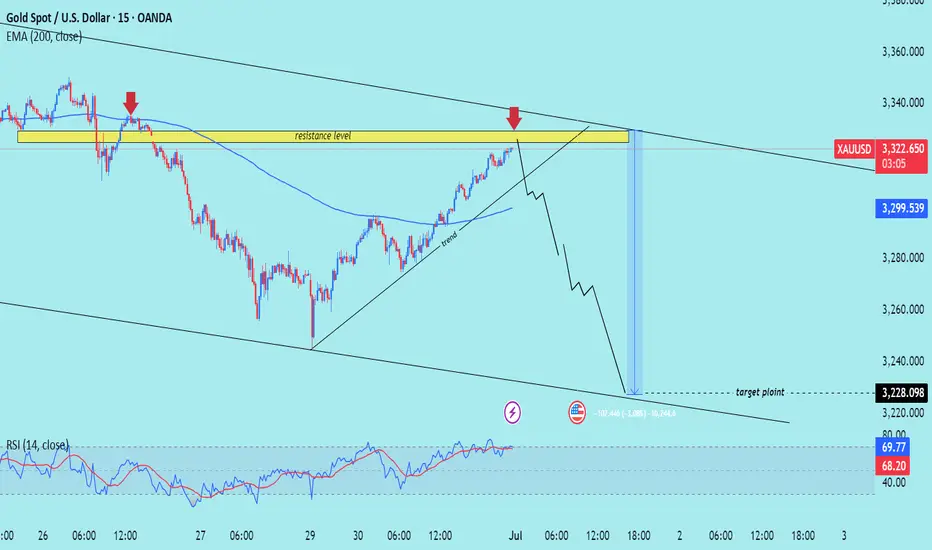
XAU/USD) bearish reversal analysis Read The captionTechnical analysis of (XAU/USD) based on price action and technical indicators on the 15-minute timeframe. Here's a
---
Key Technical Insights:
1. Resistance Level (Highlighted Yellow Zone):
Price is approaching a strong resistance zone (previous rejection marked by red arrows).
This area has historically pushed price downward.
2. Trendline Support (Rising Black Line):
Price has been following a short-term ascending trendline, forming higher lows.
A break below this trendline signals potential bearish reversal.
3. EMA 200 (Blue Line):
Price is currently above the EMA 200, indicating short-term bullish momentum.
However, price is testing resistance — a rejection could flip momentum bearish.
4. Bearish Rejection & Projection:
The chart shows an anticipated rejection from resistance, followed by a break of trendline support.
Target zone is marked near 3,228.098, indicating a drop of ~94 points from the current level.
5. RSI (Relative Strength Index):
RSI is nearing overbought territory (68.79).
A bearish divergence or RSI crossing down may confirm weakening momentum.
Mr SMC Trading point
---
Conclusion / Trading Idea:
Bias: Bearish
Entry Zone: Near the resistance level (~3,322)
Confirmation: Break of trendline support
Target: 3,228
Stop-Loss: Above resistance zone (just over the upper trendline)
---
pelas support boost 🚀 this analysis)
Battle Plan – 30 JuneHey, Snipers! It’s Sunday night, the real ones are back on the charts and the tourists are out of the game.
Last week, gold tried every trick in the book: fake bounces, liquidity sweeps, endless bearish grind. Every move up got sold. If you traded like a sniper, you’re still standing. If you chased dips blindly, you’re probably licking your wounds.
🌍Macro snapshot:
Dollar’s holding firm — no rescue from US news, just choppy reactions.
War headlines are everywhere, but structure is king: EMAs are stacked, every rally is just bait for liquidity.
Market’s running on fear and patience. Fast money gets chopped, disciplined money survives.
Sniper Mindset:
⛔No bias, no forced trades. The real win is in the waiting.
Structure will show you who’s in control — your job is to react, not predict.
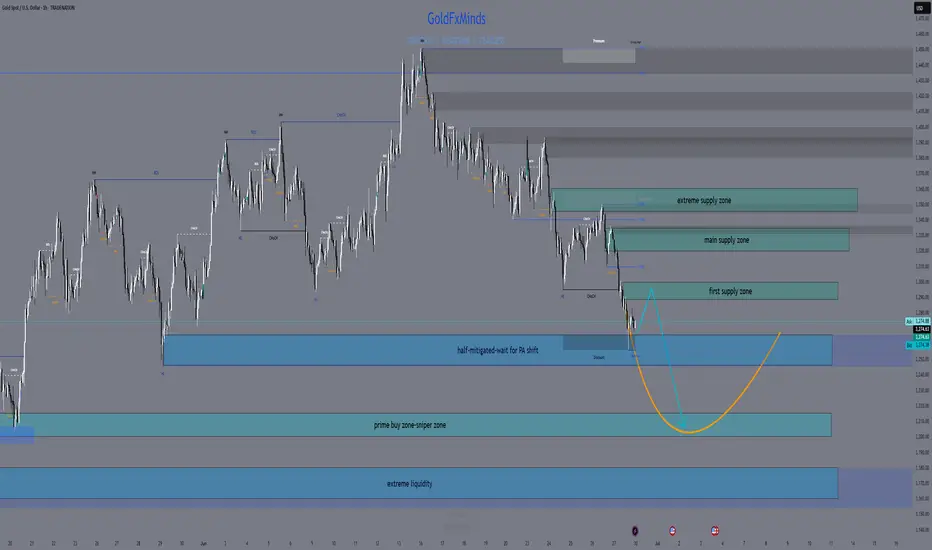
🥷 GoldFxMinds Battle Plan – 30 June (Trade Nation Feed)
Demand (Buy) Zones:
3265–3245: The “half-mitigated” trap. Most buyers are already underwater — we wait for a real PA shift. First green candle? Ignore it. Let them get trapped.
3215–3200: This is the sniper zone for real discount hunters. If price freefalls, we watch for exhaustion, divergence, and a proper story. One clean engulfing here and the bounce can be massive.
3180–3160: Only for flash crash days — this is where pain turns into opportunity. But you wait for panic, not “hope trades.”
Supply (Sell) Zones:
3287–3300: First sell window — if price spikes, watch for that classic NY liquidity grab and an instant rejection.
3320–3335: The “don’t even try to buy here” zone. OB, FVG, and every EMA lines up — if the market gets here, expect a brutal fade.
3345–3360: Premium fantasy land for sellers. If bulls get cocky, this is where the big shorts reload for the next leg down.
🧠Sniper Mindset:
EMAs stacked above? No dreams, only discipline.
No confirmation in your zone? Stand down — the market isn’t your friend.
Most traders buy “cheap” — we buy right.
If the story’s not clear, patience pays. The first bounce is a trap, the second is the setup.
📝June’s about to end. Let’s close it out with surgical entries and sniper exits.
Stay sharp, stay humble, and let the crowd chase while we collect.
🧠Remember: green candles aren’t invitations, they’re traps for the impatient.
Wait for confluence, act on logic, and journal every single lesson.
Gold rewards discipline — not luck.
If you’re serious about gold, learn this:
Zone + confluence + confirmation = sniper entry.
Anything else is just gambling with a nice chart.
Review your trades, journal your mistakes, and stop blaming the market for your impatience.
Hit like🚀, follow, and drop your trading question if you want the next level.
See you on the Trade Nation feed.
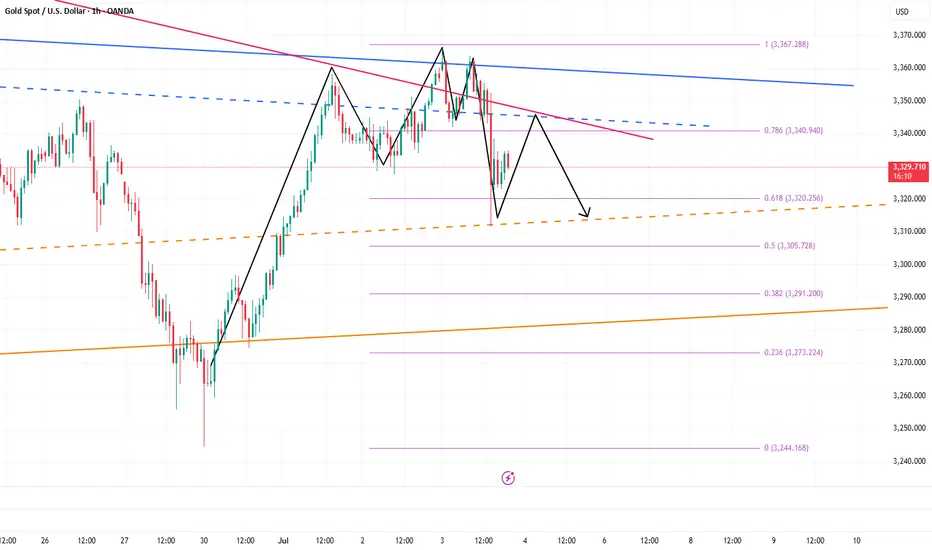
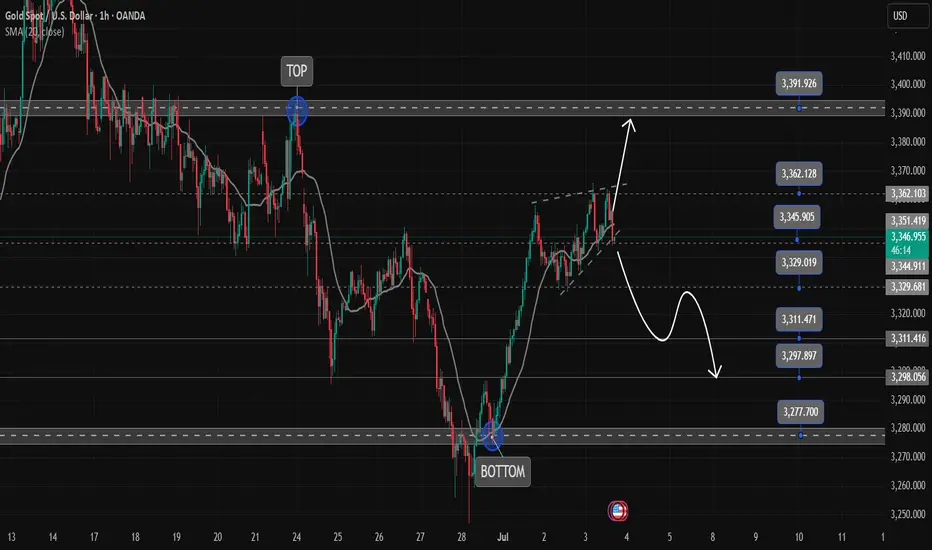
Gold Trading Strategy July 3✏️D1 candle continues to increase towards the price gap zone. At the beginning of the European session, sellers accept to enter the market at this resistance price zone around 3365. The accumulation pattern of gold price is forming a triangle pattern.
The lower boundary is broken, it will lead to the breakout point of the lower boundary and vice versa, if the upper boundary of the triangle is broken, the price will move towards the next resistance.
📉 Key Levels
Resistance: 3388-3363
Support: 3330-3311-3297-3277
Buy trigger: breakout above 3363
Sell trigger: breakout below 3330
If this idea resonates with you or you have other ideas, please comment. I look forward to reading your thoughts!
Best regards, VHT Traders!
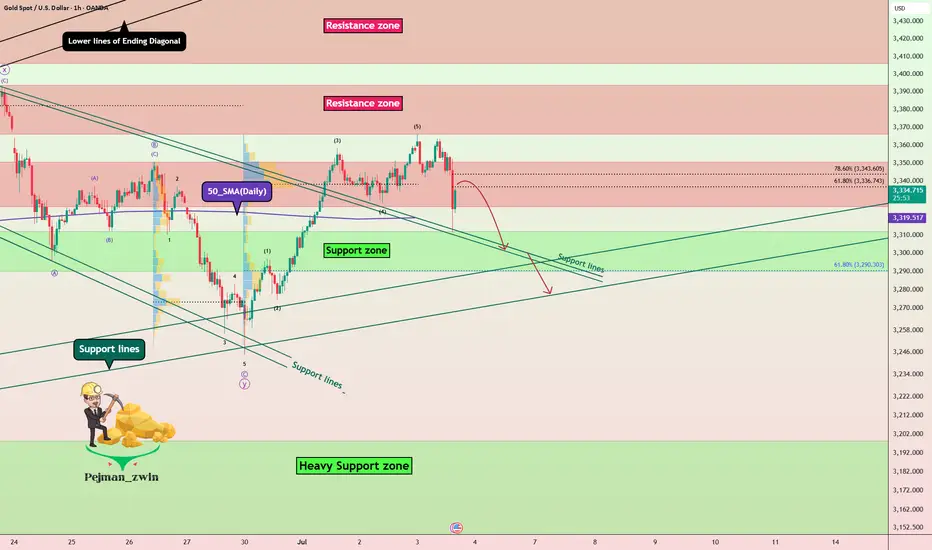
Gold Under Pressure After NFP Beat – More Downside Ahead?Moments ago, the US Non-Farm Payrolls surprised to the upside at 147K (vs 111K forecast), while the Unemployment Rate dropped to 4.1% (vs 4.3% expected) .
This stronger-than-expected labor market data reinforces the idea that the Fed has no immediate reason to cut rates. As a result, the USD( TVC:DXY ) strengthened, and gold came under renewed selling pressure.
If the dollar momentum continues, Gold ( OANDA:XAUUSD ) may face further downside in the short term.
In terms of Technical Analysis , Gold fell below the Resistance zone($3,350-$3,326) again after the announcement of US indices and is currently moving near the Support lines and 50_SMA(Daily) .
In terms of Elliott wave theory , it seems that Gold has completed 5 impulsive waves in the one-hour time frame, and we should now wait for corrective waves .
I expect Gold to fall again after the upward correction , and the Support zone($3,312-$3,290) could be the target.
Note: Stop Loss (SL) = $3,365
Gold Analyze (XAUUSD), 1-hour time frame.
Be sure to follow the updated ideas.
Do not forget to put a Stop loss for your positions (For every position you want to open).
Please follow your strategy; this is just my idea, and I will gladly see your ideas in this post.
Please do not forget the ✅ ' like ' ✅ button 🙏😊 & Share it with your friends; thanks, and Trade safe.
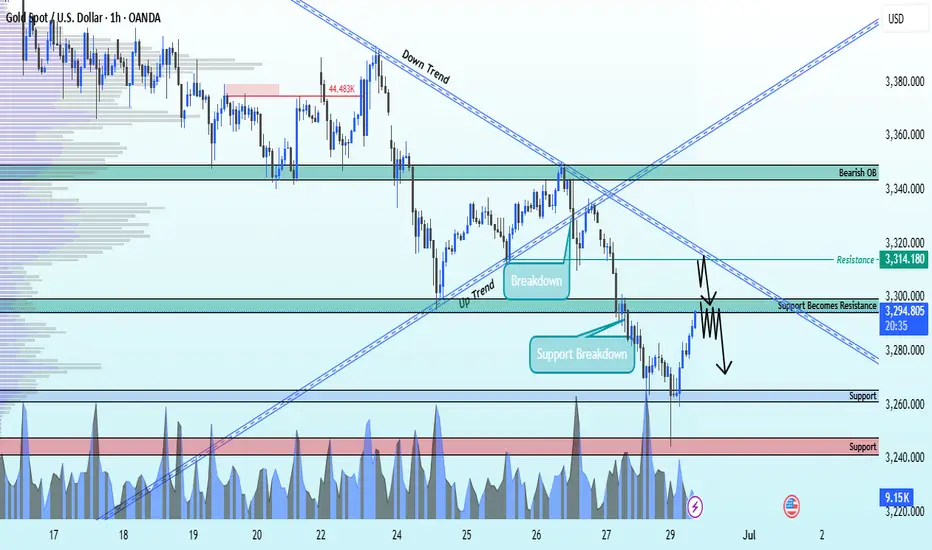
XAUUSD Bullish Trend breakdown and support on 3295XAUUSD Technical Breakdown
1H Time Frame Analysis by Livia 😜
Gold (XAU/USD) has officially broken down from the bullish trend, symmetrical triangle, and the key support zone at 3295.
A retracement is complete, and 3295 now acts as a fresh resistance level — setting up a clean entry point for sellers.
🎯 Bearish Technical Targets:
🔻 1st Support: 3260
🔻 2nd Support: 3240
💬 Like, follow, and comment to stay ahead of the market.
📲 Join us for more real-time updates and pro insights!
#GoldAnalysis #XAUUSD #ForexTrading #TechnicalAnalysis #BreakdownAlert #JoinTheMovement
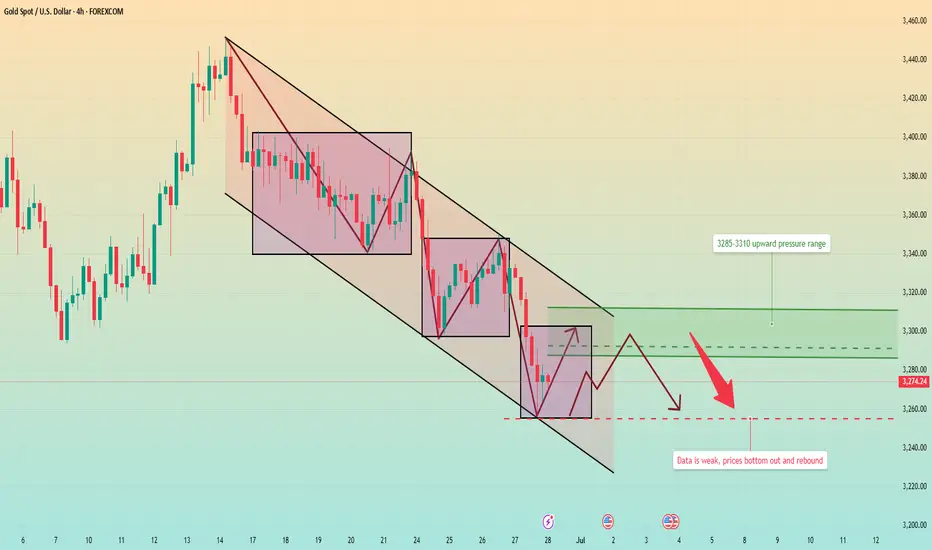
Gold has been falling continuously. Will it continue next week?Market review:
The conflict between Israel and Iran intensified, and gold surged in the early stage, and then continued to fluctuate downward. Affected by the situation in the Middle East and weak data from the United States, it fell severely in three trading days, and most of the other time periods were in the stage of repeated washing.
The first round of decline began at the high point of 3452. Affected by the situation in the Middle East, the price rose rapidly, but the rapid rise led to insufficient upward momentum, and the departure of buyers led to continuous declines in a single trading day. The second round of decline was affected by the easing of the conflict between Iran and Israel, and the US dollar, crude oil, and gold all plunged sharply; the third round of decline was Powell's wait-and-see attitude towards the interest rate cut policy, and some US data were bearish for gold, leading to a new round of decline.
Market outlook for next week:
The breaking of the key support bands of 3303 and 3295 means that the downward adjustment has not ended, but after touching the support near 3250, there was a clear bottoming out and recovery. It means that there is strong support below, and the focus of next week's opening is the emergence of price rebound. There were rebounds to varying degrees after the previous two rounds of decline, so this round of decline still needs to be paid attention to. The strategy mainly revolves around shorting on price rebound, with a focus on the upward suppression range of 3285-3310.
If the rebound is small, then at the beginning of next week, it is likely to maintain a small fluctuation in the range of 3270-3285.
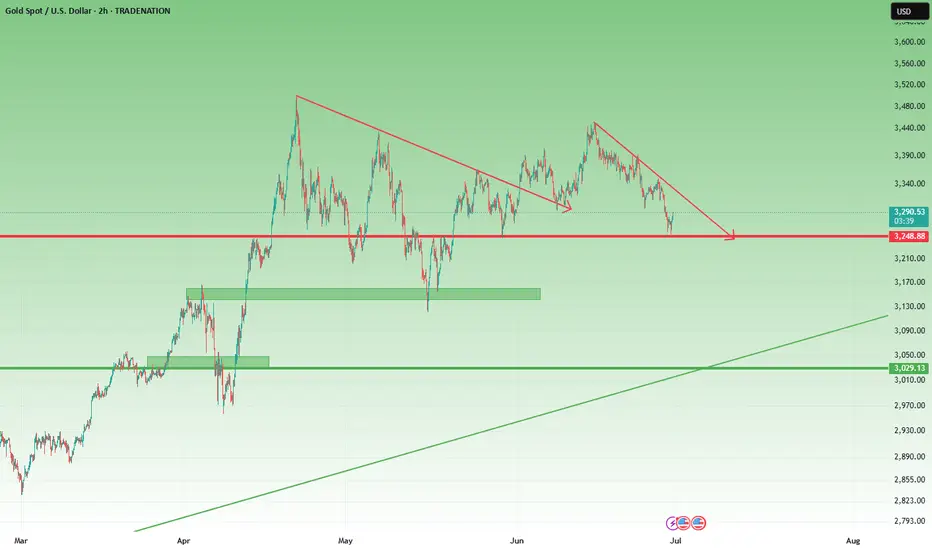
Gold Rebounds from 3250 – But Bears Still in Control1. What happened last week
As you know, I’ve been bearish on Gold all last week long. Even though the geopolitical situation in the Middle East escalated over the weekend, the fact that price couldn’t reclaim the 3400 resistance was a major red flag.
It showed us that the bullish sentiment was fragile, and that downside pressure is just around the corner.
And indeed — Gold sold off. The weekly close below the 3300 level confirmed the weakness.
2. The key question now
Has Gold found a bottom at 3250, or is this just a temporary rebound before another leg down?
3. Why I expect a continuation lower
- The weekly close was under 3300, breaking key support
- 3250 is being tested again — a level touched multiple times since the mid-April ATH
- The current rebound looks corrective, not impulsive
- Resistance levels at 3320 and 3340 are likely to hold as ceilings
- No major catalyst yet to justify a reversal
- This looks like a classic “sell the rally” setup in a weakening trend.
4. Trading plan
The idea is simple: sell the spikes.
If price bounces into 3320–3340, I will look to short again, anticipating a renewed test of the 3250 support zone.
If 3250 breaks — we could see acceleration toward 3200 or lower.
5. Final thoughts 🚀
No need to complicate things. Gold remains vulnerable unless it clears 3340. Until then, the trend is your friend — and that trend points down.
Disclosure: I am part of TradeNation's Influencer program and receive a monthly fee for using their TradingView charts in my analyses and educational articles.
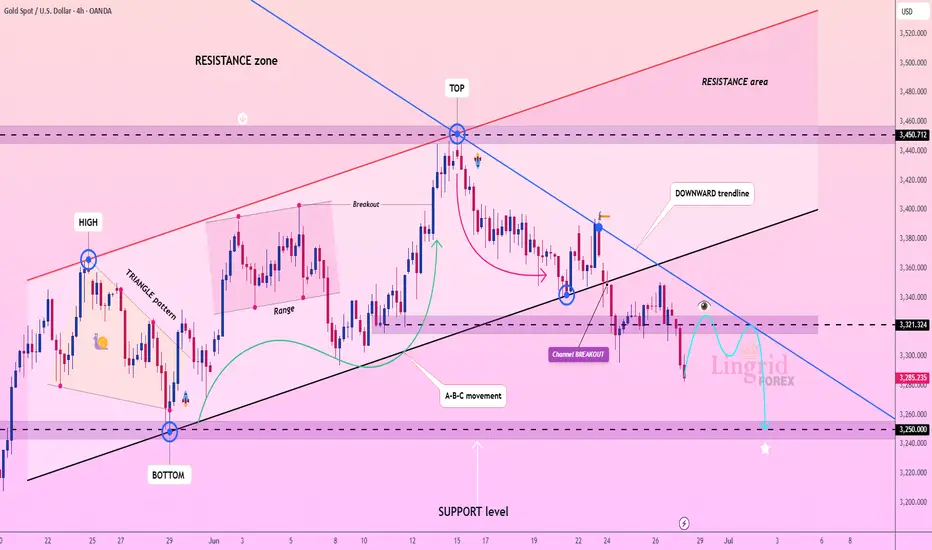
Lingrid | GOLD Bear Channel Break: Short OpportunityOANDA:XAUUSD has broken down from the upward channel and is now trading below the key 3,321 level, which previously served as support. The price is forming a bearish structure beneath the black and blue trendlines, with 3,250 emerging as the next potential target. A minor relief bounce could retest 3,320, but rejection here would reinforce downside continuation.
📈 Key Levels
Sell zone: 3,315–3,330
Sell trigger: rejection below 3,321
Target: 3,250
Sell confirmation: breakdown from 3,285 with momentum
💡 Risks
False breakout above 3,321 could trap sellers
Weak bearish momentum may result in sideways chop
Re-entry into channel could negate bearish outlook
If this idea resonates with you or you have your own opinion, traders, hit the comments. I’m excited to read your thoughts!
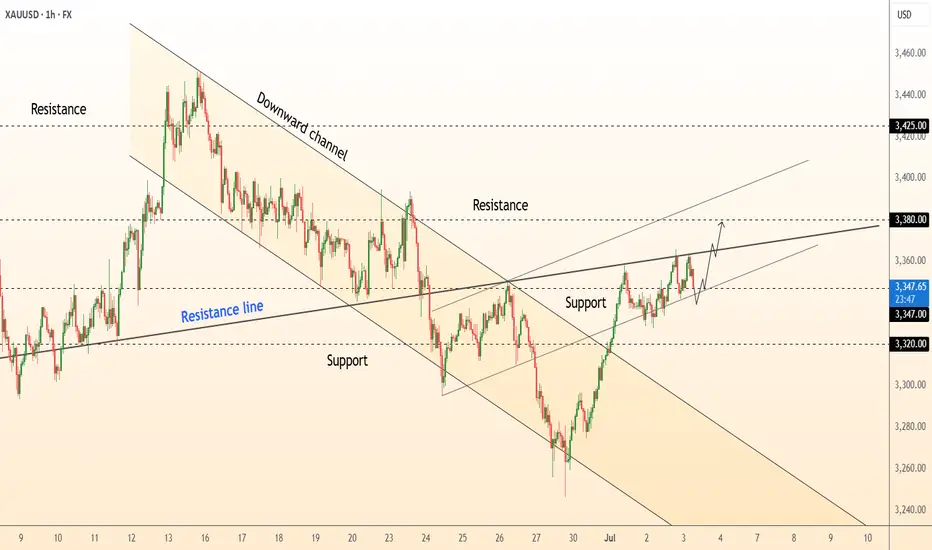
DeGRAM | GOLD retest of the resistance line📊 Technical Analysis
● Price holds above the broken blue resistance line, now acting as support near 3 347, while an inner up-sloper is guiding a stair of higher lows inside the new grey channel.
● The confluence of channel mid-line and 3 355 swing high is the gate; its clearance activates an equal-width objective at 3 380, with the outer rail / former consolidation lid at 3 425 next.
💡 Fundamental Analysis
● Easing US ISM-services prices trimmed real 2-yr yields and the dollar, while latest WGC data show June net central-bank purchases rising for a third month, reviving dip-buying in gold.
✨ Summary
Long 3 345–3 355; hold above 3 355 targets 3 380 → 3 425. Invalidate on an H1 close below 3 320.
-------------------
Share your opinion in the comments and support the idea with a like. Thanks for your support!
Continue to short gold, bears will exert force againAffected by the NFP market, gold fell precipitously, almost giving back 50% of the gains in the previous wave, and the short-selling performance was particularly strong; technically, gold successfully built a double-top structural resistance in the 3365-3363 area in the short term, which played a technical suppression role in the short term. As gold fell, the current short-term resistance moved down to the 3340-3350 area;
On the other hand, although gold began to rebound after falling to around 3312, it clearly showed the characteristics of weak rebound, and it did not even stand above 3340 once, and the long forces were insufficient; and technically, a single lower shadow line was not enough to support the continued rebound of gold, so gold still had the need to retrace the support below from a technical perspective; and once gold fell again, it was very likely to test the 3305-3295 area again.
So I think we can take advantage of the rebound of gold to short gold again. We can still short gold with the 3340-3350 area as resistance and look at the target area: 3315-3305-3295.