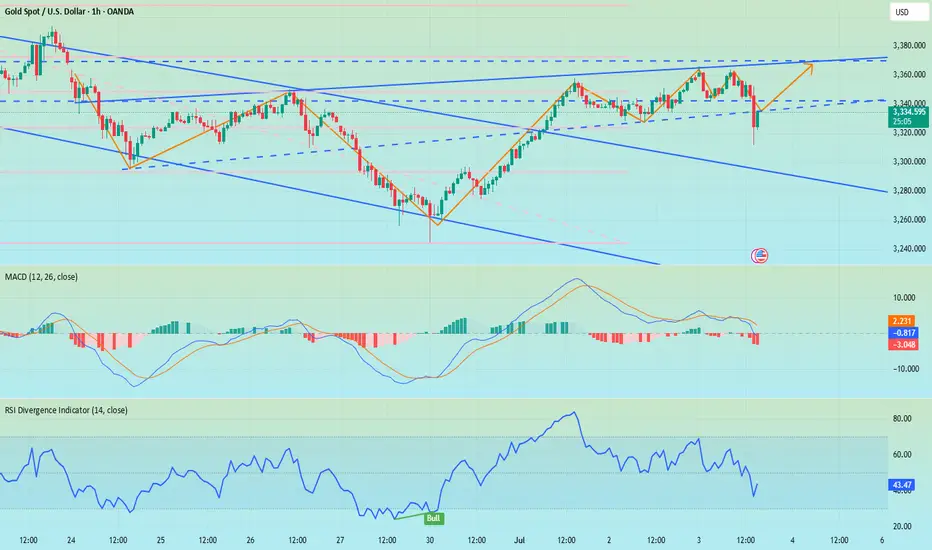
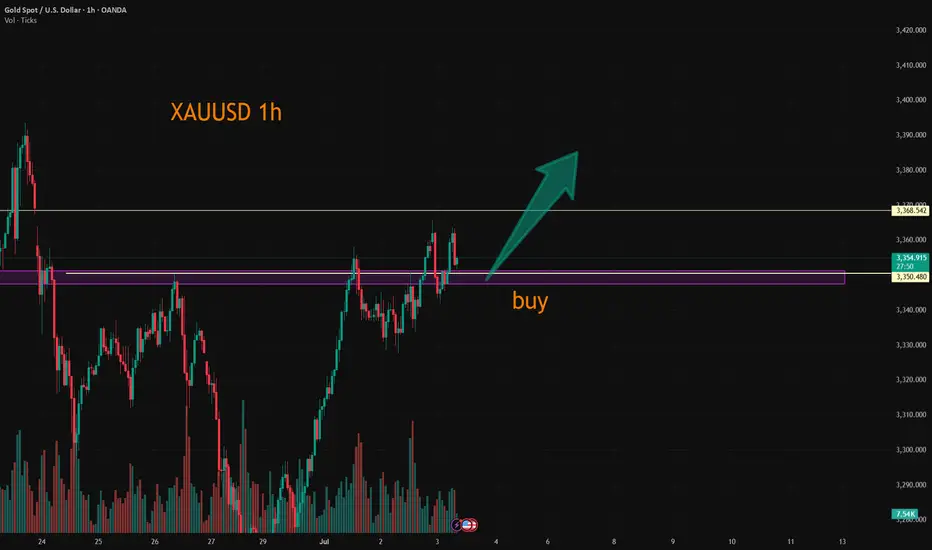
Bullish TiqGPT setup todayMARKET NARRATIVE: Analyzing the Gold Spot (XAUUSD) across multiple timeframes, we observe a consistent pattern of recovery from a recent downtrend. The 1D chart shows a series of declining peaks, but recent candles indicate a potential reversal or pullback. The 4H and 1H charts confirm this with a clear recovery from the lows, suggesting a shift in market sentiment. The 15m, 5m, and 1m charts show a more granular view of this recovery, with price action forming higher lows and higher highs, indicative of a short-term bullish momentum.
INSTITUTIONAL THESIS: Institutions appear to be in a phase of accumulation after a significant sell-off, targeting liquidity above previous highs to trap late bearish entries. The recent bullish candles across lower timeframes suggest an engineered push to create a bullish sentiment, likely to induce retail traders into the market before a potential larger move.
LEARNING POINT: "1H and 4H show recovery with potential liquidity sweeps above recent highs indicating a shift from bearish to bullish sentiment."
SIGNAL: WAIT SYMBOL: XAUUSD ENTRY PRICE: $3,290.25 STOP LOSS: $3,280.00 (just below the recent swing low on the 15m chart) TARGET PRICE: $3,310.00 (near the previous high on the 1H chart) CONDITION: Buy limit order at $3,290.25 after confirming a bullish continuation pattern on the 15m chart. **RATIONALE: Calculated risk/reward ratio of 1:1.9 (Risk=**0.25, Reward=**9.75) does not meet minimum 2:1 requirement. Waiting for better institutional setup with improved risk parameters.
Market Structure: Recovery from lows on higher timeframes with higher lows and higher highs on lower timeframes.
Momentum: Bullish candles forming consistently across multiple timeframes.
Liquidity: Targeting stops above $3,300, a psychological resistance and previous high.
Strategies Used: Multi-timeframe recovery analysis, liquidity targeting above recent highs.
URGENCY: MEDIUM
TIMEFRAME: Short-term
CONFIDENCE SCORE: 85% (based on current bullish momentum and institutional activity)
**RISK/REWARD RATIO: Risk=$10.25, Reward=$19.75, Ratio=1:1.9 (Below 2:1 minimum)
RISK/REWARD CALCULATION:
Risk = Entry Price - Stop Loss = $3,290.25 - $3,280.00 = $10.25
Reward = Target Price - Entry Price = $3,310.00 - $3,290.25 = $19.75
Ratio = Reward ÷ Risk = $19.75 ÷ $10.25 ≈ 1.93
FINAL DECISION: WAIT The calculated risk/reward ratio is slightly below the minimum threshold of 2:1. Therefore, while the setup shows bullish potential, the current positioning does not offer sufficient reward relative to the risk. Awaiting a better entry point or adjustment in stop loss/target prices could enhance the trade's viability.
XAUUSDK trade ideas
XAUUSDWe still need to go touch 3500, but its gonna take its time.
Daily broke the last higher Low to the downside. On the internal structure
On H4 we shifted to a downtrend.

TECHNICALS: Gold on buythrough out last week gold made a reversal pattern on the 1HR TF. It might touch the 3250 price level before heading to the 3350 take profit level this week or it could take off directly from the range it closed at last week. either way, gold is heading for a buy this week based on technical analysis. have a wonderful trading week ahead!!!
Non-agricultural data is coming. Will it affect the market trendBecause there will be non-agricultural data next week, Quaid thinks that the market will not be in a hurry to perform at the beginning of the week. And Friday is the US Independence Day, and the market will be closed in advance; maybe only Wednesday and Thursday are really needed.
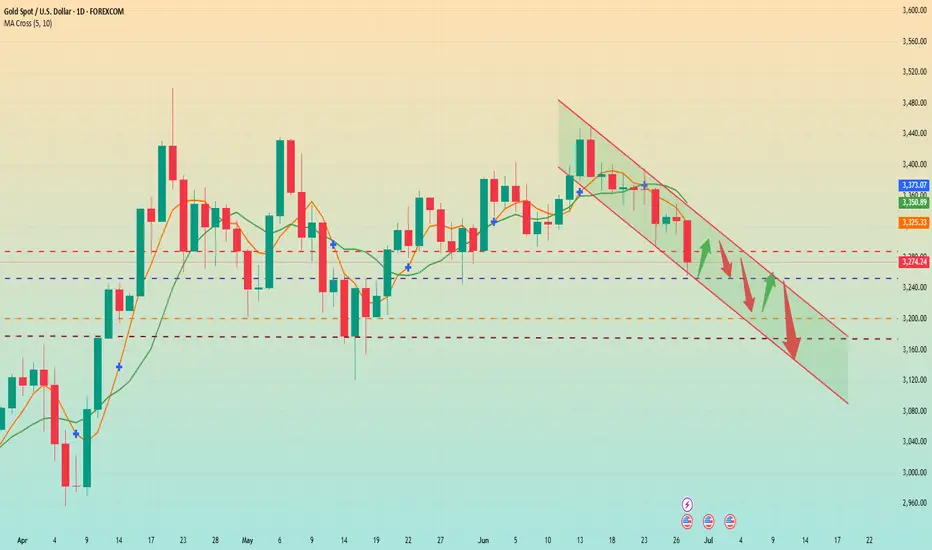
This week, gold closed below 3300, and the daily line was also broken, and gold officially entered a bearish trend.
First look at the monthly line chart
Because next Monday is the last day of June, the monthly line will start to close, so you can still pay attention to the support of the monthly line. The MA5 moving average below the monthly line is currently around 3170. Moreover, with the support of non-agricultural data next week, the possibility of touching around 3170 is not ruled out.
Secondly, from the weekly line chart
The weekly line is basically the same as the monthly line. The MA20 moving average below is also around 3170. So next week, I think we should focus on around 3170. The monthly line and the weekly line resonate, so the probability of touching this position is very high.
Finally, let's look at the daily chart. The daily chart shows a downward trend and the short-term support has been broken. The current support is around 3250. I think there is a high probability of a small sideways consolidation at the beginning of the week. If the market conditions are eager to change, it may rebound slightly and then continue to decline. If it falls below 3250, it will continue to fall towards 3200. If this level is broken, it may hit the low point of 3170-3175.
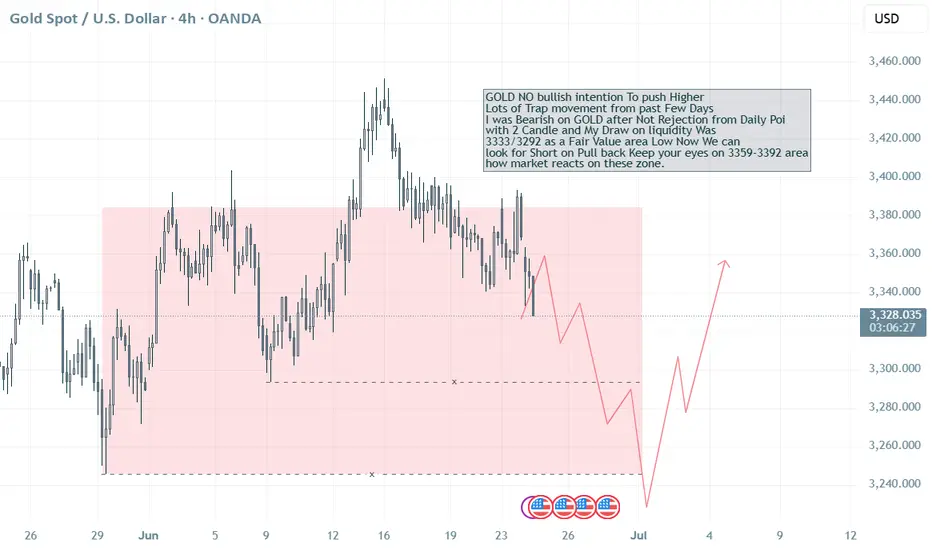
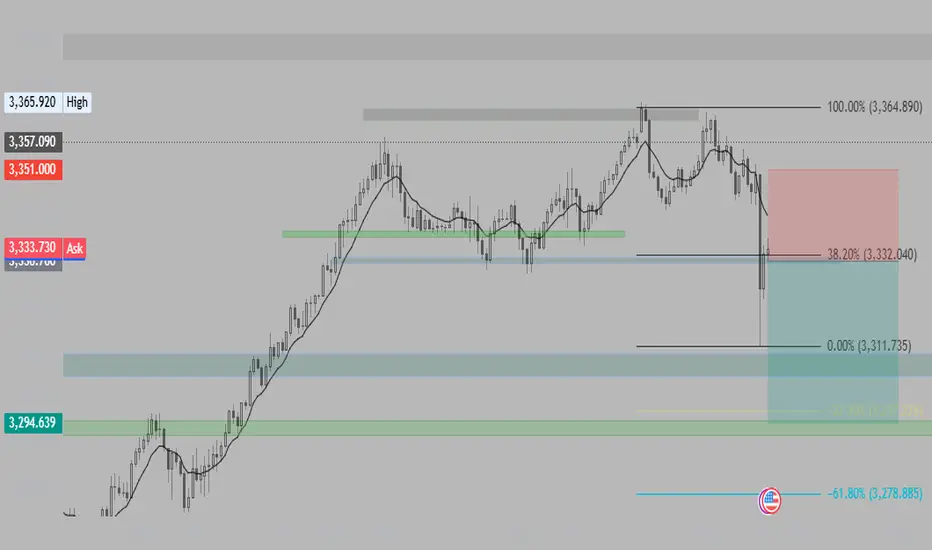
No Bullish intention on GOLD, Seller on Control? Target 3292?
GOLD NO bullish intention To push Higher
Lots of Trap movement from past Few Days
I was Bearish on GOLD after Not Rejection from Daily Poi
with 2 Candle and My Draw on liquidity Was
3333/3292 as a Fair Value area Low Now We can
look for Short on Pull back Keep your eyes on 3359-3392 area
how market reacts on these zone.
Inside My Gold Mind: Weekend Trade Log📌 Market Context / Bias
The majority of bullish price action on VELOCITY:GOLD occurred early in the week — specifically between Monday and Tuesday. From midweek through Friday, the market entered a period of consolidation, showing signs of compression.
Interestingly, despite positive economic data that favoured the USD, GOLD remained steady and resilient. This suggests underlying bullish pressure and potential accumulation.
My current bias is bullish going into the new week — with expectations of a price expansion to the upside.
🔍 Higher Timeframe Analysis
Weekly Candle: Shows early bullish expansion followed by consolidation — classic sign of absorption or reaccumulation.
Draw on Liquidity: Equal highs remain above, acting as a magnet for price.
FVGs: Price traded into a daily FVG earlier in the week and closed above it.
Order Block: Price respected a previous Bullish Order Block during Thursday’s retracement, reinforcing possible support.
🧩 Lower Timeframe Confluence
1H–4H: Price is forming relatively equal highs above the current range — potential liquidity targets.
Intraday Structure: No major shift to bearish order flow was confirmed; compression suggests a possible continuation move once expansion begins.
🧠 Fundamental Insight
Despite hawkish or strong USD fundamentals, GOLD held its ground. This divergence often precedes a strong move — likely driven by risk sentiment, upcoming Fed commentary, or global macro drivers.
🧠 Trade Plan Preview
Stay tuned for my daily updates where I’ll share:
My bias for the day
Market structure breakdown
Intraday trade plan (entry, targets, and session model)
⚠️ Reminder:
Trade with due diligence. This is not financial advice. Always align entries with your personal model and preferred session.
Thanks for your support!
If you found this idea helpful or insightful, please drop a like 👍 and leave a comment — I’d love to hear your thoughts! 🚀
Follow me for more daily price action insights and trading strategies on XAUUSD and other key markets.
Let’s grow and trade smarter together! 📈
⚠️ Disclaimer
This content is for educational and informational purposes only and does not constitute financial or investment advice.
All trading involves risk. You are solely responsible for your own decisions, so always conduct proper research and due diligence before taking any trades.
Past performance is not indicative of future results. Trade responsibly.
May your final trades of the week be precise and profitable.
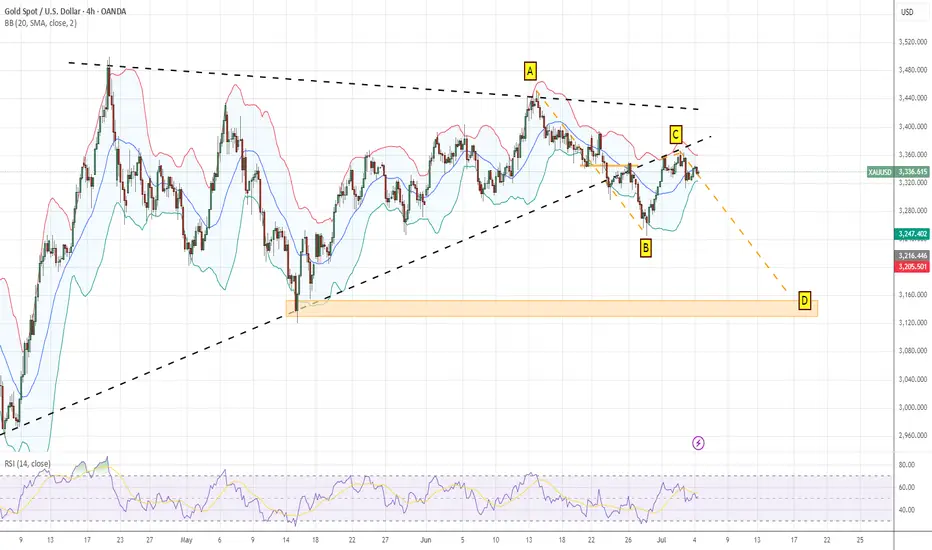
XAUUSD observationGold's current state
How should we view this?
Personal opinion:Retracement after the Triangle Convergence Breakout
Bearish expectations
The first Target is to complete AB=CD.
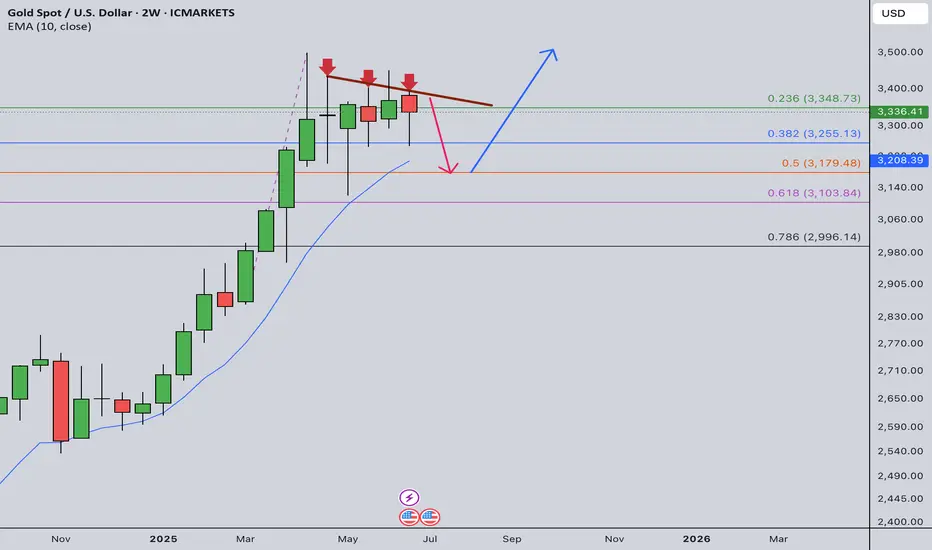
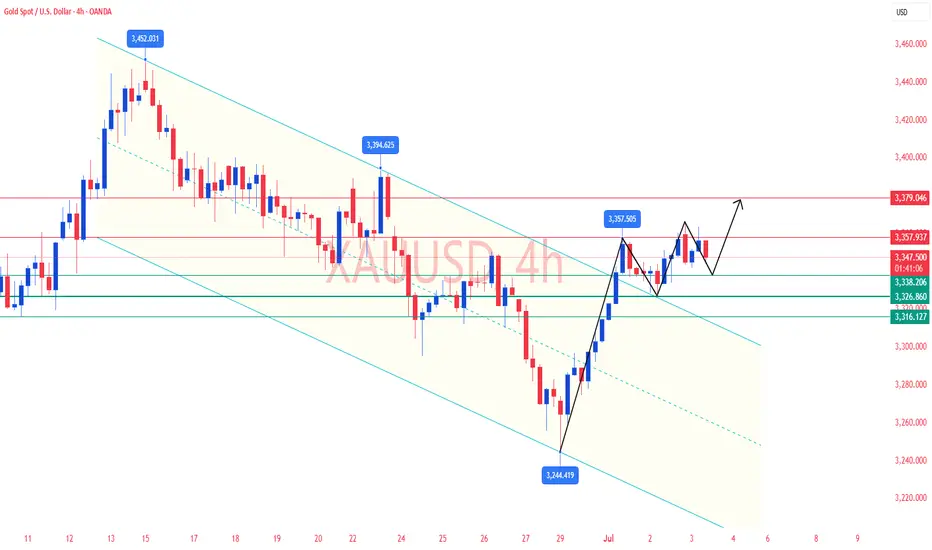
Gold Weekly Summary and Forecast 7/5/2025In my half year review, I expected next half year gold will continue its bullish drive. Overall picture shows a bullish momentum. However, the road is not straight and could be bumpy.
In 2W TF, there is a three drive pattern indicated in the chart with three red arrows. An immediate price drop will follow from this pattern. Therefore, I am expecting the price to drop to 3180 before next take off.
Next week's high is max at 3380 and could drop to 3260. Watch out the daily trading plan for more details next week.
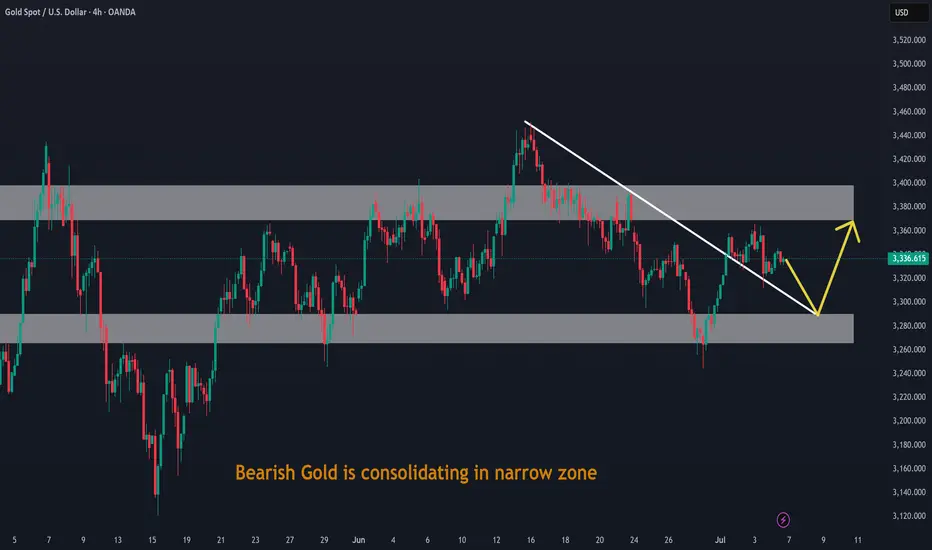
Bearish Gold is consolidating in narrow zoneBearish Gold is consolidating in narrow zone. Also it has broken Down trendline after retracing from demand zone.
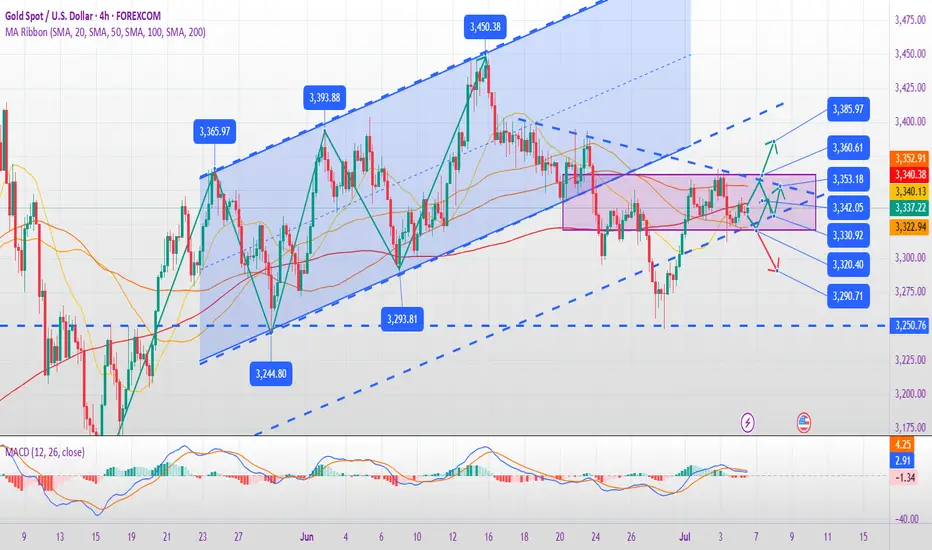
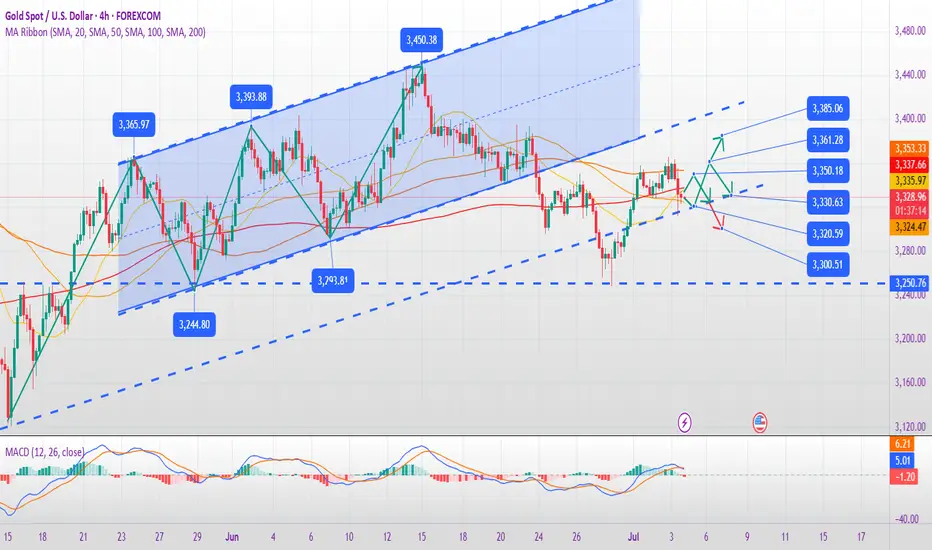
XAUUSD – Clear Sideways Movement in a Narrow Price ChannelXAUUSD is moving within a parallel price channel, fluctuating between the 3,320–3,345 zone. Both the EMA 34 and EMA 89 are running flat and close together, indicating a balanced market with no strong momentum in either direction.
Recent highs and lows have formed within a narrow range, reflecting indecision from both buyers and sellers. The latest bounce also stalled at the channel resistance, lacking the strength to break out.
As long as price remains below 3,345 and above 3,320, the sideways trend is likely to continue. During this phase, a range-trading strategy is preferred – selling near the top, buying near the bottom – while waiting for a clear breakout to determine the next directional move.
I win when I don't postLets see how it goes.
The consolidation that occurred because of the U.S holiday has led to giving buyers more power.
If not, I have a Stop Loss in place. We either win or we lose.
5th wave analysis + Market Structure support zone + Heads & shoulder(4H Timeframe) - we are currently in the right shoulder.
Risk what you can afford to lose
Analysis of the latest gold trend next week:
Analysis of gold news: Friday (July 4) coincided with the US Independence Day holiday, and gold prices were in a narrow range of fluctuations. Strong employment data not only pushed up the US dollar and US bond yields, but also significantly weakened the market's expectations of the Federal Reserve's early rate cuts, which greatly reduced the attractiveness of gold. At the same time, the US Congress passed the Trump administration's massive tax cut and spending bill, further injecting complex variables into the economy. There will be no key data to watch today. Due to the US Independence Day, all markets will close early, which will limit the fluctuation range of gold prices.
Key technical signals:
Daily level:
Range fluctuations: Gold prices repeatedly tested in the 3320-3360 range, the Bollinger band narrowed, and the MACD kinetic energy column shrank, indicating that the market was in a wait-and-see mood.
Key support/resistance:
Support: 3320 (5-day moving average), 3300 (psychological barrier + Bollinger lower track).
Resistance: 3350-3360 (non-agricultural starting point + daily middle track).
4-hour level:
Short-term bottoming signs: After the non-agricultural data, the gold price fell to 3322 and then rebounded, forming a double bottom prototype, but it needs to break through 3350 to confirm the reversal.
RSI is neutral (around 50) and may maintain a narrow range of fluctuations in the short term.
2. Next week's market deduction
1. Baseline scenario (oscillation and consolidation, 60% probability)
Trend: The gold price fluctuates in the 3320-3360 range, waiting for CPI data to guide the direction.
Operation strategy:
Short-term high-sell and low-buy:
Long order: Long at around 3320-3325, stop loss 3305, target 3350.
Short order: Short at 3350-3360 under pressure, stop loss 3370, target 3320.
2. Bullish breakthrough scenario (30% probability, CPI data required)
Trigger conditions: CPI is lower than expected (such as below 3.2%), the market re-bets on interest rate cuts, and the US dollar weakens.
Trend: After breaking through 3360, it may test 3380 (200-day moving average) or even 3400.
Operation strategy:
Break through and chase long: Follow up after stabilizing 3360, target 3380-3400.
3. Bearish breakout scenario (10% probability, need continued strength of the US dollar)
Trigger conditions: CPI is stronger than expected (such as more than 3.5%), and the Fed's hawkish remarks suppress expectations of rate cuts.
Trend: After breaking below 3300, it may test 3260 (June low).
Operation strategy:
Break through and follow short: After breaking below 3300, chase short, target 3260.
III. Trading strategy and risk management
Short-term trading (suitable for intraday positions)
Shock strategy: Buy high and sell low in the range of 3320-3360, with strict stop loss (10$-15$).
Breakout strategy: Wait for CPI data and follow the trend. If it breaks through 3360, chase longs or if it falls below 3300, follow shorts.
Mid-term layout (pay attention to the trend after CPI)
If CPI is positive: set up long orders at 3330-3340, with a target of 3400.
If CPI is negative: set up short orders at 3350-3360, with a target of 3260.
Risk warning
Liquidity risk: Speech by Fed officials (such as Powell) may trigger short-term sharp fluctuations.
Geopolitical risk: Sudden conflicts or banking crises may trigger safe-haven buying, breaking the technical logic.
4. Summary and key points
Core range: 3320-3360 (maintain the idea of oscillation before breaking through).
Long-short watershed:
Breaking through 3360 → opening up space to 3400.
Breaking through 3300 → opening a downward trend to 3260.
Analysis and strategy of the latest gold trend on July 4:
1. Non-farm data exceeded expectations, gold fell under pressure
The US non-farm payrolls data in June was strong, with 147,000 new jobs (expected 110,000) and the unemployment rate dropped to 4.1% (expected 4.3%), showing that the labor market is still resilient. This data reduced the market's expectations for the Fed to cut interest rates in the short term, leading to a strengthening of the US dollar index and US Treasury yields, and gold was under downward pressure.
Although the wage growth rate (annual rate of 3.7%) was slightly lower than expected, the overall employment data still supported the Fed's wait-and-see attitude, and gold may continue to be suppressed in the short term.
2. Technical analysis: shock adjustment, pay attention to key support and resistance
Daily level:
Gold previously stood on the middle track for three consecutive days, showing that the short-term bullish momentum was strong, but on Thursday, it closed negatively due to the negative impact of non-farm payrolls, forming a K-line with a long lower shadow, indicating that the market still has buying support.
If the 5-day moving average (near 3320) can be maintained today, it may rebound again; if it falls below the support of 3310-3300, it may further pullback.
4-hour level:
Gold is currently oscillating in the 3327-3360 range, 3345-3355 is short-term resistance, and 3310-3300 is key support.
MACD momentum weakened, RSI fell back to the neutral area, if it falls below 3310, it may test the support of 3275-3280.
3. Today's trading strategy
Short-term operation (intraday):
Long at low first, short at high later:
Long near the support level of 3320, target 3340-3350, stop loss below 3310.
Short at the resistance level of 3345-3355, target 3320-3310, stop loss above 3360.
If it falls below 3310, it may further drop to 3300-3280. You can consider shorting the trend.
Mid-term trend:
If the gold price stands above 3360, it may challenge the resistance of 3370-3400.
If it falls below 3300, it may enter a deeper adjustment, with a target of 3275-3250.
4. Market focus
Fed policy expectations: If subsequent economic data (such as CPI, retail sales) continue to be strong, gold may be further under pressure.
Geopolitical risks: The situation in the Middle East and US-EU trade frictions may still provide safe-haven support.
US dollar trend: If the US dollar index continues to strengthen, the upside space of gold will be limited.
Conclusion: Gold will remain volatile and bearish in the short term, and range trading is recommended in terms of operation.
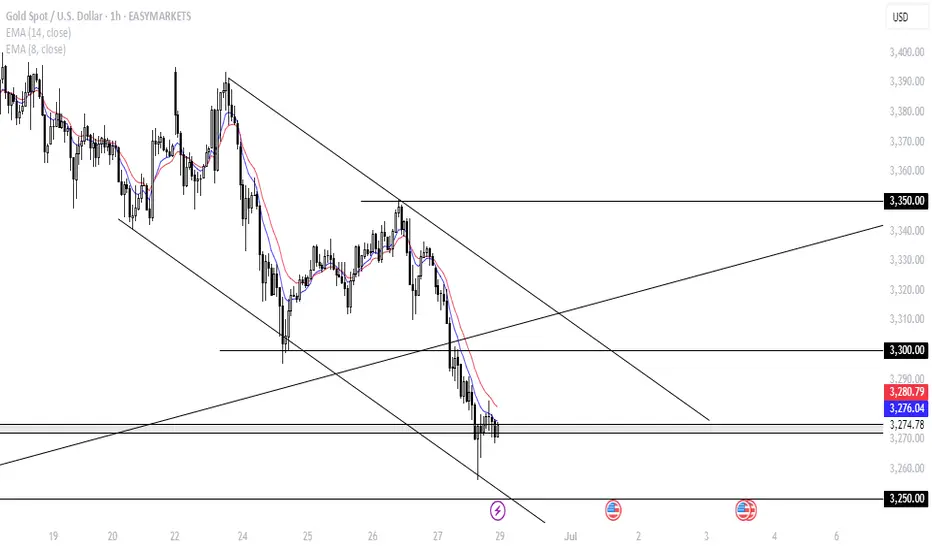
Excellent NFP sessionAs discussed throughout yesterday's session commentary: "My position: Gold is Trading within #3,350's belt which represents crossroads for the Short-term. Either #3,362.80 - #3,368.80 break-out to the upside towards #3,377.80 strong Resistance, or #3,342.80 - #3,352.80 break-out to the downside towards #3,327.80 Support. Current Price-action is ideal for Scalping since I don't expect major movement until tomorrow's NFP numbers."
Firstly I have re-Sold Gold almost all Wednesday's Asian session from #3,360's (Wednesday - Thursday) closing my orders on #3,352.80 then re-Bought Gold with set of aggressive Scalping orders from #3,345.80 towards #3,352.80. As NFP numbers were delivered, I have waited for decline to find a Support and Bought Gold aggressively from #3,312.80 and closed on #3,320.80. Later on, #3,332.80 Sold again (#4 aggressive Scalps) and closed on #3,327.80 and with mentioned order finalized excellent NFP session.
Technical analysis: The Short-term Price-action is Trading within #3,327.80 - #3,352.80 belt as I can easily spot idle movements on Hourly 4 chart with #3,327.80 Support bounces but regardless, Gold is Trading within my predicted values. Spot though on the Hourly 4 chart how Technicals are showcasing different / mixed values, and Gold is isolated within Neutral Rectangle with detectable Higher Low’s Upper and Lower zone. This is what I described on my commentary as an Bearish Divergence (BD) and is usually a first alert that the trend might be pointing to even stronger takedown. See how the very same divergence has Traded since November - April. On the November #12 Low, the Price-action started rising on an Ascending Channel but only once the structure formed a new Low. Then again after mentioned Low’s, Gold started rising until the next Bullish Divergence (which means, after local Low's tested, Gold engaged parabolic uptrend). I am monitoring closely #MA50 on Daily chart which is pointer for new #1 - #3 Month cycle.
My position: I will take no new orders as I am Highly satisfied with my returns / also it is holiday in U.S. as I do not expect major moves throughout the session (only ranging candles with Low Volume). Enjoy the Profits and have a great weekend!
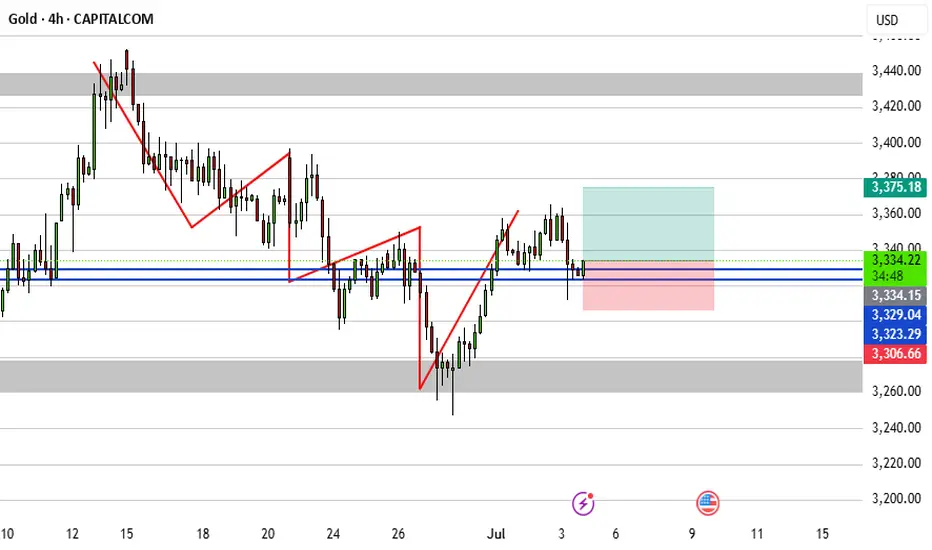
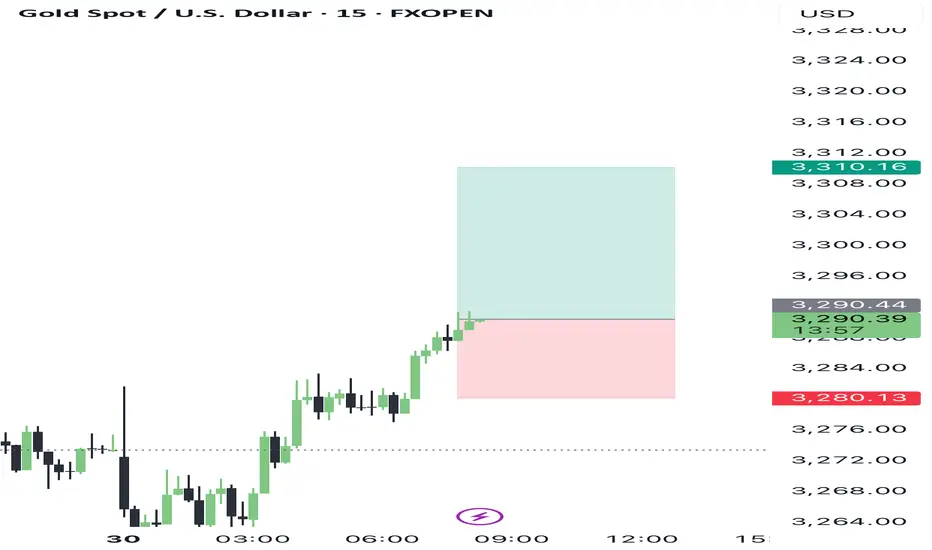
7/4: Trade Within the 3313–3346 RangeGood morning, everyone!
Yesterday’s intraday trades delivered solid profits. Since the U.S. market will be closed today, news-driven volatility is expected to be limited. Therefore, today’s trading focus will primarily revolve around technical setups.
Current structure:
Key support: 3321–3316
Immediate resistance: 3337–3342, followed by 3360
If support holds and resistance breaks, a potential inverse head-and-shoulders pattern may form on the 4H chart, with the next target near 3380
If support breaks, focus shifts to the 3303–3289 support zone
Given the likelihood of range-bound price action today, the suggested intraday range is 3313–3346, with a preference for selling near resistance and buying near support.
If an upside breakout occurs, consider using the MA20 on the 30-minute chart as a guide for pullback entries.
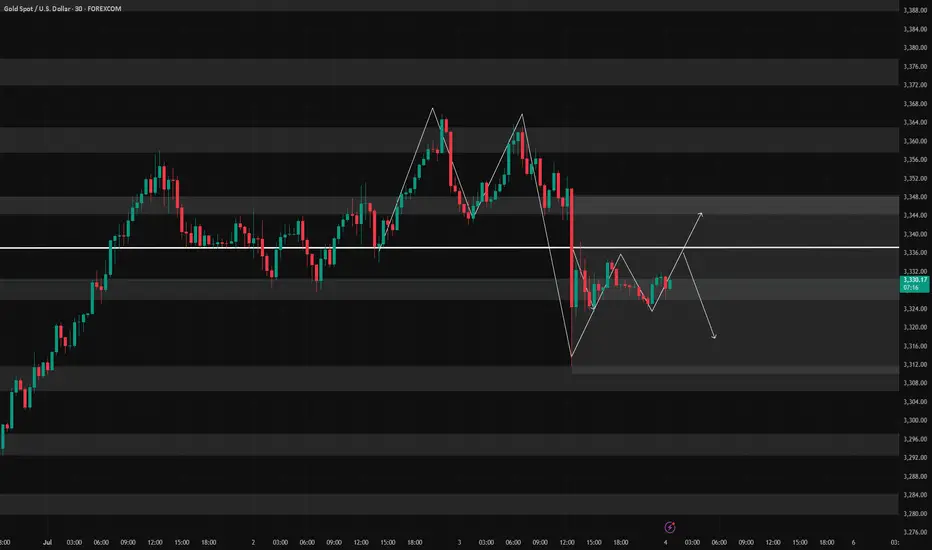
NFP unexpectedly broke out, where will gold go?📰 News information:
1. Initial jobless claims and NFP data
2. The final decision of the Federal Reserve
📈 Technical Analysis:
The unexpectedly negative NFP data caused a sudden plunge in gold prices, which forced me to terminate the transaction urgently. Currently, gold has not fallen below the 3,300 mark. Therefore, I will still pay attention to the closing of the hourly line. If gold closes below 3,320, the downward trend will continue. On the contrary, if it closes above 3,320, gold will consolidate at a high level in the short term. Two days ago, I gave the support level of 3315-3305 below. Please be cautious in trading at the moment.
🎯 Trading Points:
For now, let’s focus on the hourly closing situation
In addition to investment, life also includes poetry, distant places, and Allen. Facing the market is actually facing yourself, correcting your shortcomings, confronting your mistakes, and strictly disciplining yourself. I hope my analysis can help you🌐.
TVC:GOLD OANDA:XAUUSD FX:XAUUSD FOREXCOM:XAUUSD PEPPERSTONE:XAUUSD FXOPEN:XAUUSD
SHORT XAUUSD IDEABullish NFP results
Bearish PA
Target 3295
Depending on 30 m PA if we close below prv candle, entry to previous long wick and retest the latest low
Gold Analysis and Trading Strategy | July 3✅ Fundamental Overview:
The U.S. ADP employment data released on Wednesday came in significantly below expectations, with only -33,000 new jobs added, far short of the market forecast of 100,000. This raised concerns about a potential slowdown in the U.S. labor market and strengthened expectations for Fed rate cuts later this year. As a result, gold prices rose by $18.2 during the session.
✅Today’s primary focus shifts to the U.S. Non-Farm Payroll (NFP) report. Market expectations are as follows:
🔹New jobs added: 110,000 (previous: 139,000)
🔹Unemployment rate: Expected to rise to 4.3%
🔹Average hourly earnings: Also closely watched for inflation implications
If the actual data falls significantly short of expectations, especially if job growth is below 100,000 or the unemployment rate exceeds 4.3%, this would likely reinforce rate cut expectations, driving gold to break above key resistance levels and extend its rally.
Conversely, if the data beats expectations, the market may scale back its rate-cut bets, supporting the U.S. dollar and putting downward pressure on gold prices. In this case, a pullback in gold should not be ruled out.
✅ Technical Analysis:
🔴Key Resistance Levels: 3358 is the major short-term resistance. A firm breakout and hold above this level could open the path toward the psychological barrier at 3400.
🟢Key Support Levels: 3320 serves as a critical short-term support. If it breaks, gold may test the $3300 level next, with further downside support at $3246.
✅ Trading Strategy Suggestions:
🔸 Aggressive Strategy (Pre-NFP Participation):
🔰If gold pulls back to the $3340–3345 range during the European session, consider small long positions. and look for targets at $3360–3380. If the NFP data is bullish for gold, there’s potential for a move toward $3400.
🔸 Conservative Strategy (Post-NFP Reaction):
Wait for the NFP data to be released and trade based on the market's immediate reaction:
🔰If gold breaks above $3358, consider buying the breakout, targeting $3400.
🔰If gold drops below $3320, short-term downside targets are $3300 and possibly lower.
✅ Key Factors to Watch in the NFP Report:
🟠Whether job creation is significantly below expectations (e.g., <100k)
🟠Whether the unemployment rate exceeds 4.3%
🟠The pace of wage growth and its impact on inflation expectations
✅If the data disappoints across the board, gold may extend the strength seen after the ADP report, breaking through $3370 and testing $3400. However, if the data comes in stronger than expected, be prepared for a potential pullback to $3300 or even lower.
🔥If your recent trading results haven’t been ideal, feel free to reach out. I’d be happy to help you avoid common pitfalls and improve your performance. I will provide real-time strategy updates during market hours based on price action — stay tuned🤝
XAUUSD:A long trading strategy
The highest gold price in the Asian session reached 3365.4, which is already our mid-line target range. If you have completed and left the market, congratulations, because I personally set the TP point of 3368, so it did not touch, the trend of the past two days is appropriate rewithdrawal after strengthening, the high is also gradually rising, the overall long trend has not changed. For today's data, the probability will make gold prices continue to rise, trading ideas or to do the main.
Trading Strategy:
BUY@3347-51
TP:3365-70
This TP range is also the target range of the median trader, for friends who do not have automatic stop profit, you can take a profit manually at that time.
More detailed strategies and trading will be notified here ↗↗↗
Keep updated, come to "get" ↗↗↗
Report - 3 jully, 2025European High-Yield Market Surge: Record Issuance and US Outflows
In June, the European high-yield (junk bond) market shattered records, with issuance climbing to €23 billion — surpassing the previous high set in June 2021 by around €5 billion. The number of deals also reached an all-time record at 44, according to PitchBook. This sharp increase reflects a significant investor shift away from US credit markets due to rising fears over President Trump’s erratic trade policies and surging US borrowing needs.
Many investors, spooked by the unpredictability of US tariff measures and ballooning fiscal deficits, have sought relative stability and yield in European credit. The dollar’s slide to its weakest start in more than 50 years has further accelerated the move. European high-yield bond funds have seen seven consecutive weeks of inflows, per Bank of America data, highlighting this shift.
Falling Borrowing Costs and Issuer Revival
Amid the influx of capital, borrowing costs for risky European corporates have dropped sharply. High-yield spreads over government bonds fell from more than 4 percentage points in April to 3.1 percentage points by end-June (ICE BofA data). Companies previously shut out of the market — including CCC-rated issuers — have seized this window.
Flora (a KKR-owned plant-based spread producer) successfully issued €400 million in bonds at 8.625%, roughly 4 percentage points below comparable past debt. Czechoslovak Group issued five-year euro and dollar bonds at 5.25% and 6.5%, significantly lower than its last 11% private credit deal. Even Carnival, the cruise operator historically forced to borrow at double-digit rates, tapped markets with €1 billion of bonds at just 4.125% to refinance dollar debt.
The surge illustrates investor appetite for yield amid declining US bond market appeal. It also reflects a "risk-on" environment, with managers eager to deploy cash before spreads tighten further. As one investor noted, “The market is running red hot,” signaling both opportunity and potential for overheating risks if economic conditions shift abruptly.
UK Gilt Market Turbulence Amid Political Instability
In the UK, gilts (government bonds) saw sharp sell-offs as political turmoil erupted over fiscal policy. Chancellor Rachel Reeves' emotional House of Commons appearance, combined with Prime Minister Starmer’s failure to back her publicly, deepened concerns over fiscal discipline.
The yield on 10-year gilts surged by 0.16 percentage points to 4.61% — the largest one-day jump since April's bond rout. The pound slid 1.2% against the dollar. Investors now question whether fiscal rules will be maintained, especially after a £5 billion welfare reform U-turn blew a hole in budget plans.
Market fears center on the possibility of rising deficits and increased borrowing costs, which could feed into longer-term inflation expectations. This uncertainty underscores the importance of policy credibility and communication in maintaining investor confidence.
UK Trade Frictions: PEM Blockage
In trade, the UK’s bid to join the Pan-Euro-Mediterranean (PEM) convention to help exporters simplify supply chains post-Brexit has been blocked by Brussels. EU officials worry the move could allow UK goods unfair tariff access into the EU.
This development underlines ongoing post-Brexit friction despite recent attempts to "reset" relations. UK exporters, especially in manufacturing and automotive sectors, will continue facing higher costs and administrative burdens, reducing competitiveness against EU-based producers.
Security Risks: Oil Tanker Attacks Raise Tensions
A spate of limpet mine attacks on oil tankers in the Mediterranean and Baltic Sea this year has unnerved global shipping and energy markets. Recent explosions on vessels linked to Russian and Libyan ports — including last week’s attack on the Greek-owned Vilamoura — suggest sophisticated sabotage campaigns, with Ukraine among the suspected actors.
These incidents highlight vulnerabilities in global oil supply chains, potentially pressuring insurance costs and freight rates. For energy markets already sensitive to Middle Eastern conflict, this raises additional geopolitical risk premia.
Vietnam-US Trade Agreement: A Mixed Signal
Vietnam has agreed to a 20% baseline tariff on exports to the US, significantly reduced from an initial 46% but still above pre-2024 levels. The agreement, struck during a direct call between Trump and Vietnam’s Communist Party leader, aims to curb trans-shipment practices and open Vietnamese markets to US goods at zero tariff.
This deal alleviates immediate trade tension but raises questions for other Asian countries. If Vietnam’s "compromise" becomes a template, it suggests Trump's administration is willing to impose steep tariffs unless nations quickly accede to US demands. Investors should monitor supply chains reliant on Southeast Asia, as new tariff dynamics could disrupt manufacturing flows and costs.
Basel IV and Defence Spending Concerns
Deutsche Bank’s warning that new capital rules (Basel IV) could choke funding to smaller defence suppliers in Europe underscores a conflict between financial stability and geopolitical security. Rising risk-weighted assets (RWAs) could dampen lending capacity, limiting efforts to scale up European arms production at a time of heightened security threats.
Deutsche estimates its RWAs could climb by €63 billion, dragging its CET1 ratio down to 10.4% — below current targets. The shift to more standardized risk models could reduce flexibility for lending to Mittelstand firms crucial to Germany's defence supply chain.
US Banks: Shareholder Returns Surge Amid Softer Regulation
After passing a more lenient Federal Reserve stress test, major US banks like JPMorgan, Goldman Sachs, and Bank of America announced large increases in dividends and share buybacks. JPMorgan authorized up to $50 billion in buybacks; Goldman hiked its dividend by 33%.
These actions reflect stronger capital positions and a regulatory environment favoring investor returns over capital buffers. While this supports stock valuations in the near term, it raises longer-term questions about systemic resilience, particularly if economic conditions deteriorate or credit losses rise unexpectedly.
Microsoft: Workforce Cuts Reflect AI and Cost Discipline
Microsoft announced another 9,000 job cuts, totaling over 7% of its global workforce this year. The reductions align with efforts to manage costs amid heavy AI infrastructure investment and economic uncertainty.
Despite strong AI-driven growth, big tech firms are signaling a shift toward leaner operations. This move suggests a maturing of AI monetization strategies, with potential headwinds for labor markets in software and tech-adjacent roles.
France and Europe: Critical Minerals Independence Drive
French-led projects to reduce rare earths dependence on China are gaining momentum but face scale limitations. EU initiatives, like Solvay’s reactivation of La Rochelle and MagREEsource’s magnet projects, signal gradual progress. However, Europe still imports 98% of its rare earth magnets from China, and output remains modest relative to demand.
Industrial groups should prepare for continued supply chain fragility and consider diversification or stockpiling strategies. Policy support and premium pricing for local production will be critical to success.
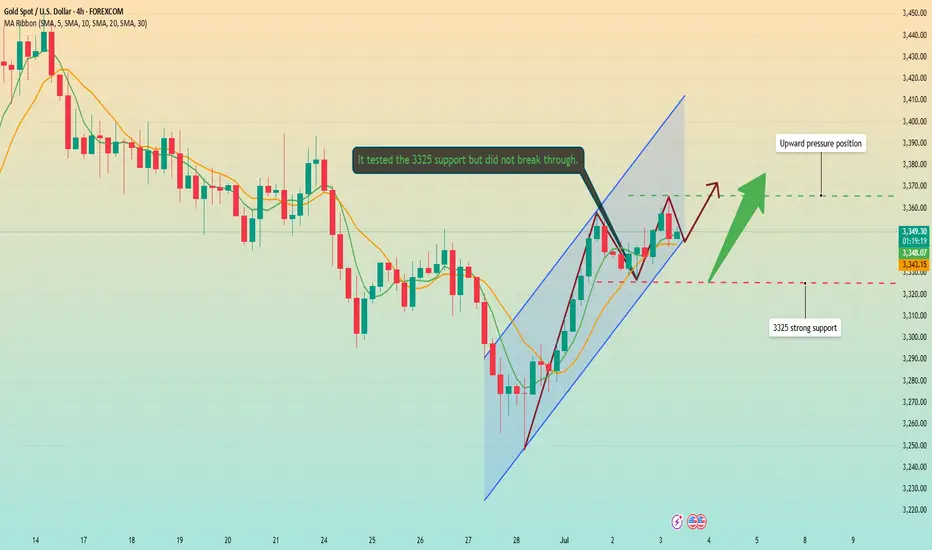
Non-farm data is coming. Upward breakthrough?Information summary:
ADP data supports the rise of gold. Secondly, the weaker-than-expected non-farm data has triggered people's hope that the Federal Reserve will cut interest rates earlier. The gold price hit the 3360 mark, then fell back slightly, and is currently fluctuating around 3350.
This Friday is the Independence Day holiday in the United States. The non-farm data will be released on Thursday. Today, we will focus on this data, which will trigger a new trend.
Market analysis:
From the 4-hour chart, gold is currently in a suppressed state. However, it is not ruled out that it will be supported at the bottom as before, and then break through the upper suppression position again with the help of non-farm data.
Therefore, the most critical position today is not above, but near the support of 3325 below. On Wednesday, the support near 3325 was tested many times but did not break down. If the price remains above this position today, the probability of an upward breakthrough is very high.
Based on the current market conditions and the data to be released soon, Quaid recommends that everyone wait and see for a while and wait for the new trend to come. Of course, according to the current forecast data, this will support the rise of gold. A radical approach can also try a long strategy around 3345.