Report - 1 jully, 2025Global Macro & Currencies:
The US dollar has experienced a historic slide in 2025, falling about 10% year to date — its worst first half since 1973. This dramatic weakness has been driven by a combination of political and economic factors: mounting concerns over the fiscal path under President Trump, ballooning debt loads fueled by aggressive tax cuts, and worries about the independence of the Federal Reserve as markets increasingly price in multiple rate cuts. Additionally, erratic tariff policies and renewed trade tensions have further undermined the dollar’s role as a global safe haven.
While many expected the dollar to strengthen as the US economy outperformed and global risks rose, the opposite has occurred. Instead, European currencies have surged: the euro has climbed nearly 10% against the dollar this year, and sterling has gained almost 9%. Meanwhile, the Japanese yen has remained under pressure, but there are signs that safe-haven flows may soon stabilize it, given rising geopolitical tensions and global volatility.
From a practical investment perspective, the weaker dollar provides a strong tailwind for US multinational corporations with significant overseas revenues. It also supports commodity prices broadly, as seen in gold trading near record highs at around $3,289 per ounce. Investors should consider increasing allocations to hedged international equities or adding European equity exposure, where currency gains can further enhance returns. Moreover, actively hedging USD exposure in global portfolios becomes increasingly important to protect against continued weakness and further policy surprises.
Equities & Sector Rotation Analysis:
US equities have staged a strong comeback in Q2, with the S&P 500 rising 10% in the quarter and hitting record highs. This recovery is largely driven by expectations of lower interest rates, robust corporate earnings, and renewed enthusiasm for technology and AI-focused stocks. Companies like Nvidia continue to lead, with massive gains fueled by AI infrastructure spending and optimism around future growth.
Interestingly, this rebound has narrowed the performance gap with European markets. Earlier in the year, investors rotated into European equities on hopes of fiscal stimulus and infrastructure spending, particularly Germany’s €1tn “whatever it takes” plan. While European stocks still slightly outperform on a year-to-date basis (+7% vs. +5% for the S&P 500), the momentum has clearly shifted back to the US as growth data and earnings resilience support valuations.
Sector-wise, leadership has again become narrow, with technology, communications, and financials outperforming while defensive sectors such as utilities and real estate lag. This suggests a renewed preference for growth and cyclicals over defensive positioning, at least in the short term. Small-cap stocks continue to underperform, reflecting persistent macro uncertainties and a flight to quality.
For investors, this implies a tactical tilt toward large-cap US growth and tech names could still deliver relative strength, but caution is warranted as valuations stretch and volatility could resurface with upcoming tariff decisions and geopolitical risks. European exposure remains attractive for diversification, especially if fiscal initiatives translate into stronger earnings growth, but conviction in execution is needed.
Fixed Income & Yield Curve Dynamics:
In fixed income markets, US Treasury yields have moved lower across the curve, with the 10-year yield dropping to 4.20% after peaking above 4.8% earlier this year. This decline reflects growing market conviction that the Federal Reserve will start cutting rates in September, with futures pricing in as many as five quarter-point cuts through 2025.
The recent dovish pivot by the Fed has significantly improved risk sentiment, driving demand for longer-duration assets. We see strong gains in 20+ year Treasuries (+1.0% on the day), while intermediate and short-term Treasuries have also rallied. The overall move has flattened parts of the curve, suggesting that while markets anticipate lower rates, growth concerns remain, especially as fiscal worries and debt sustainability questions persist.
Globally, yields are following a similar downward trajectory. UK gilts and German bunds have eased, as investors bet on further easing amid weaker economic data and a more cautious ECB stance. In Europe, inflation has cooled below the 2% target, supporting expectations of one more ECB cut before year-end, even as policymakers remain wary of structural inflation risks (like AI-driven wage pressures and supply chain fragmentation).
Credit spreads in US corporate bonds have remained tight, indicating strong appetite for risk despite macro uncertainties. High-yield and investment-grade bonds have both benefited from this supportive backdrop. Meanwhile, emerging market debt has rallied, helped by the weaker dollar and lower global rates, attracting inflows into local currency debt.
For investors, extending duration looks tactically appealing as rate cuts approach, but we remain cautious about heavy exposure to the long end given potential volatility from fiscal developments and geopolitical shocks. Credit remains attractive selectively, with opportunities in high-yield and EM debt, especially for investors looking to capture carry in a lower-rate environment.
Currencies & Dollar Dynamics:
The US dollar has experienced its worst start to a year since 1973, dropping over 10% year-to-date. The dollar index, which tracks it against a basket of major currencies (including the euro, yen, and pound), has fallen sharply as global investors reassess their exposure to the greenback amid Trump’s erratic trade policy, a ballooning fiscal deficit, and concerns over Fed independence.
The immediate trigger has been the combination of rising fiscal risks from Trump's proposed tax bill — expected to add $3.2 trillion to debt over the next decade — and expectations for aggressive Fed rate cuts. The perception that US economic exceptionalism might wane has undermined dollar demand as a safe haven.
The euro has benefited the most, climbing more than 13% to over $1.17 — defying earlier forecasts of a decline to parity. Meanwhile, the pound has gained nearly 9%, supported by relative political stability and a resilient labor market. The Japanese yen has strengthened as well (+12.6% YTD), despite traditionally dovish Bank of Japan policies, with investors treating it as a safe haven amid global trade uncertainty.
In emerging markets, a weaker dollar has lifted currencies and supported local debt. Brazil’s real, Mexico’s peso, and South Korea’s won have all rallied, reflecting strong investor appetite for higher-yielding assets.
However, caution is warranted: with the dollar’s sharp decline becoming a crowded trade, some technical consolidation is likely in coming weeks. We believe the dollar’s longer-term trend remains bearish but anticipate near-term volatility as markets recalibrate positions and digest fiscal developments in the US.
Investors should continue hedging dollar exposures and consider selectively increasing allocations to EM currencies and euro-denominated assets, which stand to benefit from continued dollar softness and potential European growth stabilization.
XAUUSDK trade ideas
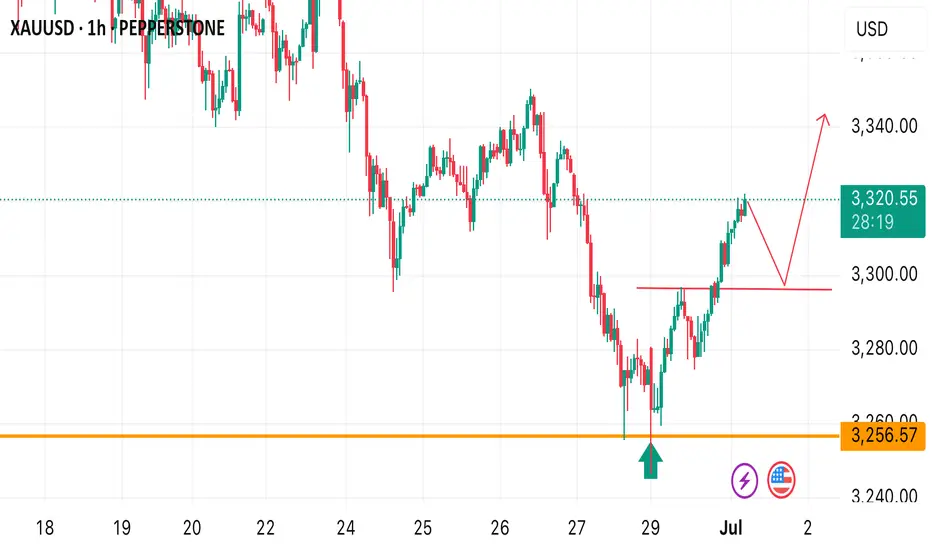
XAUUSD POSSIBLE BUY OPPORTUNITY Price rebounded around the 3256.57 finding a support at that price level. From the H1 timeframe, a pull back to 3296.56 provides a buy opportunity. Keep watch on gold for a potential bullish move!
OVERALL BEARISH TREND ON GOLD FOR THE WEEK There is an overall bearish Trend on Gold, but the Price will retrace upwards to take out a level of inducement, which is the pullback after the break of the structure and also clear the liquidity at the previous high that was created last week on the high timeframe. So you can still get a retacement to buy on h1 to clear those levels/areas. Although the main trend is bearish
Gold set up playing wellExpecting price to retrace to the zone playing out well
Follow for more ideas
xauusdGold enters support by reaching daily trend line
If gold continues to hold support
Gold is expected to reach its previous high again
Gold 1H: Potential Rejection or Continuation PlayGold (XAUUSD) Technical Outlook – 1H Timeframe
Price is currently reacting near 3275, with a potential scenario for either a bullish continuation toward the 3287–3290 zone or a rejection that could push the market back down toward the 3250–3245 support area.
Key levels to monitor:
🔹 Resistance: 3287–3290
🔹 Mid-support: 3270
🔹 Lower support: 3250–3245
I will wait for price confirmation around these levels before considering new entries.

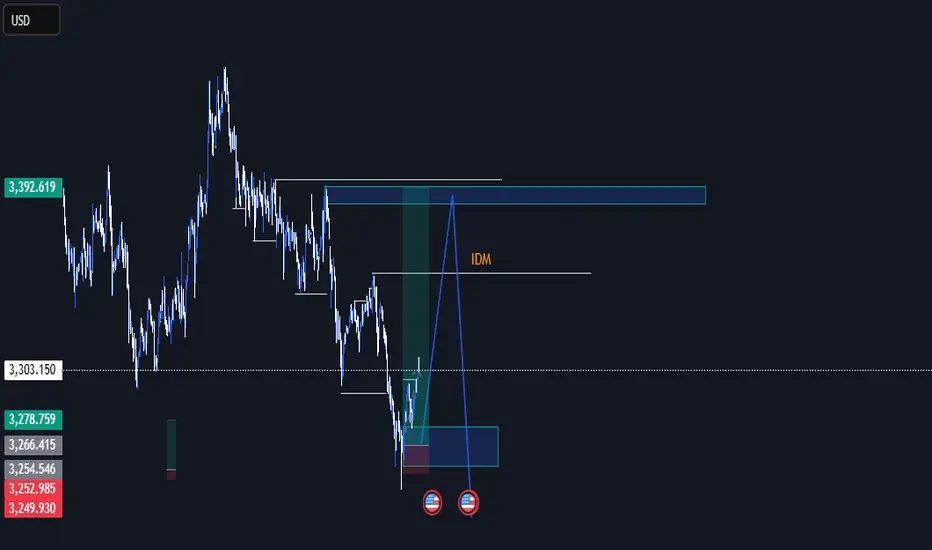
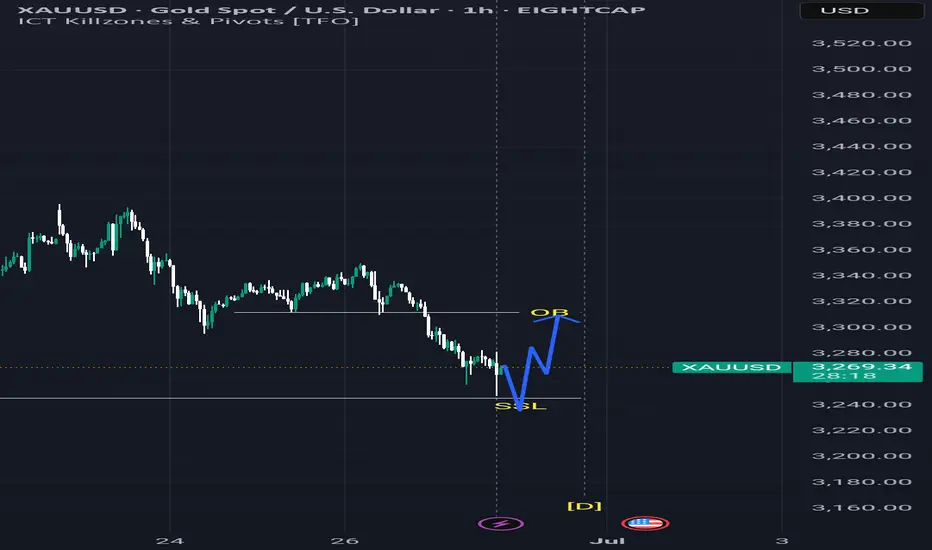
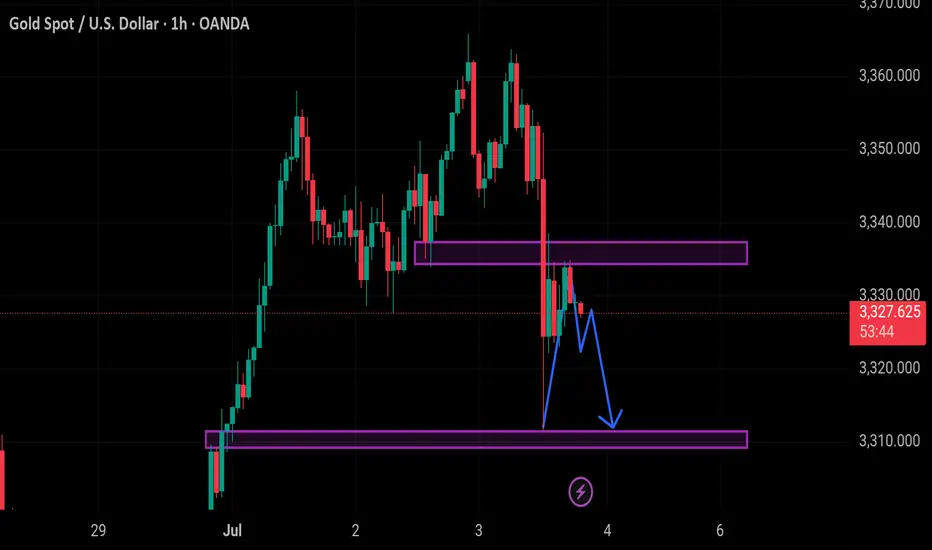
XAUUSD June 29,2025🟦 XAUUSD Analysis – June 29, 2025
Market Structure:
Price is in a bearish trend on the 1H timeframe.
Liquidity is resting below a recent low around $3,240 (Sell-Side Liquidity – SSL).
There is a visible Order Block (OB) around $3,310–$3,320, which could act as a magnet if price reverses.
Anticipated Move (Blue Path):
1. Price is expected to drop below the SSL to trigger stop-losses and collect liquidity.
2. After the liquidity grab, a bullish reversal is likely.
3. Price may then rally toward the OB, which could act as resistance or a point for institutional selling.
---
🔎 Probability Breakdown:
Event: Break below SSL (~$3,240)
Likelihood: ✅ High
Note: Classic liquidity grab setup
Event: Bullish reversal after sweep
Likelihood: ⚠️ Moderate–High
Note: Wait for confirmation (BOS, FVG, bullish candle)
Event: Rally to OB (~$3,310–$3,320)
Likelihood: ⚠️ Moderate
Note: Depends on bullish structure forming
Event: Rejection from OB
Likelihood: ✅ High
Note: OB may act as supply zone
---
⚠️ Caution:
This scenario is only valid if price grabs SSL first.
No entry should be made without a proper bullish confirmation (e.g., break of structure, fair value gap fill, or strong bullish candle).
Always use risk management – this is a hypothetical setup, not financial advice.
---
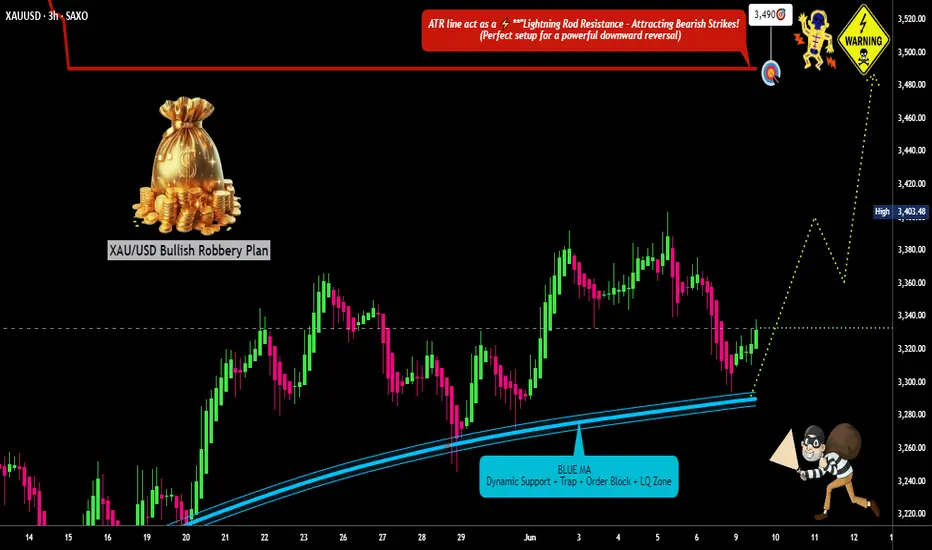
"The Great Gold Heist" – XAU/USD Master Plan🏆 "The Great Gold Heist" – XAU/USD Master Plan (High-Risk, High-Reward Loot!) 🚨💰
🌟 Attention, Market Robbers & Money Makers! 🌟
Hola! Oi! Bonjour! Hallo! Marhaba! 🤑💸
🔥 Based on the legendary Thief Trading Strategy (technical + fundamental heist tactics), here’s our blueprint to STEAL massive profits from the XAU/USD (Gold vs. Dollar) market! 🔥
🎯 The Heist Plan (Long Entry Setup)
Entry Point 📈: *"The vault is UNLOCKED! Swipe bullish loot at any price—but for a cleaner steal, set Buy Limits within 15-30M recent swing lows/highs. ALERT UP! ⏰"*
Stop Loss 🛑: "Thief’s SL hides at the nearest swing low (3H TF: 3250.00) OR below the last daily candle wick. Adjust based on your risk appetite & lot size!"
Target 🏴☠️: 3490.00 (or escape early if the cops—err, bears—show up!)
⚡ Scalper’s Quick Loot Guide:
"Only scalp LONG! Rich? Go all-in. Broke? Join the swing traders & rob slow ‘n’ steady. Use Trailing SL to lock profits!"
📊 Market Status:
XAU/USD (GOLD) – Neutral (But Bullish Sneak Attack Likely! 🐂💥)
"The heist is ON, but watch for traps—overbought zones, consolidation, and bearish robbers lurking!"
🔍 Pro Thief Moves:
✅ Fundamentals Matter! (COT Reports, Geopolitics, Macro Data, Sentiment—check our BIO0 for the full loot list!) 🔗👉🏻☝🏻
✅ News = Danger! Avoid new trades during releases. Trail your SLs to protect stolen cash! 📰🚨
💖 Support the Heist Crew!
"Hit the BOOST BUTTON 💥 to strengthen our robbery squad! More boosts = easier money steals daily!"
🚀 Stay tuned—another heist drops soon! 🐱👤💎
Gold Will recover Next weekWaiting for a Three bullish candlesticks to take our buy next week , be ready on londay or wednesday for high probability win
Technical Overview (Daily Time Frame) - GOLDTVC:GOLD
HELLO TRADERS
Let's start...
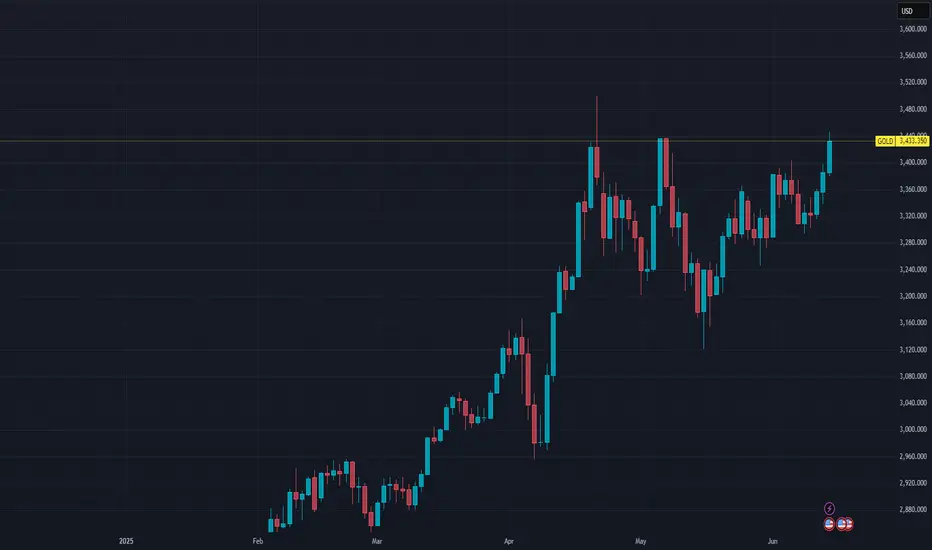
✅ Trend Structure:
The overall structure is bullish, with higher highs and higher lows from March onward.
Price has recently broken out of the consolidation zone and is now trading at $3,443, approaching a key resistance zone.
📏 Key Levels:
Immediate Resistance: $3,480 – $3,500 (previous highs from April)
Major Resistance: $3,560 – $3,600
Immediate Support: $3,360 – $3,320 (former range highs)
Major Support: $3,240
📊 Candlestick Signal:
The last few candles show strong bullish momentum and increasing range, indicating breakout strength.
📈 Scenario 1: Buy Setup (Breakout Continuation)
Entry: Buy at $3,450 – $3,460 (After being sure for no more rejection at 3,440-3,450)
Stop Loss (SL): $3,410
Target Price (TP):
TP1: $3,480
TP2: $3,500 (near-term resistance)
TP3: $3,550 (April swing high)
TP4: $3,600 (Geopolitical ,psychological and Fibonacci extension level)
📌 Reason: Momentum breakout of previous consolidation. Entering on strength with a pullback toward breakout retest is safer.
📉 Scenario 2: Sell Setup (Fake Breakout / Rejection)
Trigger: Only if there's a daily close below $3,400 or a strong rejection candle
Entry: Sell below $3,400
Stop Loss (SL): $3,455
Target Price (TP):
TP1: $3,360
TP2: $3,320 (previous support area)
TP3: $3,280
📌 Reason: Rejection at resistance may lead to short-term correction or liquidity sweep before higher move.
📌 CAREFULL: Classic “breakout and retest” setup. Safer than chasing highs. i.e. BUY setup safer than SELL setup.
GOOD LUCK
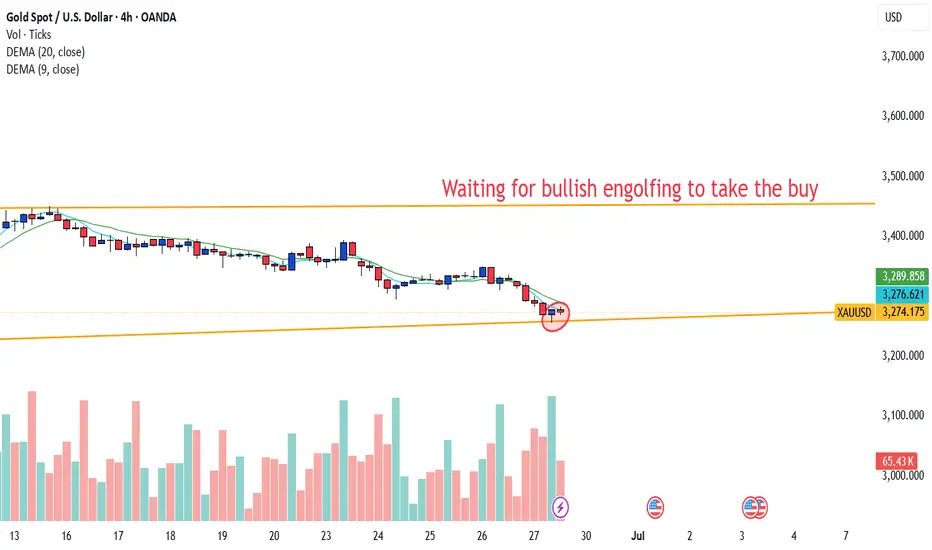
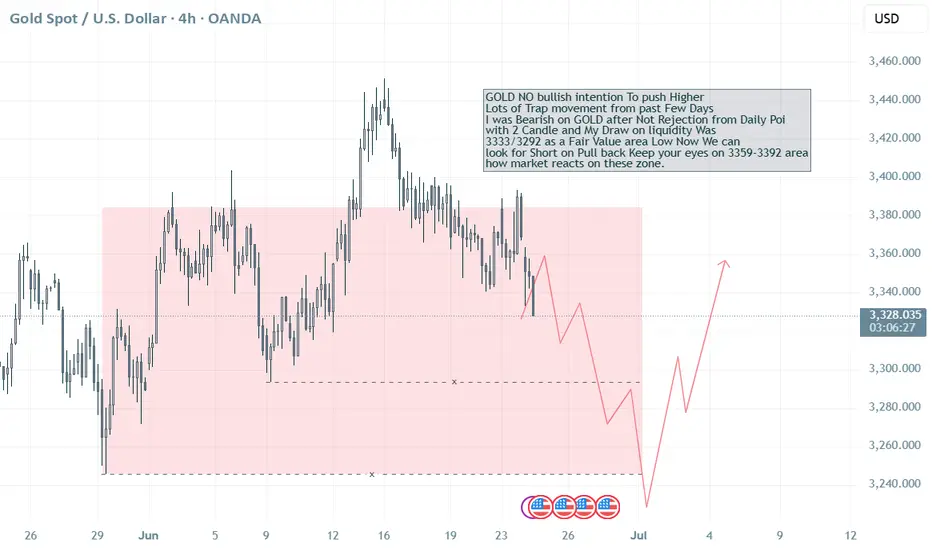
No Bullish intention on GOLD, Seller on Control? Target 3292?
GOLD NO bullish intention To push Higher
Lots of Trap movement from past Few Days
I was Bearish on GOLD after Not Rejection from Daily Poi
with 2 Candle and My Draw on liquidity Was
3333/3292 as a Fair Value area Low Now We can
look for Short on Pull back Keep your eyes on 3359-3392 area
how market reacts on these zone.
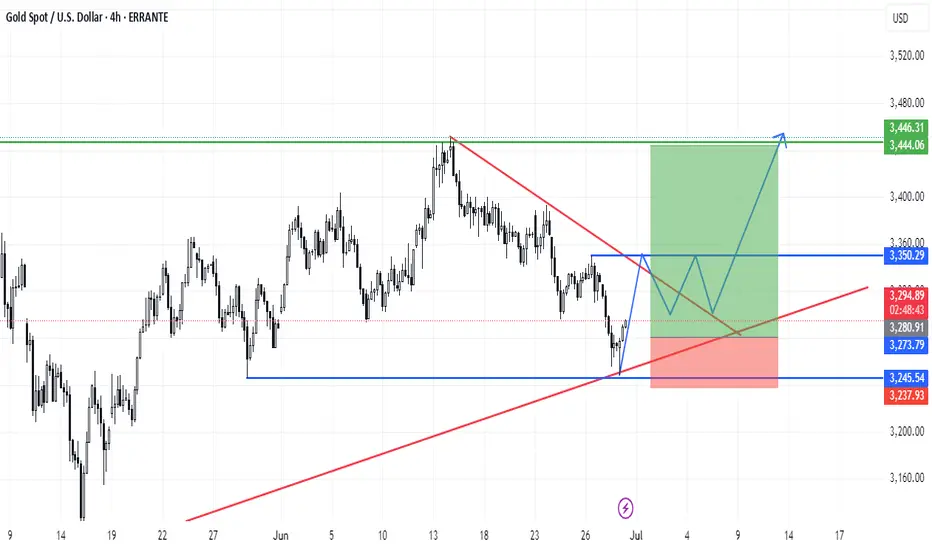
XAUUSD (Upcoming Plan with 2 Scenarios) Analysis for the upcoming week (InShaaAllah) (2 Scenarios)
Breaking: Trump says tariff letters to 12 countries signed, going out Monday...
XAUUSD (GOLD): Buy setupXAUUSD (GOLD): Buy setup. check for 5m candle close and buy when the level is broken.
Cheers.
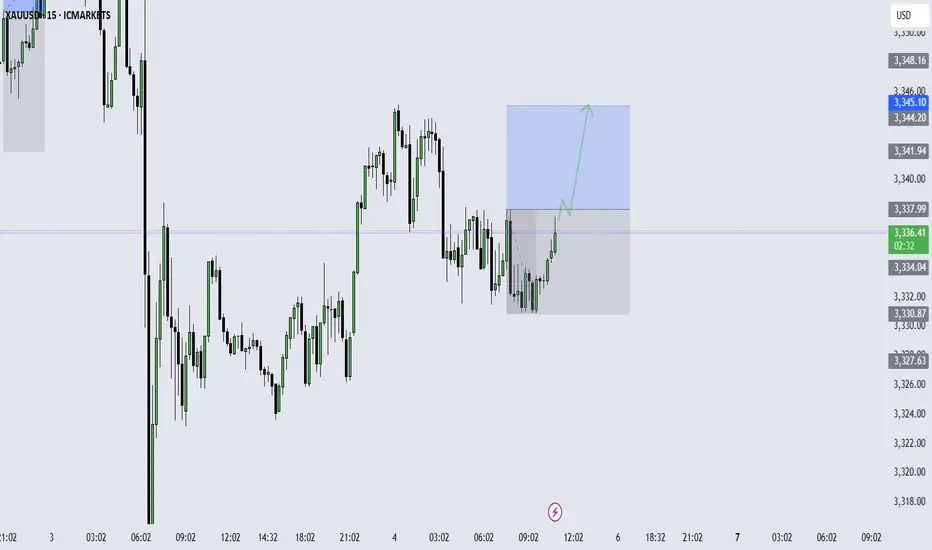
Gold lacks downward momentum.Today, gold is relatively quiet due to the impact of the US Independence Day holiday. Below, we continue to pay attention to the short-term quality layer of 3324. The key pressure above is maintained at yesterday's opening point of 3345-50. At midnight, gold rebounds near 3345-50 and can be shorted. The target is around 3330-33. It closes early at midnight and maintains a range of fluctuations! If your current gold operation is not ideal, I hope I can help you avoid detours in your investment. Welcome to communicate!
From the 4-hour analysis, pay attention to the support of 3324-30 below, focus on the support position of 3316, and pay attention to the short-term resistance of 3345-50 above. At midnight, the overall high-altitude low-multiple cycle participation remains unchanged. In the middle position, watch more and move less, be cautious in chasing orders, and wait patiently for key points to participate.
Gold?
Hi
Do you have a crystal ball? I do.. haha
You should rub/shine it frequently. Nahh.. just a joke.
I will call it : a prediction or bias.(That I hold , till proven wrong)
Look at weekly; formed 1 bar bullish , was taken/ broken low by 2 bearish bar.
So I'm bearish still.. although.. this week. it went into area of break price 3291.
The subtle point is.. where do i entry and how much price difference I will put in.
If 20$ gap.. price now $3330.00 +20$ = $3350
for 0.01 = 20$ risk
price 20$ seems reasonable if I'm at the right point/entry.
I'm too basic...
I'm too simple..
Not a guru
NB/ Yest NFP will be a strong bias too. What a sell off :)
Xausdt techinical analysis.Xausdt techinical analysis next move posibale at h1 time frame.not finchinal advice.
XAUUSD - trade - market structure XAUUSD - trade - market structure , this is a easy and clean setup, of course there is no analysis:)., use risk and trade managment
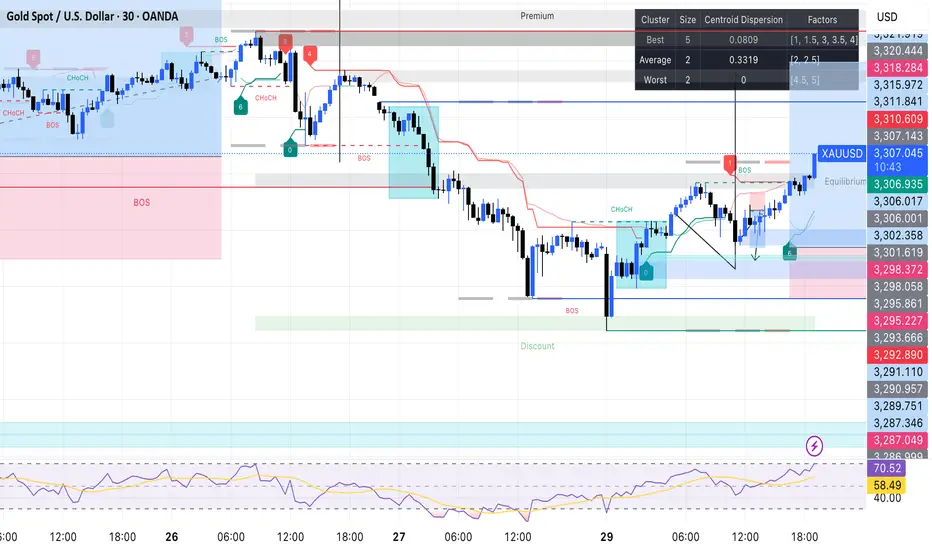
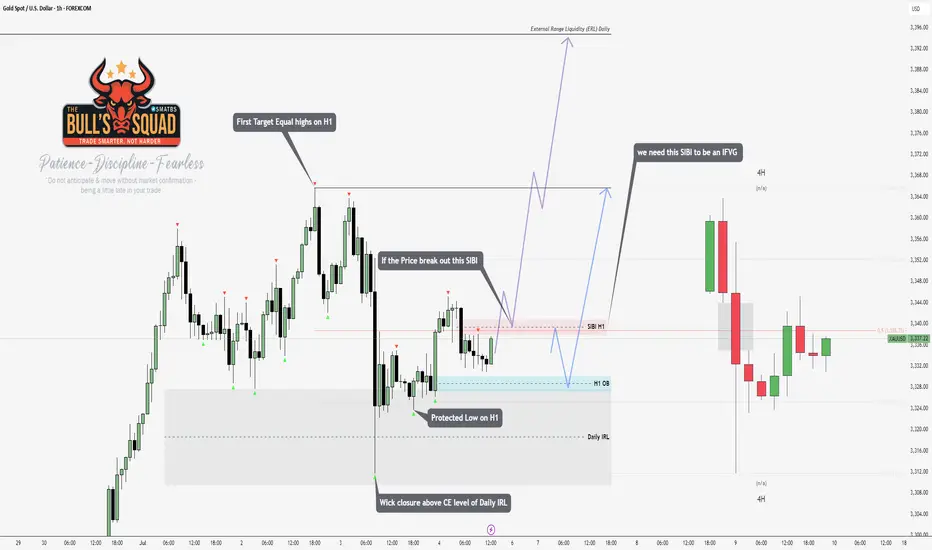
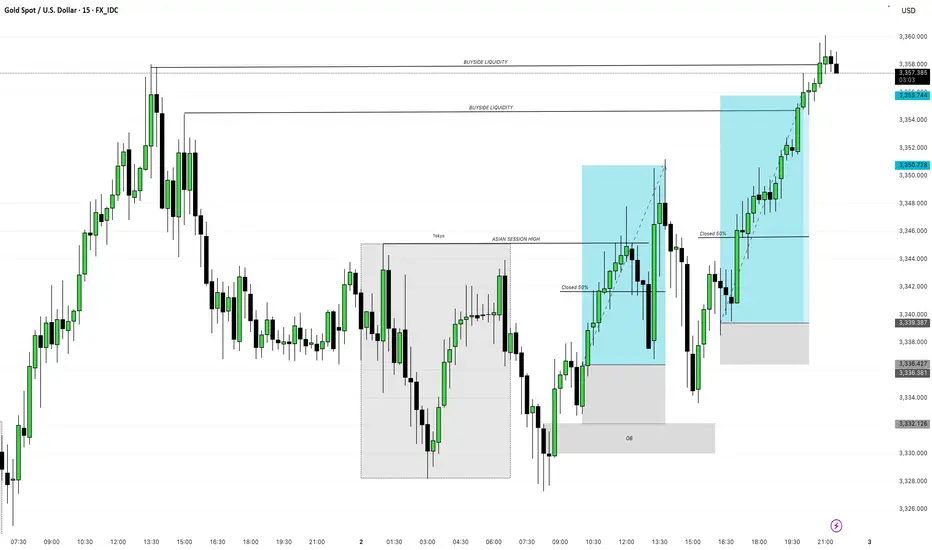
02/07/25 - XAUUSD Trade Analysis & Execution Overall Context
The chart showcases:
• Smart money concepts (SMC) such as liquidity grabs, order blocks, and session-based trading.
• A bullish bias following a successful manipulation and mitigation during the Asian to London/NY overlap.
Key Concepts Highlighted
Liquidity Zones
• Buyside Liquidity (BSL) is marked above the recent highs, indicating retail buy stop orders — a key magnet for institutional price action.
• Price ultimately targets and sweeps this liquidity.
Sessions
• Tokyo/Asian Session Range is shaded, showing consolidation.
• Price creates a high marked “ASIAN SESSION HIGH”, which becomes a short-term liquidity target.
Order Block (OB)
• A bullish Order Block is marked below price, around the 3,332.126 area.
• Price taps into this OB during the London session, indicating institutional accumulation.
Trade Setup Breakdown
Entry Zone
• Price dipped into the Order Block (OB) after forming a higher low (HL) — this likely triggered long positions.
• Bullish order flow followed with clean, impulsive moves upward.
First Trade Position
• Trade enters post-OB mitigation and breaks above short-term structure.
• First TP (Take Profit) is possibly near the Asian Session High, where 50% was closed (partial profit-taking).
• Price retraces post-take-profit, but maintains bullish structure.
Second Trade Position
• After a retracement into a demand zone (gray shaded), another long opportunity arises.
• The second entry likely occurs after confirmation of support in the retracement.
• TP targets the next buyside liquidity pool.
Trade Management
• 50% Closures are clearly annotated — a risk management tactic to secure profit while letting the rest run.
• Each leg upwards is followed by a correction but respects bullish structure.
Final Target
• The final buyside liquidity pool at the top is swept, suggesting:
• Completion of the smart money play.
• Potential reversal zone or exhaustion.
Summary of Trade Execution
Bias
>Bullish
Entry Basis
> OB Mitigation + Liquidity Sweep + Bullish Break of Structure (BoS)
TP Zones
> Asian Session High, then Final BSL
Risk Management
> 50% closure at intermediate targets
Confirmation
> Structure shift + aggressive entry post-mitigation
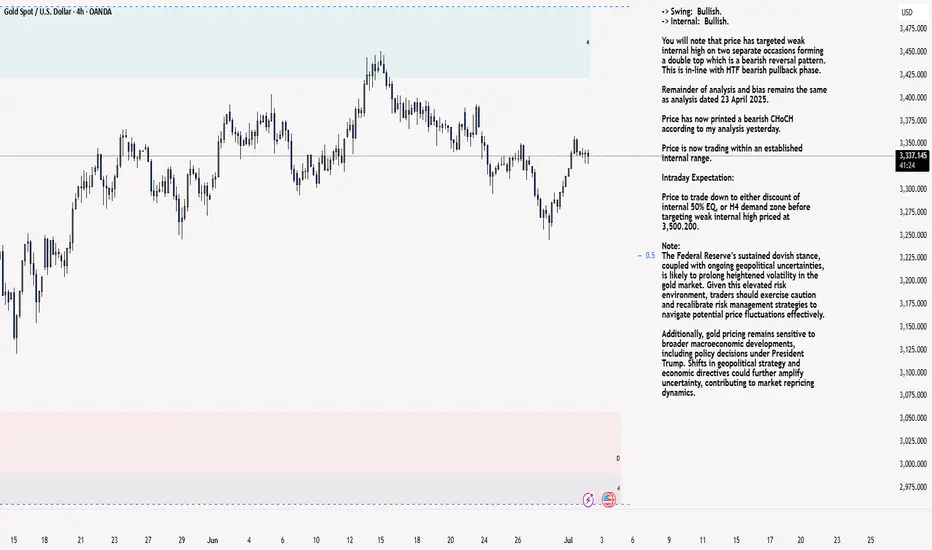
XAU/USD 02 July 2025 Intraday AnalysisH4 Analysis:
-> Swing: Bullish.
-> Internal: Bullish.
You will note that price has targeted weak internal high on two separate occasions forming a double top which is a bearish reversal pattern. This is in-line with HTF bearish pullback phase.
Remainder of analysis and bias remains the same as analysis dated 23 April 2025.
Price has now printed a bearish CHoCH according to my analysis yesterday.
Price is now trading within an established internal range.
Intraday Expectation:
Price to trade down to either discount of internal 50% EQ, or H4 demand zone before targeting weak internal high priced at 3,500.200.
Note:
The Federal Reserve’s sustained dovish stance, coupled with ongoing geopolitical uncertainties, is likely to prolong heightened volatility in the gold market. Given this elevated risk environment, traders should exercise caution and recalibrate risk management strategies to navigate potential price fluctuations effectively.
Additionally, gold pricing remains sensitive to broader macroeconomic developments, including policy decisions under President Trump. Shifts in geopolitical strategy and economic directives could further amplify uncertainty, contributing to market repricing dynamics.
H4 Chart:
M15 Analysis:
-> Swing: Bullish.
-> Internal: Bullish.
H4 Timeframe - Price has failed to target weak internal high, therefore, it would not be unrealistic if price printed a bearish iBOS.
The remainder of my analysis shall remain the same as analysis dated 13 June 2025, apart from target price.
As per my analysis dated 22 May 2025 whereby I mentioned price can be seen to be reacting at discount of 50% EQ on H4 timeframe, therefore, it is a viable alternative that price could potentially print a bullish iBOS on M15 timeframe despite internal structure being bearish.
Price has printed a bullish iBOS followed by a bearish CHoCH, which indicates, but does not confirm, bearish pullback phase initiation. I will however continue to monitor, with respect to depth of pullback.
Intraday Expectation:
Price to continue bearish, react at either M15 supply zone, or discount of 50% internal EQ before targeting weak internal high priced at 3,451.375.
Note:
Gold remains highly volatile amid the Federal Reserve's continued dovish stance, persistent and escalating geopolitical uncertainties. Traders should implement robust risk management strategies and remain vigilant, as price swings may become more pronounced in this elevated volatility environment.
Additionally, President Trump’s recent tariff announcements are expected to further amplify market turbulence, potentially triggering sharp price fluctuations and whipsaws.
M15 Chart:
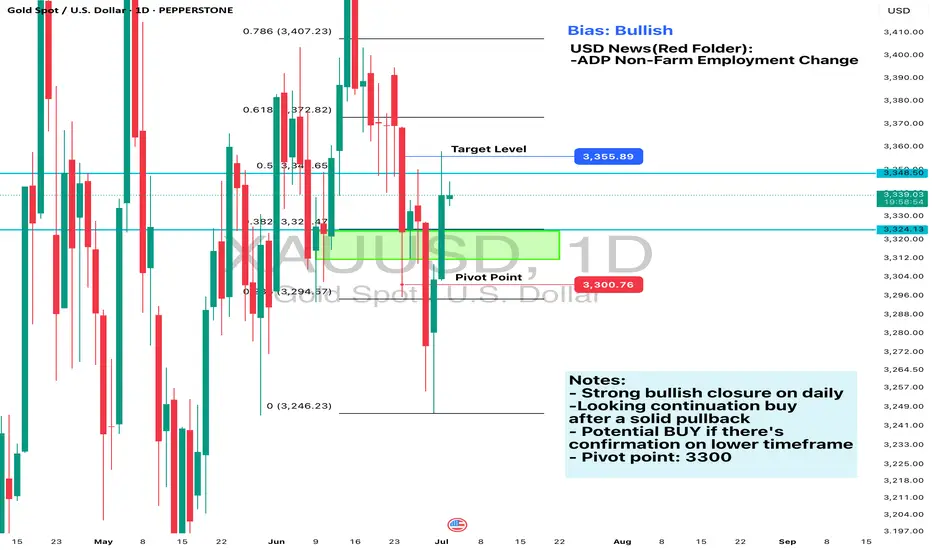
Daily Analysis- XAUUSD (Wednesday, 2nd July 2024)Bias: Bullish
USD News(Red Folder):
-ADP Non-Farm Employment Change
Notes:
- Strong bullish closure on daily
-Looking continuation buy
after a solid pullback
- Potential BUY if there's
confirmation on lower timeframe
- Pivot point: 3300
Disclaimer:
This analysis is from a personal point of view, always conduct on your own research before making any trading decisions as the analysis do not guarantee complete accuracy.
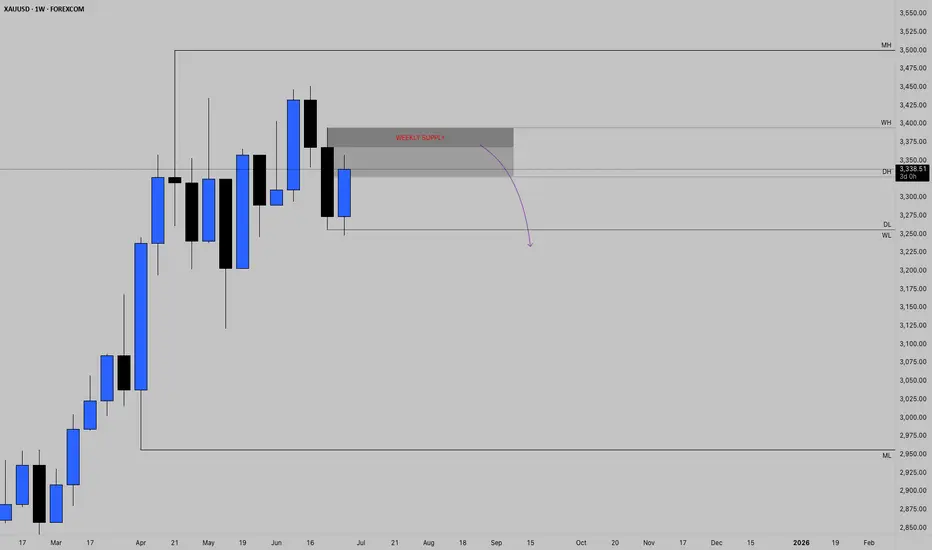
WEEKLY SUPPLY MAY HOLDAfter price closed strong bearing the previous week, we have witnessed a massive rally back up into weekly highs. Even after 2 days of rally, this strong bullish pressure doesn't seem to be over looking at today's strong daily closure. We might just see price extend a little further into weekly highs as shown and now based on strong confirmations, a plunge back down into April's lows.
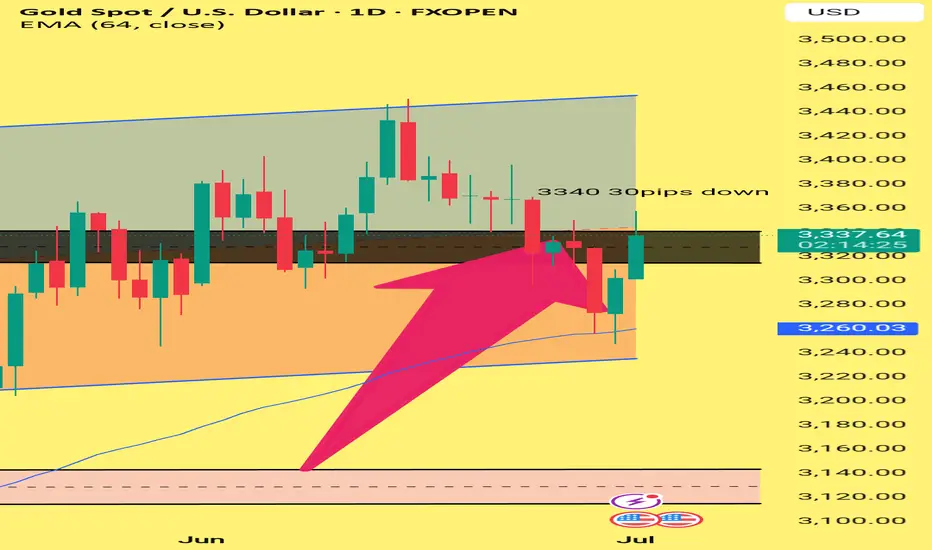
Title: Rejection at 3340 – Gold Struggles to Break ResistanceGold faced a clear rejection at the 3340 zone, dropping nearly 30 pips. This confirms that the 3335–3340 area remains a strong resistance. If price fails to break above this zone, we may see a move towards 3330 in the coming sessions. EMA 64 is now the key support to watch.