GOLD THE united state interest rate stands at 4.25%-4.5%
the US10Y open the day at 4.293% and closes 4.26% a significant drop from may high of 4.62%
the dollar index is heading to 96$ after open 97.611$ to close 97.313$.
Final GDP q/q
Actual: -0.5%
Forecast: -0.2%
Previous: -0.2%
The US economy contracted by 0.5% in the first quarter, worse than the expected 0.2% decline, indicating a sharper slowdown than anticipated.
2. Unemployment Claims
Initial Claims: 236,000
Forecast: 244,000
Previous: 245,000
Initial jobless claims fell by 10,000 to 236,000, lower than forecast and near historically low levels, suggesting that layoffs remain relatively subdued despite economic challenges.
3. Core Durable Goods Orders m/m
Actual: +0.5%
Forecast: +0.1%
Previous: +0.2%
Core durable goods orders, which exclude transportation, rose 0.5% month-over-month, beating expectations and signaling some resilience in business investment.
4. Durable Goods Orders m/m
Actual: +16.4%
Forecast: +8.6%
Previous: -6.3%
Total durable goods orders surged 16.4%, a strong rebound following a prior decline, indicating a pickup in demand for long-lasting manufactured goods.
5. Final GDP Price Index q/q
Actual: 3.7%
This measure of inflation in the GDP deflator remains elevated, reflecting persistent price pressures in the economy.
Summary of Market Implications:
The larger-than-expected GDP contraction signals economic weakness, which could increase expectations for accommodative Fed policy.
The drop in initial jobless claims supports the view that layoffs are limited, but rising continuing claims suggest some labor market softness ahead.
Strong durable goods orders point to underlying business investment strength, providing a mixed but cautiously optimistic outlook.
Elevated inflation as shown by the GDP price index keeps inflation concerns alive.
Overall, the data presents a complex picture of a slowing economy with pockets of resilience and ongoing inflationary pressures
the interest rate remains 4.24%-4.5% ,the bond market remain weak on fiscal policy challenges and pending rate outlook.
the 10 year bond yield is trading around 4.291% -4.26% and edge lower from fundamental outlook.
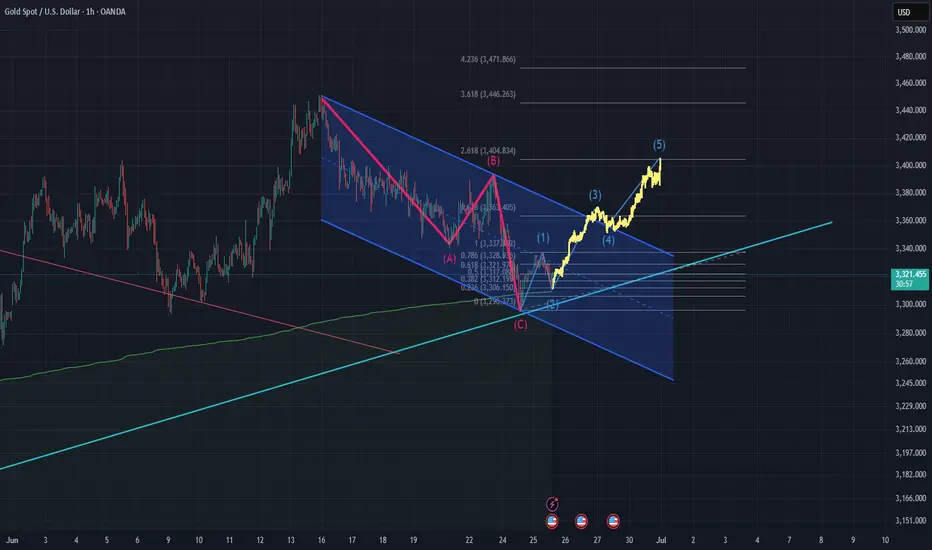
gold on ascending trendline connecting April till June and found support at 3312-3314.
buyers during newyork session will build momentum on technical to bridge 3350 supply .
break below 3311-3314 will heading to my demand floor .
#gold .
XAUUSDK trade ideas
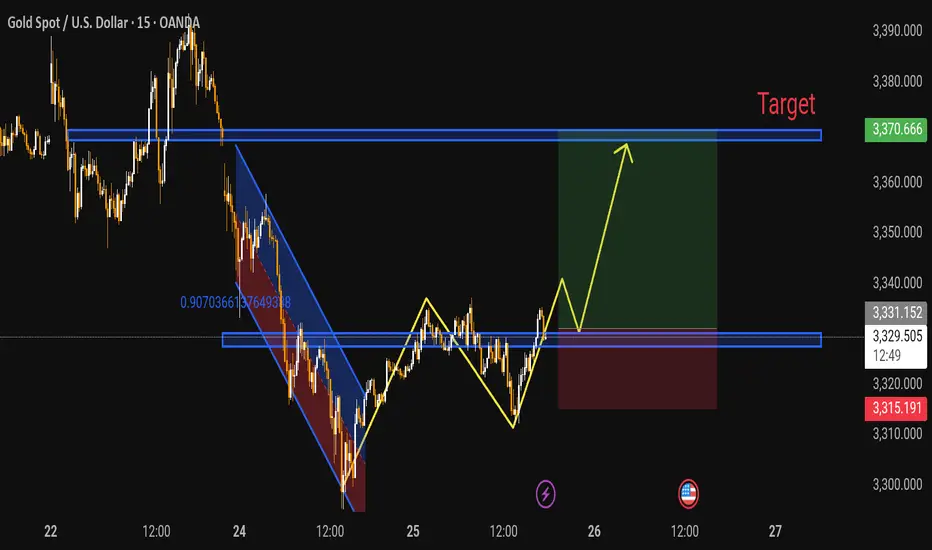
XAUUSD Expecting Bullish movementDowntrend and Reversal
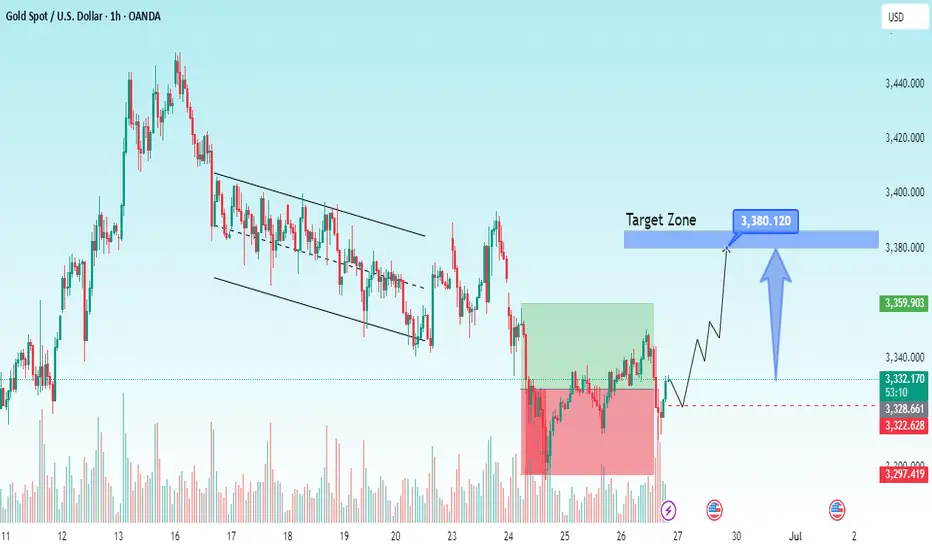
Initially, the market showed a strong bearish trend highlighted by the red and blue descending channel
A bullish reversal followed after a double bottom formation around the 3315 zone which acted as a key support level
Breakout Confirmation
Price broke above the descending channel and is now showing higher highs and higher lows confirming a bullish structure
A bullish break and retest pattern is anticipated at the 3331 3332 zone marked with a horizontal support box
Entry and Target Zone
A long position is suggested after the retest of the support zone around 3331
Target 3370 a major resistance level from the previous price action
Stop-loss Below 3315 just under the recent swing low for risk management
Risk-Reward Ratio
The trade offers a favorable risk-reward setup with the green zone indicating profit potential and the red zone representing risk
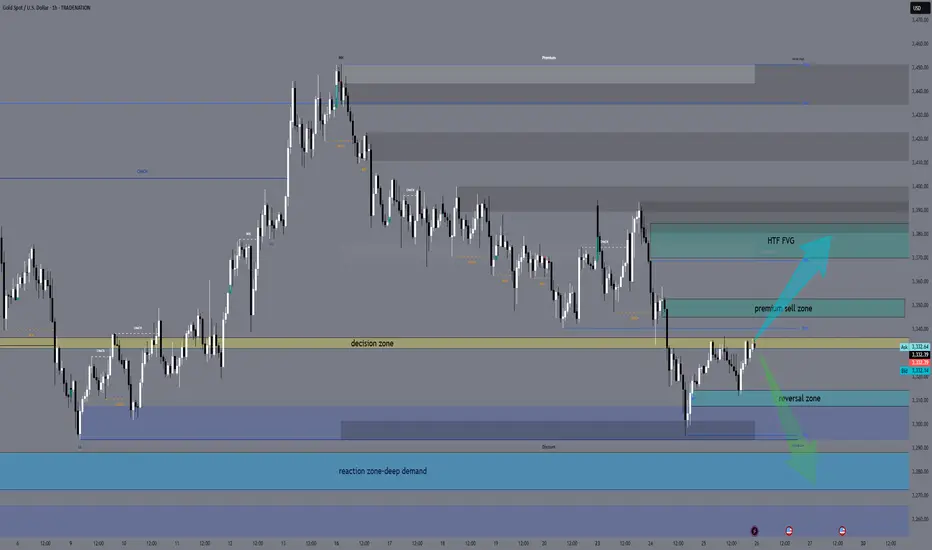
XAUUSD – Sniper Entry Plan June 26, 2025👋 Hello traders,
Gold is currently consolidating after recent downside liquidity sweeps, and Thursday brings high-impact USD catalysts. Let’s break it down and build a precise plan for sniper entries around these volatile zones. We’re trading structure, not noise — eyes on the prize. 🎯
🔸 HTF Outlook (D1 → H4 → H1)
🌐 Macro & Geopolitical Context
Markets are bracing for:
USD Unemployment Claims (Forecast: 244K, previous: 245K)
Final GDP q/q and Durable Goods Orders
Fed speakers (Barkin, Barr, Harker)
Stronger-than-expected data could reinforce USD bullish sentiment, sending gold down. Weaker reports + dovish Fed = bullish pressure on gold.
🗺️ Daily Bias: Neutral to Bullish
Price is ranging above a key CHoCH low + Daily OB (3272–3288)
Strong bullish continuation only confirmed with a break above 3370–3384
FIBO: 50% retracement of the last swing is near 3310, giving structure to Buy Zone 1
Bias: Bullish as long as 3272 holds — PA supports HL structure above imbalance
🕓 H4 Bias: Bearish Pullback
CHoCH at 3384 → clean Lower High + price failed to close above premium FVG
Pullback testing EMA 50/100 + FVG at 3345
FIBO extension zone at 161.8% aligns near 3288 = reactive downside target
Bias: Reactive bearish under 3352. If 3370 breaks cleanly → short invalid.
🕐 H1 Bias: Bullish Short-Term
CHoCH → HL printed at 3310 → higher lows forming toward supply
EMA 21/50 crossed to the upside, RSI mid-range (50–60)
PA structure showing ascending triangle under resistance
Bias: Bullish continuation valid toward 3352–3370, unless breakdown under 3308
🔸 LTF Precision (M30 → M15)
🔹 Sell Zone 1 – 3352–3345
H1 OB + M15 FVG + upper range sweep
RSI expected to peak near 70 → potential divergence
FIBO: 78.6% retracement of previous bearish leg
PA: Watch for M15 liquidity sweep + bearish engulfing
🔸 Entry: Wait for break/retest → confirmation on M5–M15 BOS
🔹 Sell Zone 2 – 3370–3384
HTF premium imbalance zone + weak high above
RSI likely in exhaustion zone
FIBO extension 1.272–1.618 completes inside this supply
PA: Only enter after stop hunt wick + clear CHoCH (M5)
🔸 Entry: Reactive fade after liquidity trap
🔸 Buy Zone 1 – 3308–3313
H1 CHoCH + OB + EQ zone
RSI bounce zone (30–40)
FIBO 50–61.8% retracement of bullish swing
PA: Watch for M15 bullish engulfing or double bottom formation
🔸 Entry: Only on structure break + retest confirmation
🔸 Buy Zone 2 – 3288–3272
Daily OB + HTF FVG + massive imbalance
RSI expected to overshoot under 30
FIBO: 1.618 extension from previous M15 bullish leg
PA: High-RR reversal zone if flushed by NY open
🔸 Entry: Enter only after M5 CHoCH or strong engulfing near the OB
⚖️ Decision Zone – 3333–3336
Previous supply turned EQ zone
PA shows indecision — do not enter here
Useful for monitoring if price holds support or rejects
🔸 Trade Scenarios
🟢 Bullish Scenario
If USD data is weak:
Flush to 3308 or 3288
Confirm HL formation → sniper buy from OB → aim 3345+, possibly 3370 sweep
🔴 Bearish Scenario
If USD prints strong:
Price spikes into 3352 or 3370 zones → rejection + BOS
Sniper short entry → targets 3310 → 3288
🔸 Final Plan & Action Points
✅ Patience is key during news. Let structure confirm.
✅ Track price behavior near 14:30 CEST, avoid instant spikes.
✅ Best sniper RR zones:
🔹 Sell from 3352 or 3370
🔸 Buy from 3308 or 3288
📊 Precision matters. Structure wins.
👍 Like this if it helped you map the move, and 🔔 follow for tomorrow’s sniper entry.
— GoldFxMinds
Disclosure: I am part of TradeNation's Influencer program and receive a monthly fee for using their TradingView charts in my analyses and educational articles.
XAUUSD Seems Going UpGold price trades with a mild positive for the second straight day on Thursday, though it lacks follow-through and remains below the $3,350 level through the early European session. Reports that US President Donald Trump was considering replacing Federal Reserve Chair Jerome Powell raised concerns over the future independence of the US central bank.
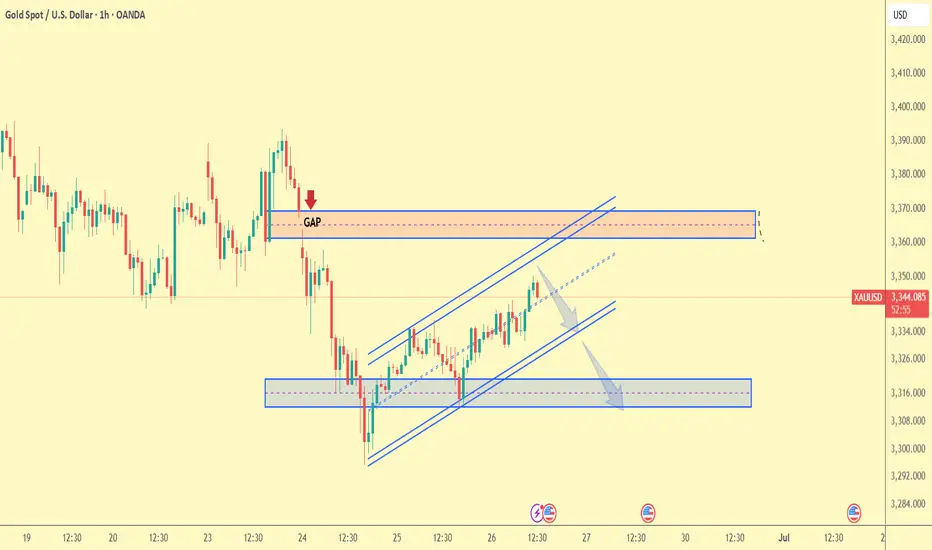
Gold Trade Plan 26/06/2025Dear Traders,
Price Still Range 3310-3350 ( Channel movement)
i expect price will be start Correction to 3330-3320 and its time of Correction of DXY,
Regards,
Alireza
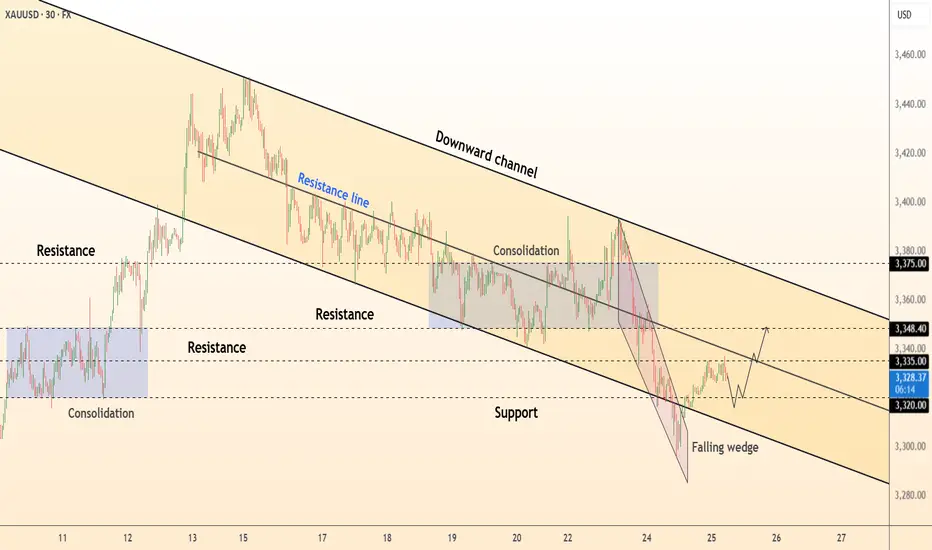
DeGRAM | GOLD held the lower boundary of the channel📊 Technical Analysis
● Price bounced from the channel floor (≈ 3 320) forming a bullish falling-wedge whose breakout target coincides with the median resistance at 3 348.
● Hidden RSI divergence and a series of higher lows inside today’s micro-range show buyers absorbing supply; reclaiming the wedge apex should accelerate toward the upper channel band near 3 375.
💡 Fundamental Analysis
● Spot-ETF inflows resumed and Fed-funds futures now price only one cut this year while real yields eased after soft US consumer-confidence data, trimming dollar bid and reviving gold demand.
✨ Summary
Long 3 320-3 330; wedge break > 3 335 eyes 3 348 then 3 375. Bull view void on a 30 min close below 3 300.
-------------------
Share your opinion in the comments and support the idea with a like. Thanks for your support!
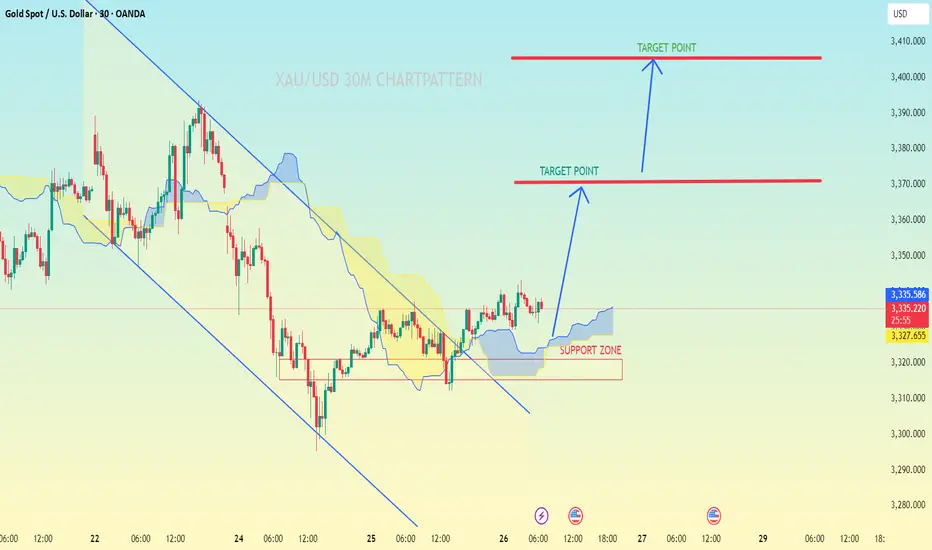
XAU/USD 30M CHART PATTERN.XAUUSD (Gold Spot vs USD) on the 30-minute timeframe, here’s the breakdown:
Observations:
A descending channel was broken to the upside.
Price is above the Ichimoku cloud, which often suggests bullish momentum.
There is a clearly marked support zone around 3,320 - 3,325.
Two target points are drawn with arrows indicating potential upside levels.
---
📍 Target Levels (as seen on the chart):
1. First Target: Approximately 3,370
2. Second Target: Approximately 3,405 – 3,410
These targets are based on previous resistance levels and potential price projections after the breakout.
---
✅ Strategy Suggestion (if you're trading this):
Entry Zone: Around 3,327 – 3,330 (current level)
Stop Loss: Below Support Zone (~3,315)
Take Profits:
TP1: 3,370
TP2: 3,405 – 3,410
Let me know if you'd like Fibonacci levels or RSI confirmation as well.
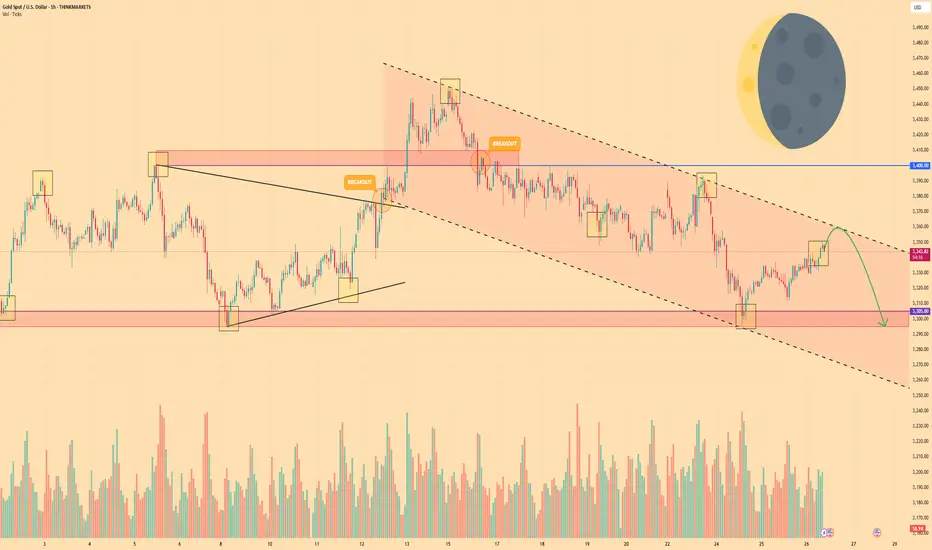
GOLD - Price can continue to move down in falling channelHi guys, this is my overview for XAUUSD, feel free to check it and write your feedback in comments👊
Some days ago price bounced from support level and started to grow to $3400 level, making a small correction before.
When it reached this level, price entered to wedge, where it made a correction and then started to grow.
In a short time, price exited from wedge and soon broke $3400 level, but then it started to decline in a falling channel.
In falling channel, Gold broke $3400 level one more time and in a short time declined to $3305 support level.
After this movement, Gold turned around and started to move up to resistance line of channel.
I expect that Gold can reach resistance line of channel and then start to decline to $3295 support area.
If this post is useful to you, you can support me with like/boost and advice in comments❤️
Disclaimer: As part of ThinkMarkets’ Influencer Program, I am sponsored to share and publish their charts in my analysis.
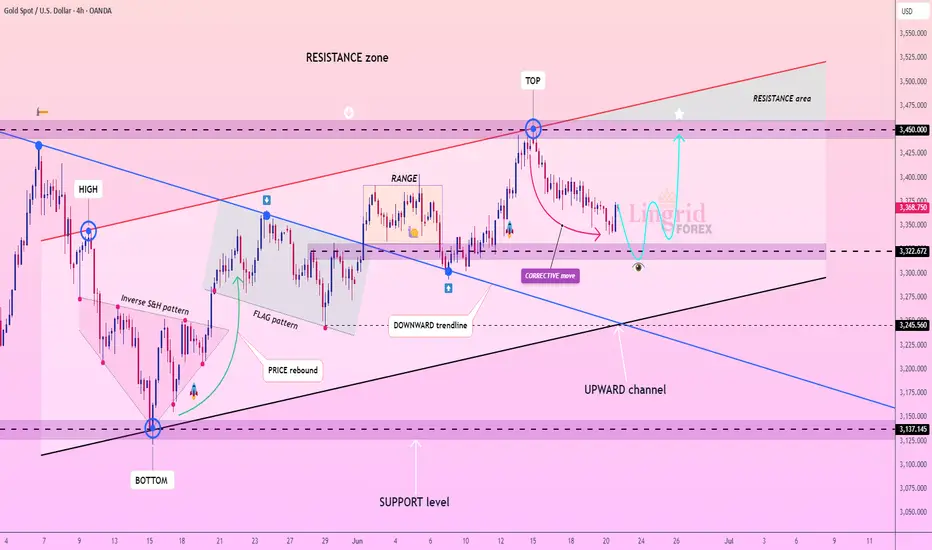
Lingrid | GOLD Weekly Outlook: Corrective Phase Tests SupportOANDA:XAUUSD experienced a notable pullback this week, retreating from the $3,450 resistance zone as profit-taking emerged following the recent geopolitical rally. The market appears to be entering a healthy corrective phase after the strong upward momentum driven by Middle Eastern tensions and safe-haven demand.
The 4H chart reveals gold testing the critical $3,320 support level, which coincides with the lower boundary of the established upward channel. This corrective move was anticipated after the sharp rally to the resistance area marked as "TOP" on the chart. The current price action suggests a natural retracement within the broader bullish structure.
Technically, the downward trendline from the recent high is being respected, indicating the correction may continue toward the $3,240-$3,270 range before finding stronger support. The flag pattern that previously drove the rally now serves as a reference point for this pullback phase.
Key levels to monitor include the $3,320 immediate support and the more substantial $3,200 level below. A decisive break below these supports could extend the correction further, while a bounce from current levels would reinforce the underlying bullish bias. The market remains within the broader upward channel, suggesting this correction is likely temporary before the next leg higher toward the resistance zone above $3,450.
Traders, if you liked this idea or if you have your own opinion about it, write in the comments.
Report - June 26, 20251. Ceasefire, Oil, and Market Sentiment:
Markets are stabilizing after a volatile stretch driven by geopolitical tensions between Israel and Iran. A ceasefire, brokered by President Trump, appears to be holding, encouraging risk-on sentiment across global asset classes. Brent crude has fallen back to $68.17 per barrel, erasing earlier war-driven spikes. Traders swiftly sold oil after Iran's symbolic missile attack on a US base in Qatar, interpreting it as a move to de-escalate rather than escalate. This rapid reaction, fueled by open-source intelligence and satellite imagery showing the base was empty, helped unwind the geopolitical premium in crude.
Energy consultancy Rystad noted Iran even increased crude exports amid the conflict due to lack of refining capacity. With OPEC+ boosting supply and US shale output high, the market anticipates an oversupplied scenario by year-end. Strategists like Amrita Sen (Energy Aspects) expect crude to test $50–60, while RBC’s Helima Croft said the White House is unlikely to tap the Strategic Petroleum Reserve, given sufficient alternative supply buffers.
2. Equities and Sector Rotation:
US equity indices were mixed: the Nasdaq 100 gained 0.2% to 22,237.74, while the S&P 500 and Dow Jones dipped slightly. The CBOE Volatility Index (VIX) dropped 1.1% to 16.77, signaling easing investor fear. Year-to-date, tech leads with XLK up 31.95%, followed by communications (XLC +23.46%) and discretionary (XLY +18.69%). Defensive sectors lagged: utilities (XLU +19.13%), consumer staples (XLP +9.15%), and real estate (XLRE -1.27%).
Recent sector performance reflects a recalibration away from energy and interest-rate sensitive names. XLE has tumbled 4.65% over the past five days, mirroring declining oil, while XLRE’s underperformance worsened, highlighting investor caution in yield-sensitive areas. The growth/value debate continues: large-cap growth (IWF) was the only factor posting a gain (+0.29%), while small-cap growth (IJT) fell 1.2%, underscoring preference for quality and scale.
3. Fixed Income and Sovereign Yields:
Rates edged higher. The US 10Y Treasury yield rose 2 bps to 4.32%. Germany’s 10Y bund climbed 3 bps to 2.57%, and UK gilts ticked up 1 bp to 4.46%, driven by expectations of higher issuance to fund increased NATO defense spending.
US Treasuries across the curve remain elevated: 1Y at 3.99%, 2Y at 3.77%, and 30Y at 4.81%. Despite global easing signals, sovereign borrowing costs stay elevated, reflecting inflation stickiness and geopolitical risk premia. TIPs and agency MBS have outperformed on a 1Y basis, with TIP +4.7% and GNMA +5.76%.
4. NATO Commitment and Fiscal Risk:
At The Hague summit, NATO allies pledged to meet Trump's demand for 5% of GDP in defense spending by 2035, a seismic shift from the previous 2% benchmark. While reaffirming Article 5 commitments, Trump emphasized US support hinges on European “burden sharing,” pressuring Spain for opting out. The summit declaration promises annual roadmaps and a 2029 review—coinciding with Trump’s potential exit from office.
Germany’s Chancellor Merz called the commitment a moment of “putting our money where our mouth is,” but bond markets reacted with concern. The FTSE 100 slid 0.5%, and the DAX fell 0.6%, reflecting fiscal anxieties tied to expanded military budgets.
5. Policy Front – Trump’s Tax Push & Debt Outlook:
The White House claims its proposed tax bill will lower debt via growth and tariff revenue. CEA estimates show debt-to-GDP dropping to 94% by 2034 with $8.5–11.2 trillion in deficit reduction. Yet the CBO projects the bill would add $2.4 trillion to deficits—and $2.8 trillion when factoring in higher rates.
Trump’s pressure campaign on Senate Republicans includes urging round-the-clock negotiations. However, concerns linger among fiscal hawks like Sen. Ron Johnson, who warned of “an acute debt crisis.”
6. Credit Markets and Insurance Breakdown Risk:
Credit spreads are holding stable, but US liability insurance is flashing red. Marsh data shows US casualty insurance rates have risen for 23 straight quarters. Executives at Everest and Aspen warn of a “breakdown” in coverage availability due to runaway litigation costs and “forever chemicals” claims. Everest’s reserves for US casualty risks now top $1.7 billion.
Insurers are lobbying for tort reform, and rate hikes of 20–25% in excess liability are becoming the norm. This insurance squeeze poses a serious inflationary threat to businesses, especially in logistics, construction, and hospitality.
7. Trade Disruption – FedEx Feels the Pinch:
FedEx shares dropped nearly 6% after warning of sharp deterioration in China–US freight, driven by the end of the “de minimis” $800 tariff exemption used by platforms like Temu and Shein. This lane, their most profitable intercontinental route, now faces structural weakness. While Q4 net income rose 13% to $1.65B, guidance for EPS of $3.40–4.00 (below expectations) reflects uncertainty ahead.
8. M&A Spotlight – Brighthouse Bidding Heats Up:
TPG and Aquarian Holdings are the final bidders for Brighthouse Financial, a $3.5B life insurer. Despite interest from Apollo, Carlyle, and Blackstone, many walked due to legacy annuity liabilities and high capital charges. The strategic appeal remains strong: control over policyholder premiums enhances credit origination capabilities for private capital platforms. An exclusive negotiation could emerge in the coming week.
9. Political Heat – Warren Targets Private Equity:
Senator Elizabeth Warren is probing PE firms (Apollo, KKR, Blackstone, Bain, Thoma Bravo) for lobbying efforts related to the “carried interest” loophole and private credit tax breaks embedded in Trump’s tax bill. The senator demands disclosures by July 2, while Trump pushes for bill signing by July 4.
The American Investment Council responded that raising taxes on private capital would “kill jobs” and hurt innovation. The legislation, approved narrowly in the House, slashes taxes and expands debt—a key flashpoint heading into summer recess.
10. Currency, Commodities, and Global Trends:
Brent crude trades at $67.95 and WTI at $65.18. Gold holds at $3,335, up 45% YTD, though recent profit-taking has slowed its rally. Silver (+26.2% YTD) and copper (+12.5%) also reflect bullish industrial demand.
In FX, GBP/USD is up 0.3% to 1.3705; EUR/USD is at 1.1681 (+0.02%). USD/JPY slid to 144.57 (-0.66%). On a 1Y basis, GBP and EUR are both up over 8%, while the yen is down nearly 10.5%, continuing its depreciation due to BOJ’s dovish stance.
---
Equities:
Current Positioning: Equities are delicately balanced. The S&P 500 is up +3.6% YTD, Nasdaq +3.4%, but Dow only +1.0%, reflecting the rotation into growth, defensives, and high-cap tech. However, small caps are under heavy pressure (IJR/SPY -1.05% daily, down YTD), and value is again underperforming.
Tactical Implications:
Overweight: Large-Cap Growth (e.g., XLK, IWF) – Mega-cap tech remains the secular winner (+31.95% YTD in XLK). Given moderating rates and weak cyclicals, expect further leadership unless yields spike.
Underweight: Small-Caps (IWM), Real Estate (XLRE), and Energy (XLE) – These are vulnerable to tightening credit, low breadth, and oil retracements. XLRE is -1.27% YTD and XLE dropped -4.65% in the past week alone.
Neutral: Financials (XLF) – The sector is at a crossroads. While yields support net interest margins, the liability insurance shock and credit pricing discipline weigh on capital-intensive names.
Actionable View: Stay concentrated in quality tech and cash-flow-rich defensives. Consider rotating out of overextended discretionary and look for short-term mean reversion trades in oversold industrials only on technicals.
Fixed Income:
Market: The UST 10Y yield is at 4.32%, up 2bps on the day. Notably, the 2Y/10Y curve is flattening again (+55bps spread), but with upward pressure on the long end driven by fiscal overhang (NATO rearmament, tax cuts).
Strategic View:
Short Duration Preferred – Laddered Treasuries and 1–3Y paper outperforming (e.g., SHY +0.65% YTD). Long duration remains risky despite falling inflation, given massive expected issuance.
TIPS as Inflation Hedge – TIPs up +4.7% YTD continue to provide inflation-linked protection. Elevated defense and healthcare spending bolster this theme.
Credit Call: High-Grade Corporate (LQD) – Valuation remains stretched, but spread stability gives buffer. Prefer LQD over HYG or CWB, where spreads are at risk due to funding costs and insurance withdrawal risk.
Action: Maintain a core laddered Treasury base, with modest high-grade credit. Fade the long end on rallies; use TLT as a tactical short if 10Y breaches 4.4–4.5%.
Commodities:
Key Developments:
Brent crude fell sharply (-6.1%) post-ceasefire, now at $67.95. Markets no longer price geopolitical premium.
Iran’s production rising, US SPR untapped, and China’s buying shifting.
Gold stabilizing at $3,335 after peaking on war fears; silver remains stronger at $36.34 (+26.2% YTD).
Outlook:
Oil: Short-Term Bearish to Neutral – Expect continued selling on rallies unless supply chain disruptions emerge. Range: $62–70/bbl.
Gold: Wait for Re-Entry – Momentum slowing but structural inflation hedging still intact. Look for re-entry near $3,200. Position cautiously if dollar strengthens.
Ags: Avoid – Corn and wheat continue to slide. Corn -7.5% MTD and -10.3% 3M; soybeans -11.7% YTD. No catalysts to reverse.
Action: Tactical shorts in oil remain viable unless Iran–Strait of Hormuz risk flares again. Hedge tail risks with gold but reduce exposure if USD rallies.
Currencies:
DXY weakening slowly, but USD/JPY still at 144.5 (-9.42% 1Y), EUR/USD firm at 1.1681.
Sterling outperforming: GBP/USD +8.2% 1Y.
Implications:
Short USD/JPY Holds – BOJ still dovish, yen oversold, risk-on flows support reversal. High conviction macro long on JPY.
Watch GBP/USD – Strong rally, nearing overbought territory. Use strength to rotate to EUR if ECB surprises.
EMFX Mixed – Avoid high beta EM (ZAR, TRY) due to USD and rates. Selective value in BRL, INR if USD pulls back further.
Action: Maintain partial USD hedge via EUR and JPY. EMFX traders should stay risk-off short term; low carry + volatile backdrop makes it unattractive.
Credit & Insurance Markets:
Everest ($1.7bn reserves) and Aspen warning of “coverage breakdown” in US casualty insurance. Litigation exposure (PFAS, data privacy, social cases) is a systemic risk.
FedEx’s collapse in China–US freight (-6% equity) is a red flag on consumption + supply chain health.
Expect more insurers to restrict exposure to high-litigation US states or raise rates >25%.
Positioning:
Be cautious on mid-cap financials, reinsurers, and commercial real estate debt with liability linkage.
Corporate credit: Avoid HY and convertibles. LQD remains the safe zone.
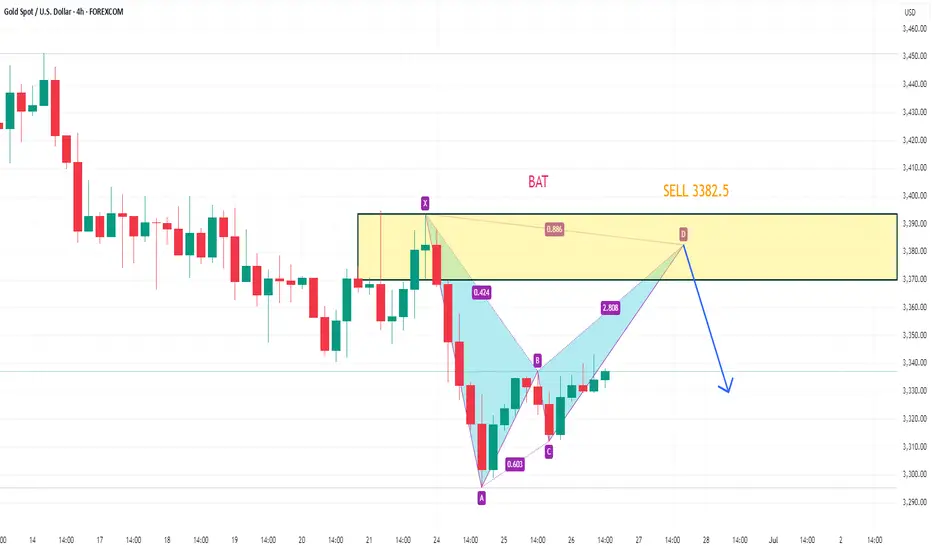
XAUUSD eyes potential bearish batOn the 4-hour chart, XAUUSD stabilized and rebounded in the short term. Currently, we can pay attention to the upper resistance near 3382.5. After it reaches that level, we can pay attention to the potential bearish bat pattern. At the same time, this position is in the previous supply area.
[XAUUSD] GOLD – Bullish Setup in Play🟡 *Key Context*
- Geopolitical calm (Trump ceasefire remarks) lowered risk aversion, pushing Gold down — but key support is holding.
- Fed uncertainty continues, yet technicals point to a possible reversal.
📉 *Price Structure*
- Price dropped into a falling wedge, testing 3285–3295 (H4 demand zone).
- RSI bullish divergence + harmonic ABCD pattern seen on 30m.
📌 *Trade Setup – Long Bias*
🔹Entry: 3285–3295 zone (watch for bullish candle confirmation)
🔹Stop Loss: Below 3280 (structure invalidation)
🔹Target 1: 3320–3330
🔹Target 2: 3390 (longer-term move)
⚠️ Volume confirmation is key — wait for breakout strength. Avoid entries during news events. Risk must be managed tightly.
#XAUUSD #Gold #TradingSignal #TeconLab #BuyTheDip
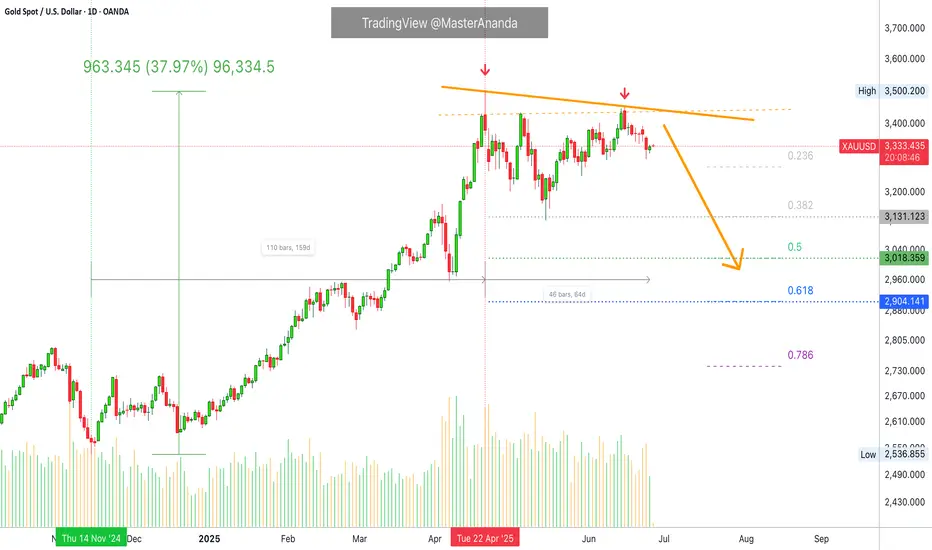
Gold Peaked, Deep Analysis: MACD & RSI, Targets: $3,131 & $2,904Gold (XAUUSD) already peaked. The 22 Apr session was a clear top signal. A very strong one at that. The chart is showing a lower (red arrows) and overall distribution channel. Trading volume continues to drop. Bearish volume is predominant.
Gold produced a strong rally, it lasted 159 days. Total growth amounts to +39% from bottom to top, starting November 2024, end April 2025.
It's been 64 days since the all-time high. No new highs, no bullish momentum. Geopolitical factors that would push Gold to new all-time highs, a war, did show up recently, a surprise event and yet Gold's price failed to move higher. This is a warning signal.
The RSI is weak now. Gold is trading very high, a very strong price but with a risk RSI. This is another warning signal, a strong one. Bullish would be the contrary, low price with a strong RSI. A weak RSI at this point can be interpreted as the bullish force being exhausted.
The daily MACD is pretty bad. Trending fully down with no possibility of anything bullish. Here is the chart.
This is a friendly reminder. Switch to Crypto.
You've been warned.
Namaste.
GOLD: Local Bullish Bias! Long!
My dear friends,
Today we will analyse GOLD together☺️
The recent price action suggests a shift in mid-term momentum. A break above the current local range around 3,314.13 will confirm the new direction upwards with the target being the next key level of 3,322.84 and a reconvened placement of a stop-loss beyond the range.
❤️Sending you lots of Love and Hugs❤️

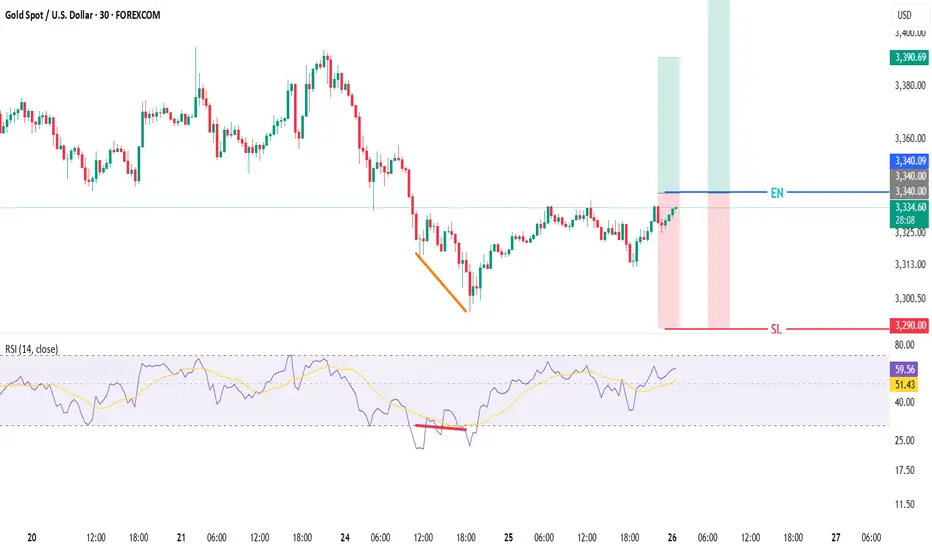
XAUUSD GOLD📈 GOLD (XAU/USD)
📊 Timeframes:
⏱️ 30-Min & 1-Hour
🟢 Long Trade Plan
🔍 Analysis Highlights:
✨ Bullish Divergence spotted
🚀 Breakout Trade
🎯 Trade Details:
🛑 SL: Marked on chart 🔴
✅ TP1: Mentioned on chart 🥇
🏁 TP2: Mentioned on chart 🥈
📌 Chart levels clearly labeled
📬 For any queries regarding chart: comment in message section
💡 Trade smart, manage risk! 📉📈
#Gold #XAUUSD #BreakoutTrade #LongSetup #BullishDivergence #TradingView #TradePlan
Trading balanceTrading balance The price of the asset has rebounded from the balance zone. With the prospect of growth into the resistance zone.
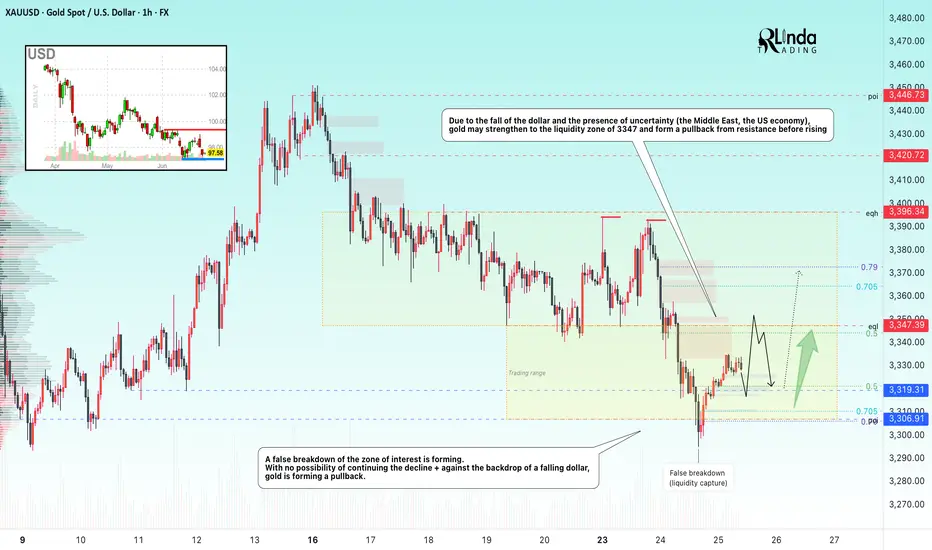
GOLD → Attempt to buy back the fall. Uncertainty factorFX:XAUUSD is falling within our expectations. After breaking through the trigger-level of 3340, the price fell to the liquidity zone of 3306. There is uncertainty in the market...
Gold is rising after a false break of support at 3300-3306, interrupting a three-day decline amid a weakening dollar and ongoing tensions in the Middle East. Investors are cautious due to the unstable truce between Iran and Israel, while the decline in USD/JPY after the Bank of Japan's statements and the rise in PPI in Japan are further supporting demand for gold. Powell's comments on the need for caution in monetary policy only temporarily strengthened the dollar. Now the market is focused on US housing data and the second day of Powell's speech
Technically, the price may consolidate at 3306-3347 for some time and only then show us (against the backdrop of the fundamental sentiment that has formed) which direction it will then take
Resistance levels: 3347, 3364, 3372
Support levels: 3319, 3307
The market is trying to buy back the decline. Tuesday's daily session closed with a long shadow, indicating interest in this price range. A pullback to 3320-3310 is possible before growth to 3340-3347.
Best regards, R. Linda!
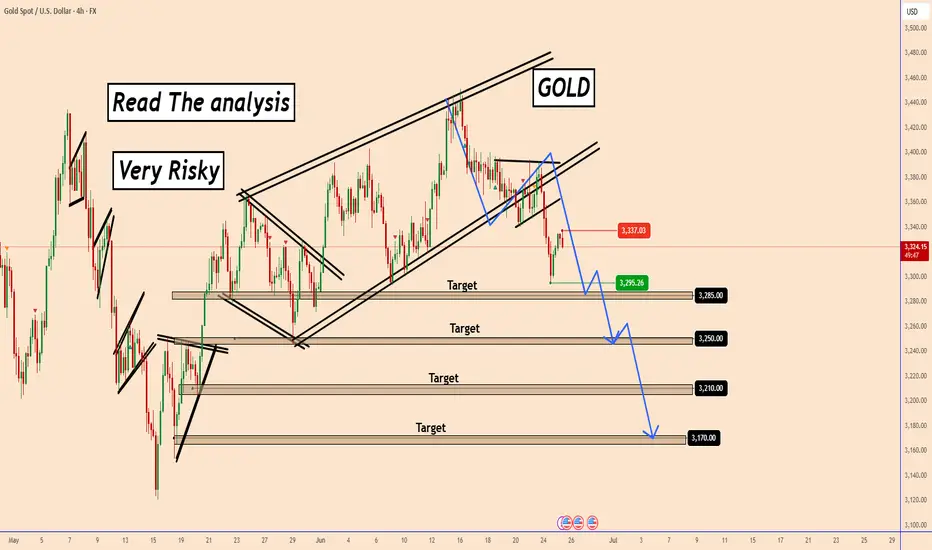
GOLD remains dominated by a slight downward momentumGOLD remains dominated by a slight downward momentum
From our previous analysis, gold reached 3295 :)
Gold remains dominated by a slight downward momentum, considering that the conflict in the Middle East is under control. Neither Iran nor Israel has broken the ceasefire so far. This is the first day.
Gold is releasing some of the fear and panic accumulated due to the fear of further escalation.
However, we all witnessed that Gold fell at a time when the conflict became bigger.
Remember that someone else knows the news every time in advance and this is called manipulation and not a normal market development. For many people, it may seem strange, but it is what it is. We have already seen how Gold reacted irrationally and not as a safe haven asset and we have done this several times.
If Gold follows our fundamental and technical analysis, I think it has already reached a strong zone near 3337, and the chances of a resumption of the downtrend are increasing.
It can only rise above 3337 on new issues or if those who have already sold it can buy Gold again. However, we are talking about large speculative Hedge Funds and not for retail traders.
If all goes well, gold should fall as the chart shows.
Key target zones: 3285; 3250; 3210 and 3170
You may find more details in the chart!
Thank you and Good Luck!
❤️PS: Please support with a like or comment if you find this analysis useful for your trading day❤️
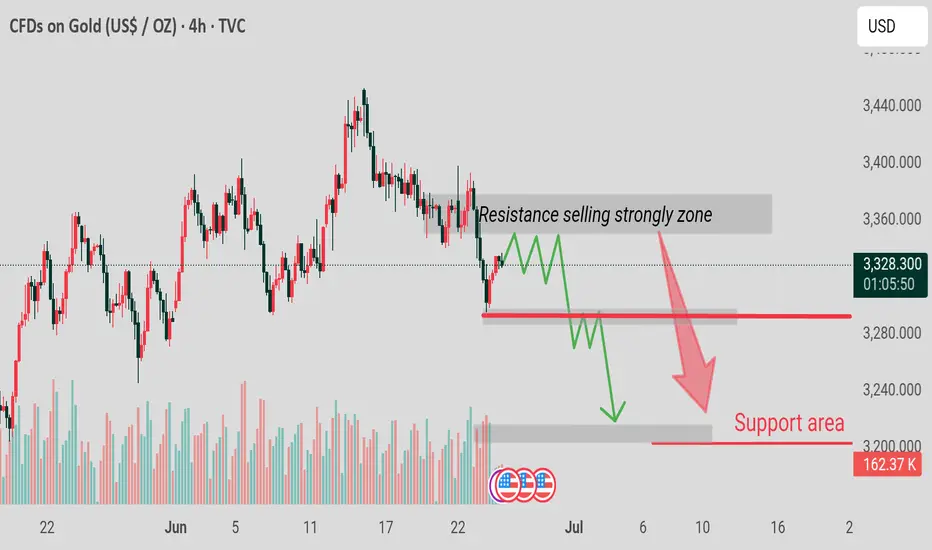
XAUUSD h4 down Bearish Continuation Assumption? Maybe Not So Fast…
The chart assumes a clean, step-by-step drop to the “Support Area,” but:
There’s a liquidity gap just above current price (~3340–3360) where stop hunts could occur.
Smart money might push price higher briefly to fill orders before any major selloff.
Gold Holding Strong – Eyes on $3400 and Beyond! (READ)By analyzing the gold chart on the 4-hour timeframe, we can see that after our last analysis, the price corrected down to $3341, then rallied back up to $3399. Currently, gold is trading around $3373, and if it manages to hold above $3355, we can expect further upside movement.
Potential bullish targets are $3400, $3417, $3450, and $3468.

GOLD ANALYSIS: A Bullish Breakout coming XAU-USD🔍 Key Technical Levels Decoded
🛡️ FORTRESS SUPPORT ZONE: $3,245 - $3,295
🛡️ Psychological level at: $3,250
1. 🎯 TARGET ZONES:
Immediate Target: $3,360 (4H FVG - Fair Value Gap)
Primary Target: $3,320 - 3,340
2. 🎭 The Liquidity Grab
The recent dip was a masterclass in market mechanics:
Weak longs were flushed out at $3,293
mean Smart money accumulated at discount prices
_______________________________
⚠️ RISK MANAGEMENT 🚨 DISCLAIMER ⚠️ DYOR

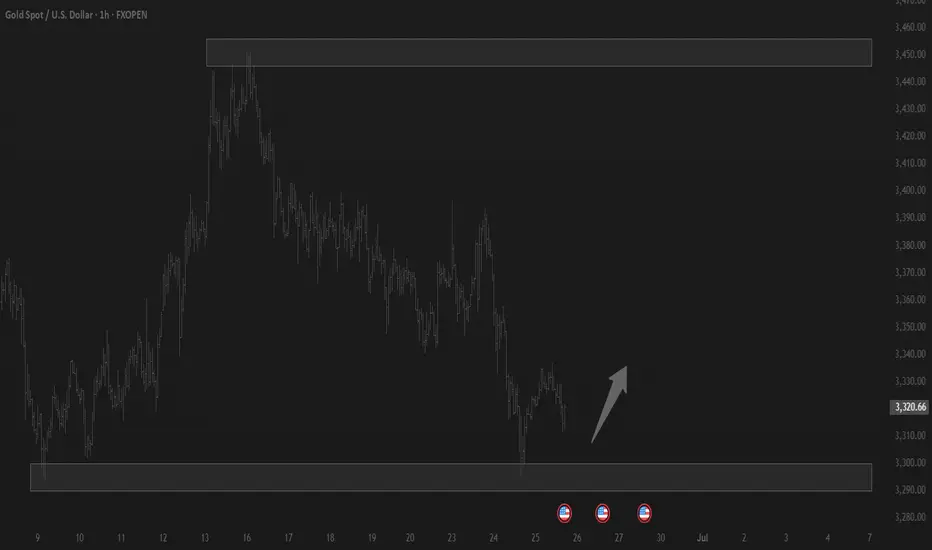
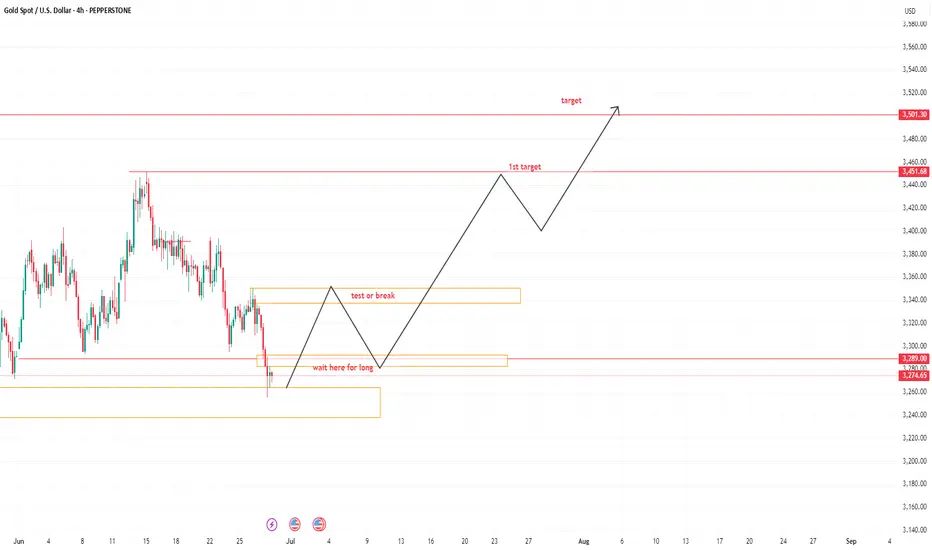
GOLD DISTRIBUTION TYPEHello folks. its been a while I am posting. Been dealing with this idea last week.
wait for a rally to 3344, if it breaks above 3351 then we still waiting below our main Entry 3280-3289 zone. less stoploss below the friday low.
Trade it swing if we see monday rally. then wait our entry.
Goodluck and have fun trading,
If trading is a lifestyle this is it.
this is your lifestyle.
waiting here is boring.
thats why we need to be more patience.
xiaaaaooo.
Gold’s Future: Contrary to Expectations?With rising geopolitical tensions in the Middle East, many analysts and global financial institutions have begun betting on a potential increase in gold prices. Some major banks have even raised their forecasts for gold to as high as $4,000 per ounce, raising a critical question: Will gold prices truly rise as expected, or are the markets heading toward a different outcome, one that sees gold’s future moving contrary to expectations?
Recent history has taught us much about gold’s behavior during times of crisis. Investors often turn to gold during heightened turmoil be it political, economic, or even health-related, because it is considered one of the most prominent safe havens and a key hedge against inflation.
Regarding the latest political tensions, gold has shown short-term positive reactions, often spiking in response to unfolding events. However, once markets absorb the impact, prices typically stabilize or partially retreat awaiting new developments or an escalation that could reignite momentum. This scenario played out in recent weeks during Middle East tensions, specifically on June 13, 2025, when gold rose by about 1.92% in a single day, only to drop 2.99% shortly after increasing all its gains.
When comparing the current situation to past events, a familiar pattern emerges. For instance, during the outbreak of the Russia-Ukraine conflict in 2022, gold prices initially surged but then started to disregard the ongoing war. A similar reaction occurred with trade tariff decisions imposed by the U.S. president where gold responded briefly to each new headline, only to retreat thereafter.
In summary, gold responded to the latest Middle East developments with a slight uptick but soon absorbed the tension and returned to a more stable state awaiting a potentially more severe escalation.
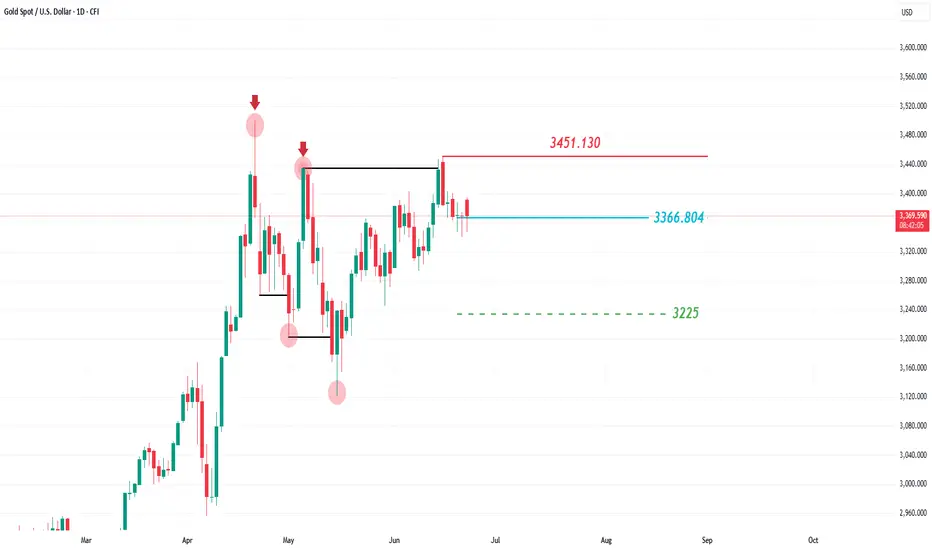
Technical Outlook for Gold Prices:
Gold is currently trading in a downward trend on the daily chart, forming lower lows consistently. The current zone near 3366.804 is technically significant, acting as a strong resistance level that could push gold to continue its descent toward the 3225 mark.
This bearish scenario would only be invalidated if the price breaks above 3451.130 and closes a daily candle above that level, signaling a possible reversal in the current trend.