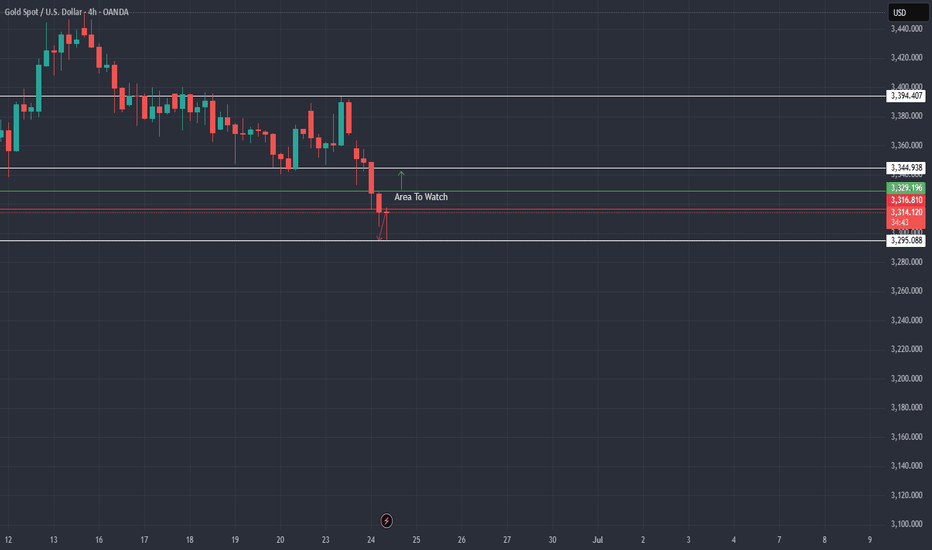
XAUUSDK trade ideas
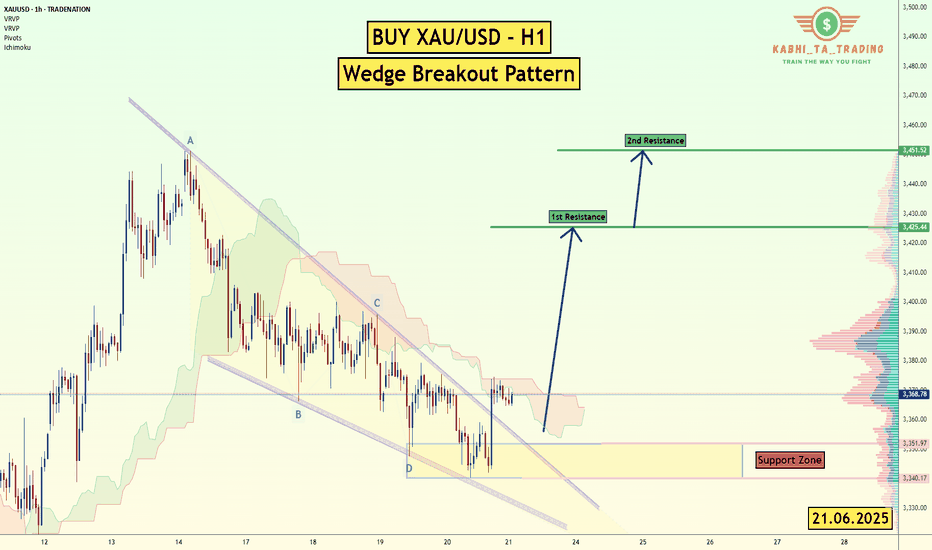
XAU/USD (Gold) - H1 - Wedge Breakout (21.06.2025)The XAU/USD pair on the H1 timeframe presents a Potential Buying Opportunity due to a recent Formation of a Wedge Breakout Pattern. This suggests a shift in momentum towards the upside and a higher likelihood of further advances in the coming Days.
Possible Long Trade:
Entry: Consider Entering A Long Position around Trendline Of The Pattern.
Target Levels:
1st Resistance – 3425
2nd Resistance – 3451
🎁 Please hit the like button and
🎁 Leave a comment to support for My Post !
Your likes and comments are incredibly motivating and will encourage me to share more analysis with you.
Best Regards, KABHI_TA_TRADING
Thank you.
Disclosure: I am part of Trade Nation's Influencer program and receive a monthly fee for using their TradingView charts in my analysis.
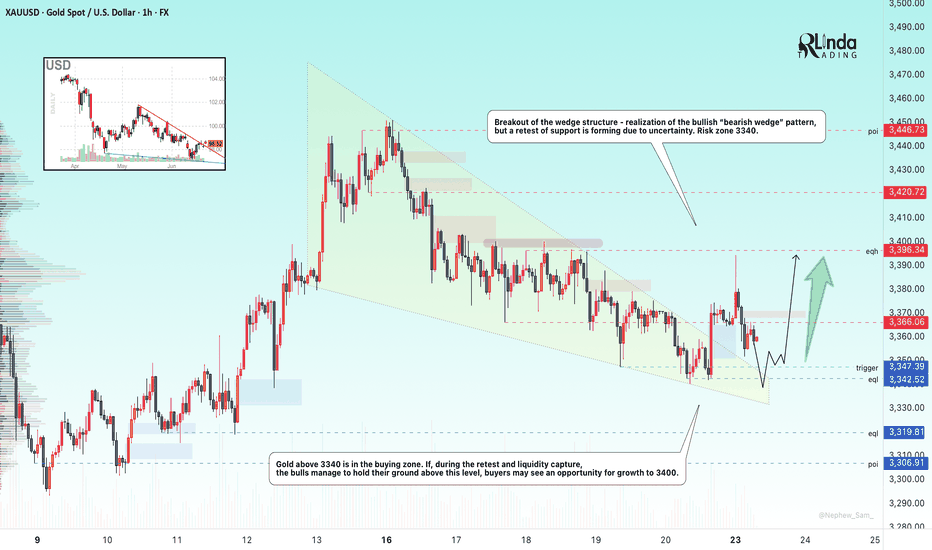
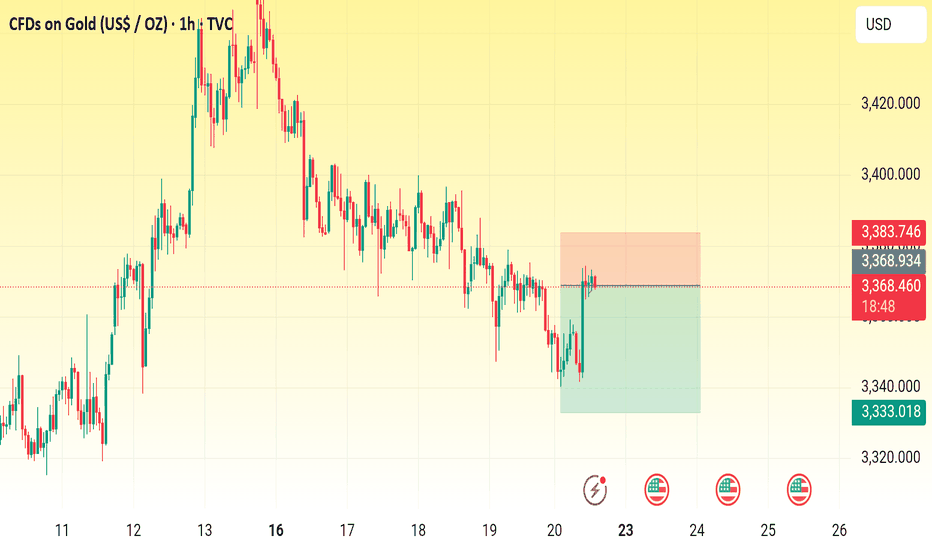
GOLD → Risk zone 3340. Sell-off after rallyFX:XAUUSD , after breaking out of its accumulation phase, rallied towards the 3400 zone of interest, but failed to reach liquidity and reversed, selling off its gains due to economic uncertainty.
In my opinion, the market is unexpectedly subdued and has reacted very weakly to geopolitical problems in the Middle East. The market has digested the news of US airstrikes on Iranian nuclear facilities and is awaiting PMI data from the US and the eurozone, Fed statements, US GDP and other macroeconomic data. The uncertainty factor has done its job... Participants fear further escalation of the conflict, but so far Iran has refrained from taking drastic steps, which has reduced demand for gold as a safe haven asset. Geopolitics and macro statistics remain in focus.
Technically, gold is trading above 3340 (in the buy zone). A retest of the liquidity zone is possible, and if buyers keep the market above 3340-3350, the price may continue to rise.
Support levels: 3347, 3342, 3320
Resistance levels: 3366, 3396
On D1, the key level is the 3340-3347 area. At the moment, we are seeing a sell-off and a move to retest support. Accordingly, a false breakdown and price holding above 3340, followed by a change in character and a breakdown of the bullish structure, will hint at growth. But if the reaction at 3340 is weak and the market continues to storm this support, then in this case, the metal could drop to 3300
Best regards, R. Linda!
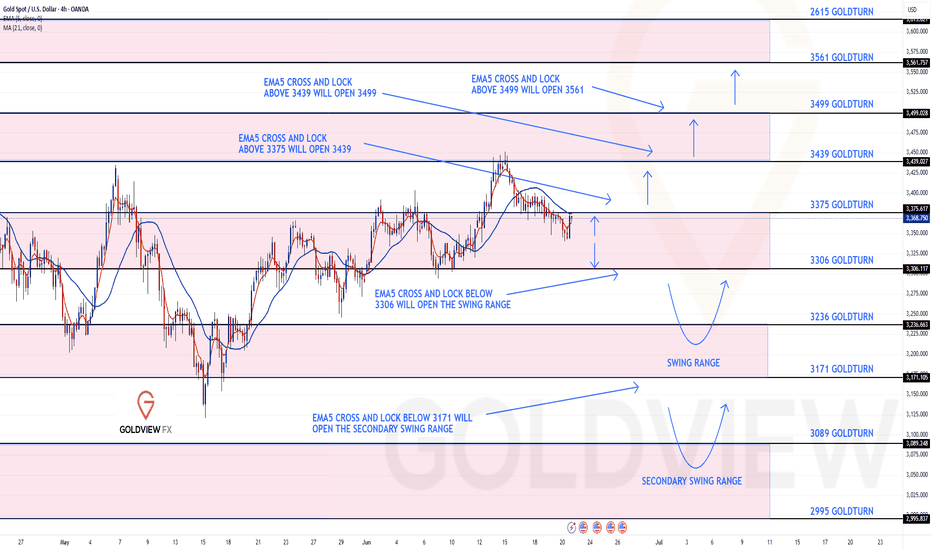
GOLD 4H CHART ROUTE MAP UPDATE & TRADING PLAN FOR THE WEEKHey Everyone,
Please see our updated 4h chart levels and targets for the coming week.
We are seeing price play between two weighted levels with a gap above at 3375 and a gap below at 3306. We will need to see ema5 cross and lock on either weighted level to determine the next range.
We will see levels tested side by side until one of the weighted levels break and lock to confirm direction for the next range.
We will keep the above in mind when taking buys from dips. Our updated levels and weighted levels will allow us to track the movement down and then catch bounces up.
We will continue to buy dips using our support levels taking 20 to 40 pips. As stated before each of our level structures give 20 to 40 pip bounces, which is enough for a nice entry and exit. If you back test the levels we shared every week for the past 24 months, you can see how effectively they were used to trade with or against short/mid term swings and trends.
The swing range give bigger bounces then our weighted levels that's the difference between weighted levels and swing ranges.
BULLISH TARGET
3375
EMA5 CROSS AND LOCK ABOVE 3375 WILL OPEN THE FOLLOWING BULLISH TARGETS
3439
EMA5 CROSS AND LOCK ABOVE 3439 WILL OPEN THE FOLLOWING BULLISH TARGET
3499
EMA5 CROSS AND LOCK ABOVE 3499 WILL OPEN THE FOLLOWING BULLISH TARGET
3561
BEARISH TARGETS
3306
EMA5 CROSS AND LOCK BELOW 3306 WILL OPEN THE SWING RANGE
3236
3171
EMA5 CROSS AND LOCK BELOW 3171 WILL OPEN THE SECONDARY SWING RANGE
3089
2995
As always, we will keep you all updated with regular updates throughout the week and how we manage the active ideas and setups. Thank you all for your likes, comments and follows, we really appreciate it!
Mr Gold
GoldViewFX
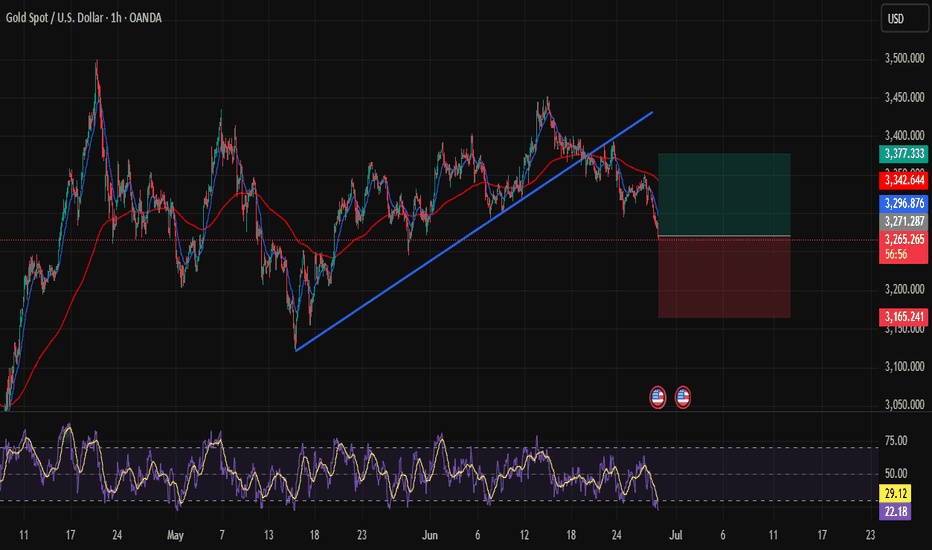
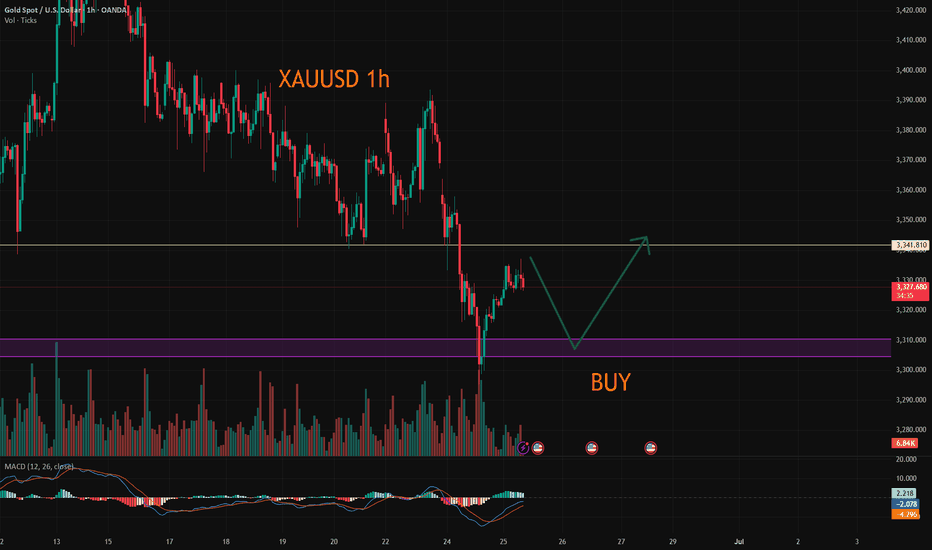
Catching the Perfect Rebound on XAUUSD!Hi traders! , Currently analyzing GOLD (XAUUSD) on the 1H timeframe.
Price has dropped aggressively but is now reacting strongly from a key support zone around 3,271.00, where buyers are stepping in. This area has previously shown significant bullish reactions.
I'm now buying from 3,271.00, expecting a bullish correction towards my target.
Take Profit: 3,377.00
Stop Loss: 3,165.00
RSI is in oversold, indicating potential exhaustion of sellers.
Price may have created a fake breakout below the trendline, trapping liquidity before bouncing back.
Currently managing the trade, watching how price develops around this key area.
Disclaimer : This is not financial advice. This is my personal analysis shared for educational purposes only.
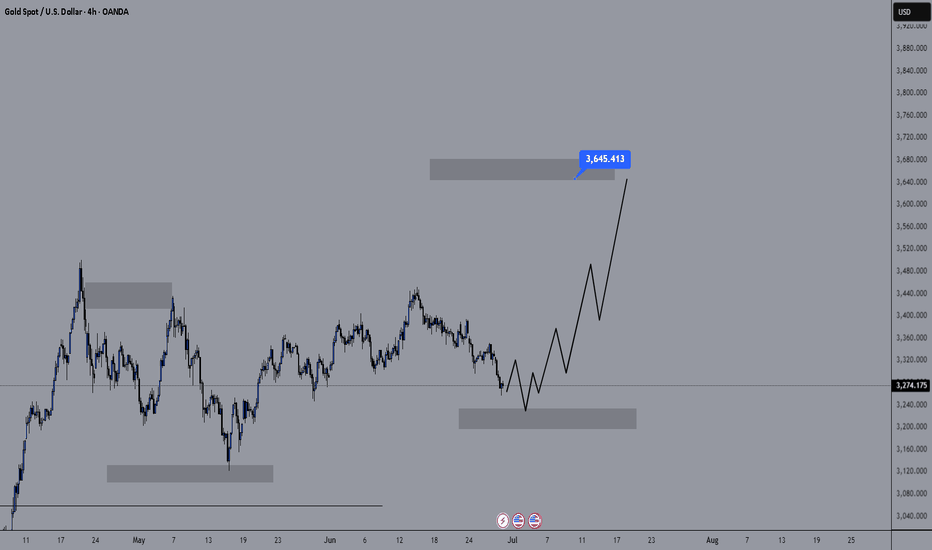
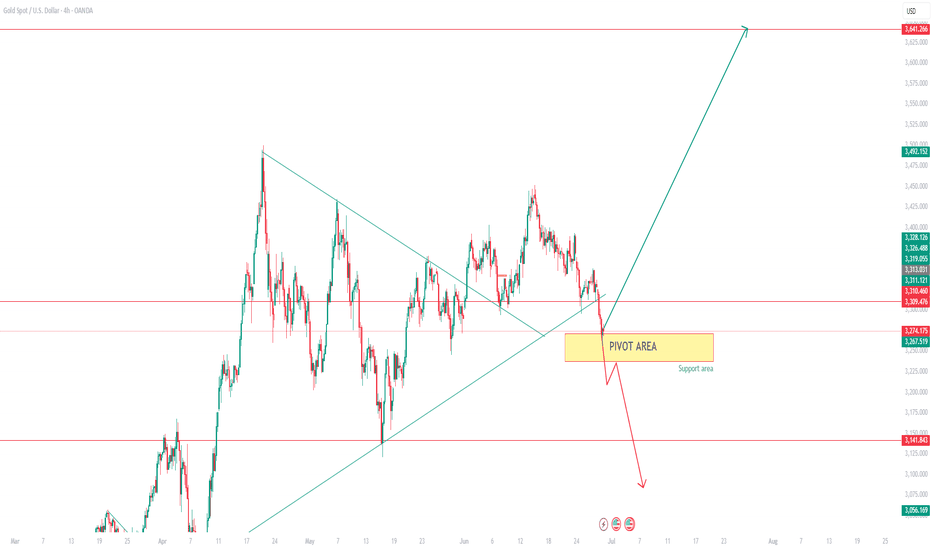
Will this growth spurt be newsless?Hello friends..
As we said in the previous analysis, we are still waiting for another upward leg. (Because the trend is bullish in the long term)
Now we are looking for buying deals in gold next week after the market opens. (Technically, it is in a good range for buying deals)
The lower area that has been identified can be a good range for buying.
You can keep the target for this deal at $3645 (which is good in terms of risk to reward).
.
I hope you have used this analysis well.
You can follow our page to see more analyses.
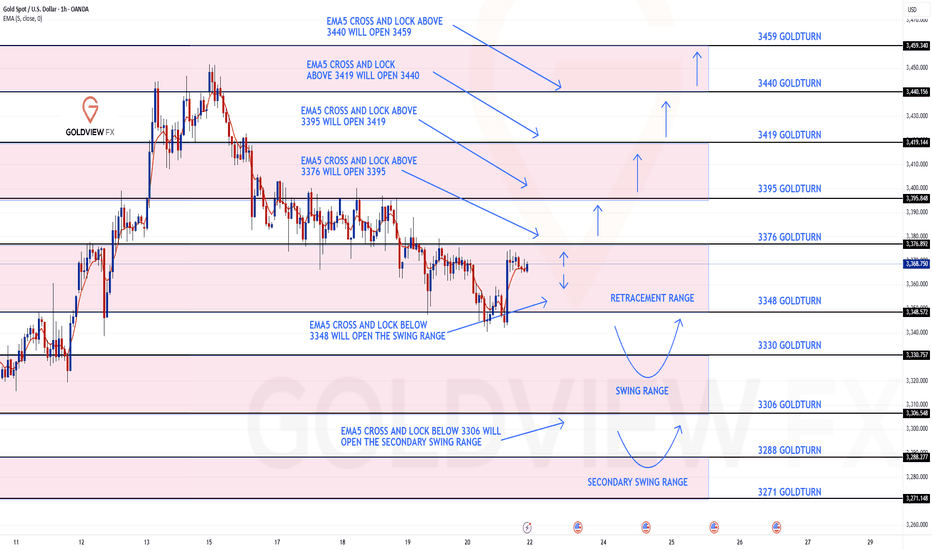
GOLD 1H CHART ROUTE MAP UPDATE & TRADING PLAN FOR THE WEEKHey Everyone,
Please see our updated 1h chart levels and targets for the coming week.
We are seeing price play between two weighted levels with a gap above at 3376 and a gap below at 3348. We will need to see ema5 cross and lock on either weighted level to determine the next range.
We will see levels tested side by side until one of the weighted levels break and lock to confirm direction for the next range.
We will keep the above in mind when taking buys from dips. Our updated levels and weighted levels will allow us to track the movement down and then catch bounces up.
We will continue to buy dips using our support levels taking 20 to 40 pips. As stated before each of our level structures give 20 to 40 pip bounces, which is enough for a nice entry and exit. If you back test the levels we shared every week for the past 24 months, you can see how effectively they were used to trade with or against short/mid term swings and trends.
The swing range give bigger bounces then our weighted levels that's the difference between weighted levels and swing ranges.
BULLISH TARGET
3376
EMA5 CROSS AND LOCK ABOVE 3376 WILL OPEN THE FOLLOWING BULLISH TARGETS
3395
EMA5 CROSS AND LOCK ABOVE 3395 WILL OPEN THE FOLLOWING BULLISH TARGET
3419
EMA5 CROSS AND LOCK ABOVE 3419 WILL OPEN THE FOLLOWING BULLISH TARGET
3440
BEARISH TARGETS
3348
EMA5 CROSS AND LOCK BELOW 3348 WILL OPEN THE SWING RANGE
3330
3306
EMA5 CROSS AND LOCK BELOW 3306 WILL OPEN THE SECONDARY SWING RANGE
3288
3271
As always, we will keep you all updated with regular updates throughout the week and how we manage the active ideas and setups. Thank you all for your likes, comments and follows, we really appreciate it!
Mr Gold
GoldViewFX
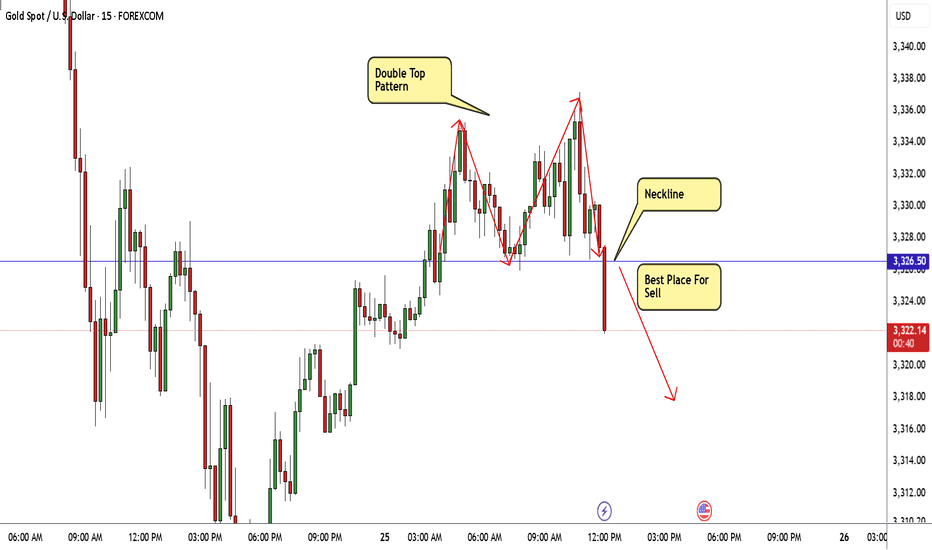
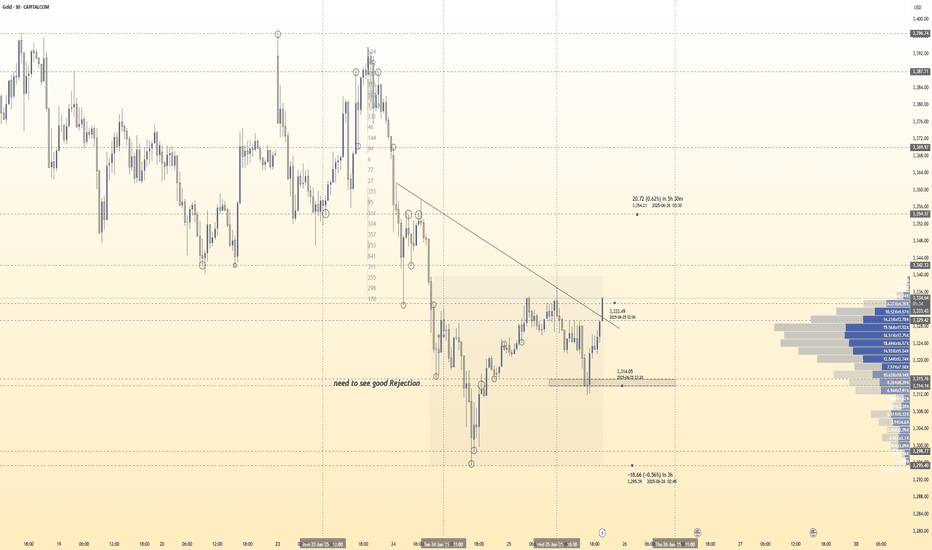
GOLD Made Double Top Reversal Pattern , Ready For Sell ?Here is My 15 Mins Chart On Gold and we have a very good reversal Pattern , double Top , if we have a 15 mins closure below neckline 3326.00 we can enter a sell trade and targeting at least 100 pips as scalping , we can enter direct if you are aggressive trader or if you not you can wait the price to retest neckline and then enter .
GOLD DAILY CHART ROUTE MAPHey Everyone,
Quick update on our Daily chart Goldturn channel setup.
Since our last post, price action has continued to play out within the structure as anticipated but with a new development: we’ve now had the challenge and rejection at the channel top. Price challenged the 3433 axis again but failed to lock above, confirming the resistance remains firm at this level.
To confirm a continuation higher into 3564, we’ll now need to see either a blue candle body close or the EMA5 cross and lock cleanly outside the channel. Without that confirmation, we treat any move to the top as a potential fade opportunity, not a breakout.
On the downside, daily support at 3272 remains intact and continues to anchor our range structure. As long as price holds above this level, we maintain our strategy of buying dips, especially when supported by our weighted Goldturn zones on lower timeframes (1H, 4H).
This rejection further validates the precision of our Goldturn channel. The structure continues to guide us effectively filtering the noise and keeping us on the right side of the setup.
Stay disciplined. The range is still in play until we get a clear break and hold above the top.
Watch 3272 and 3433 closely. The next move will hinge on whether bulls can finally break the ceiling or if sellers continue to defend this range top.
Let the market show its hand.
Mr Gold
GoldViewFX
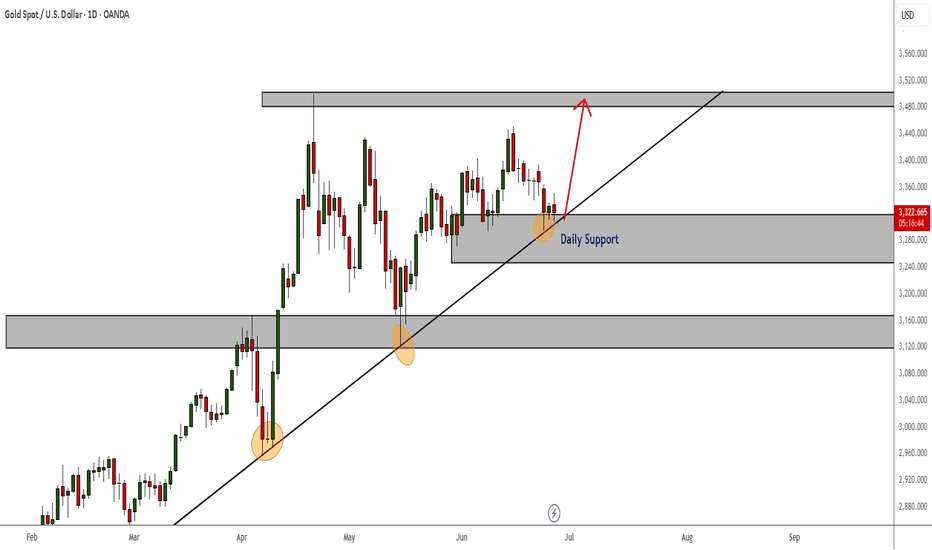
Gold in Support and 3rd touch of trendlineLooking at the daily timeframe, I am still seeing strong signs of a bullish confirmations. Firstly that daily support zone has been rejecting the bears' efforts since the beginning of this month and now we have a 3rd touch of the support trendline.
As long as that daily support zone continues to hold, I remain bullish overall. Even if there still consolidation happening on much lower timeframes in the meantime. I will be ready to catch the bull run upon the right confirmations.
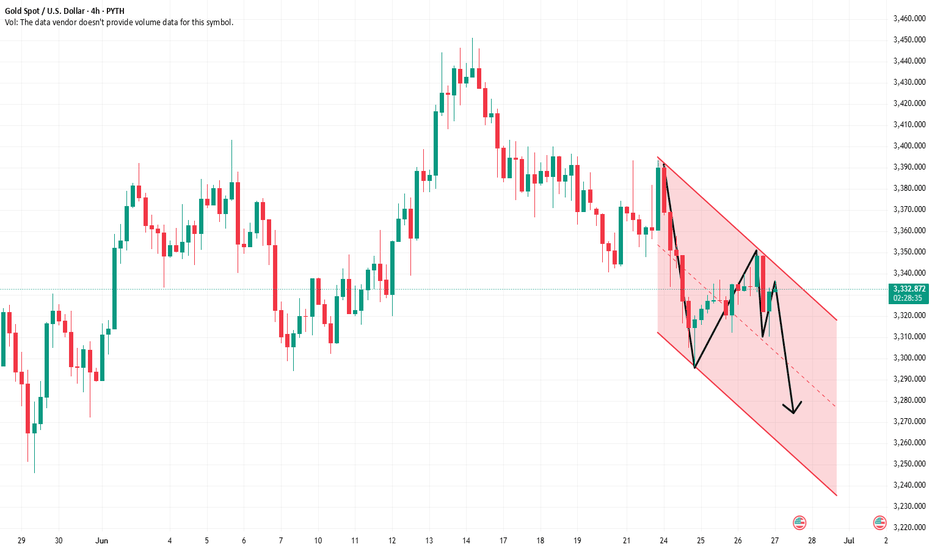
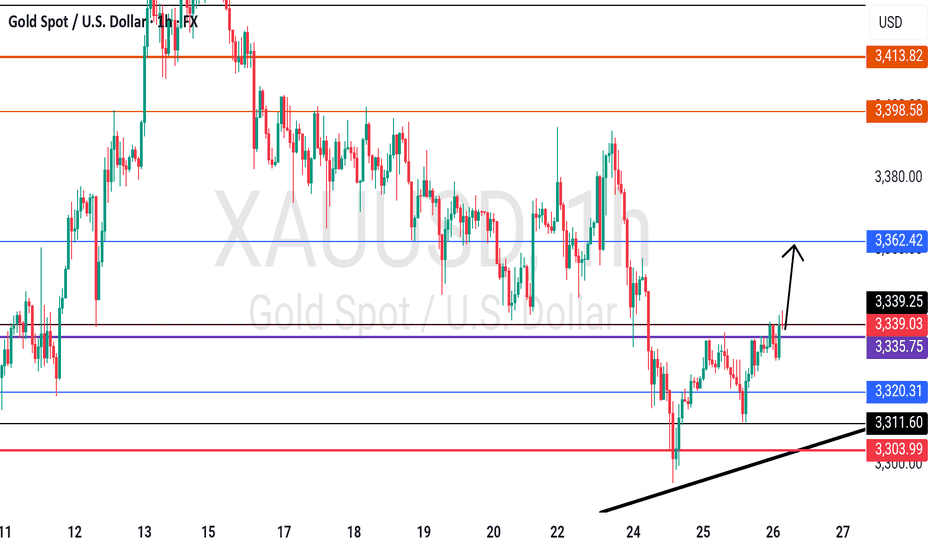
Still bearish!If the short-term bull lifeline 3330 is lost, the trend will be bearish again. The first pressure point above is 3350-the secondary top 3345, and then the 3332-35 area. If the price bulls regain 3335 again, then the operation should be carried out in the range of 3350-3310. It is not recommended to enter the market at the halfway point because it is easy to be washed out. If the daily K line closes below 3340, then 3332-35 is the best position at present. At present, the price is bearish below 40, and it can rely on 3332-31 to continue to be bearish. The target is 3310 and 3924.
XAUUSD:Today's trading strategy
On Tuesday, the news that Trump announced a ceasefire between Iran and Israel dampened the risk aversion sentiment. Subsequently, the news that expectations of interest rate cuts had slowed down led to a further decline in gold prices. During the trading session, it once fell below the 3,300 mark. After the impact of the news weakened, it eventually rebounded to around 3,323, approaching the position where we first entered the market yesterday. Currently, there is no logic in the market. From a technical perspective, The resistance level above is at 3340-45, and the support level below is at 3305-10. We can conduct transactions around this range
Trading strategy:
SELL@3340-45
TP:3310-04
BUY@3305-10
TP:3335-40
More detailed strategies and trading will be notified here ↗↗↗
Keep updated, come to "get" ↗↗↗
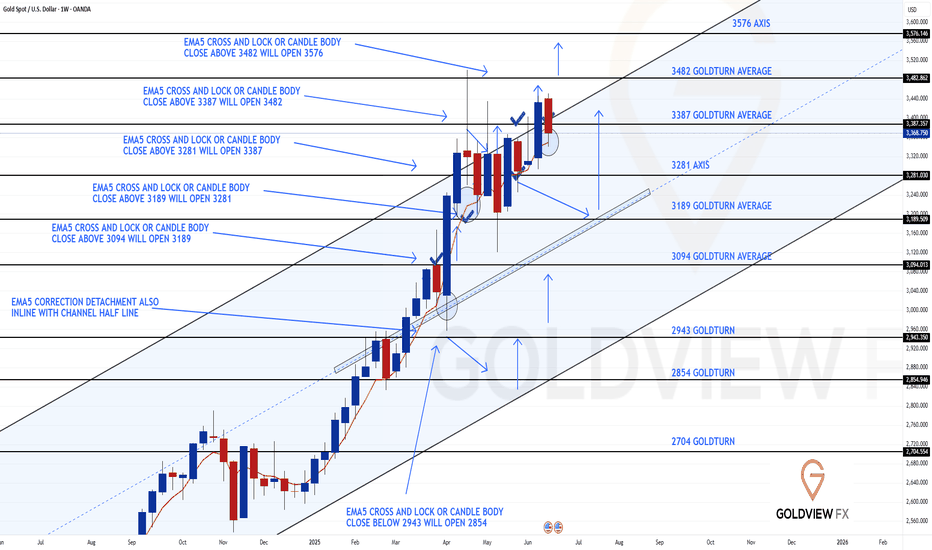
GOLD WEEKLY CHART MID/LONG TERM ROUTE MAPHey Everyone,
Following up on our previous weekly update = last week we saw the expected correction play out with a move down for the EMA5 detachment touch, highlighted by the circle on the chart. This was a healthy pullback within the structure and aligns perfectly with the Goldturn methodology.
While we previously had the candle body close gap at 3482, that target still remains open and active. The move lower was not a breakdown but a technical retest, setting up the potential for continuation higher once momentum returns.
Support continues to hold at 3281, reinforcing our buy the dip strategy within the structure. The price remains guided by the channel and is still following the expected trajectory toward the long term gap target.
We'll be watching closely for renewed strength to drive back toward 3482, and any close above recent highs could reignite that move. Until then, structure remains bullish and contained.
Stay disciplined and let price do the talking.
Mr Gold
GoldViewFX
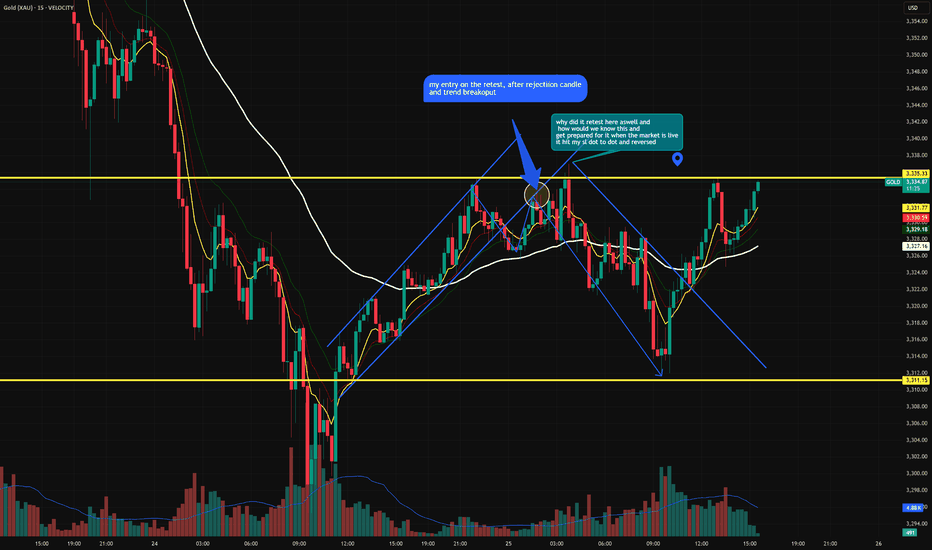
Hanzo Drex | 30-Min Break Out Setup – 200 Pips in Sight🔥 Gold – 15 Min Scalping Analysis
⚡️ Objective: Precision Break out Execution
Time Frame: 15 -Minute Warfare
Entry Mode: Only after verified Break out
👌Bullish Break : 3333.5
Price must break liquidity with high volume to confirm the move.
☄️ Hanzo Protocol: Dual- Entry Intel
Zone Activated: Deep Analysis
➕ 4 wicks connected at 3333
➕ 7 wicks connected at 3329.5
➕ Body Close at 3328
➕ Body Close at 3334
➕ Liquidity at 3344
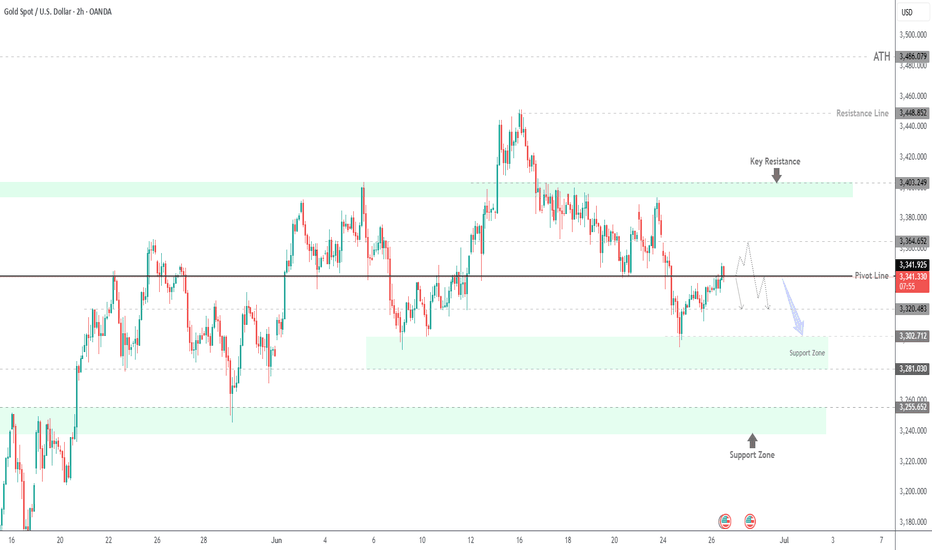
Gold Holds Above $3340 as Dollar Drops and Fed Uncertainty Rises GOLD OVERVIEW
Gold Holds Gains as Dollar Weakens and Fed Uncertainty Grows
Gold climbed above $3,340 per ounce on Thursday, supported by a sharp decline in the U.S. dollar amid growing dovish expectations from the Federal Reserve.
Adding to market speculation, U.S. President Donald Trump hinted he may announce a new Fed Chair as early as September or October, potentially reducing Jerome Powell’s influence before his term ends in June and boosting expectations for a more accommodative policy stance.
TECHNICAL OUTLOOK – XAU/USD
Gold shows bearish potential if the price can stabilize below the pivot level at 3,341.
However, while trading above 3,341, a short-term correction toward 3,364–3,365 is likely before any renewed selling pressure.
Today’s U.S. GDP release may add further volatility and direction to the market.
Key Levels
Pivot Line: 3,341
Resistance: 3,364 → 3,373
Support: 3,320 → 3,302
previous idea:
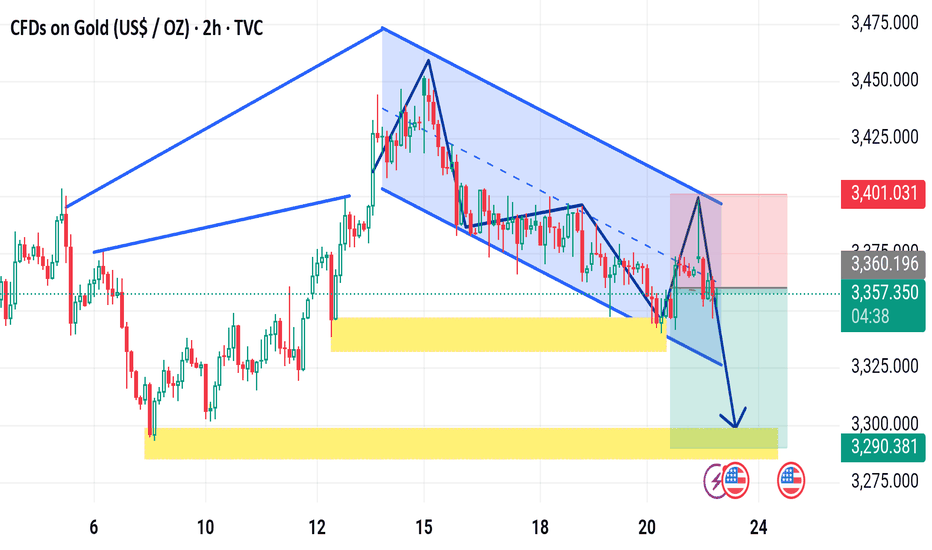
Xauusd market update The chart you've shared is a 2-hour price chart for CFDs on Gold (US$/OZ) and presents a bearish setup. Here's a detailed breakdown of the analysis:
---
📉 Pattern Overview:
The price is currently moving within a descending channel (highlighted in blue).
A bearish flag or descending parallel channel is clearly visible, indicating continuation to the downside.
There is a clear lower high and lower low structure, reinforcing the bearish sentiment.
---
⚠️ Key Zones:
Yellow zones mark key support levels.
First support zone around 3,320 (minor support).
Second, stronger support zone around 3,290.
The upper red box (near 3,401) indicates a stop-loss region.
The green box shows a take-profit target area, aligned with the support.
---
📊 Trade Setup Indicated:
Entry: Around current price (~3,357).
Stop-loss: ~3,401 (above the recent high).
Take-profit: ~3,290 zone (support zone below).
Risk-to-reward ratio (R:R): Favorable, likely around 1:2 or more.
---
🔔 Fundamental Overlay:
Icons at the bottom (flags and lightning bolt) show upcoming U.S. economic events, which could add volatility and may impact gold price action — something to watch closely before entering.
---
✅ Summary:
This is a bearish trade setup expecting a breakdown from the channel and a move toward the 3,290 support. It’s a technically sound setup assuming no major reversal catalyst from the U.S. economic events shown.
Would you like an updated version with live prices or to run a backtest on this pattern?
Luxury, War, and Clarity – This Is the Golden Reset.🟨 The Real Gold Era: Clarity While the World Burns 🟨
"While some bleed in the streets, others sip cocktails in the Bahamas. This is not a coincidence. This is the new world."
Right now, we live in a time like no other.
People are dying in wars they never chose.
Currencies collapse. Nations threaten each other.
And yet — capital flows, gold climbs, and the rich get richer.
🕰️ A war started long ago — and most never saw it:
2020–2022: They printed trillions. COVID shut down the world. Fiat was silently devalued.
2022–2023: Russia was cut off from SWIFT. BRICS started buying gold. The dollar was no longer untouchable.
2023–2024: Gold broke $2100… then $2400… now $3400+. Even high interest rates can't stop it.
2025: U.S. and Israel strike Iran. BRICS discuss a gold-backed currency. Trust in fiat? Gone.
The Gold Era is no longer just metaphor. It’s the new battlefield.
💣 "War is loud. Wealth is silent."
While bombs fall in the East,
✨ capital quietly moves to safe havens.
While families flee,
✨ smart money finds gold, data, and sovereign positioning.
While headlines scream chaos,
✨ traders make decisions in silence.
🌍 But here's the paradox:
We also live in a world of unmatched abundance:
You can build a brand from a phone.
You can trade gold from a beach.
You can learn SMC, AI, geopolitics — and use it to build freedom.
You can escape the system, if you understand the structure.
In this gold era, the true asset isn't just metal.
It's mental clarity. Information. Sovereignty.
The gold is you.
📉 This isn’t just about trading.
It’s about knowing where we are in the timeline of collapse and rebirth.
The markets don’t lie — they expose what’s really coming.
And those who read them… can rise while others fall.
🧠 Final note:
Not everyone survives a reset.
But those who think in structure, who lead with clarity — they don’t just survive.
They reposition.
They build.
They lead.
🟡 Welcome to the Real Gold Era.
Where charts speak louder than news.
Where truth is a position.
Where you don’t wait for safety — you create it.
—
✍️ GoldFxMinds – where structure meets truth.
📢 Disclosure: This analysis was created using TradingView charts through my Trade Nation broker integration. As part of Trade Nation’s partner program, I may receive compensation for educational content shared using their tools.
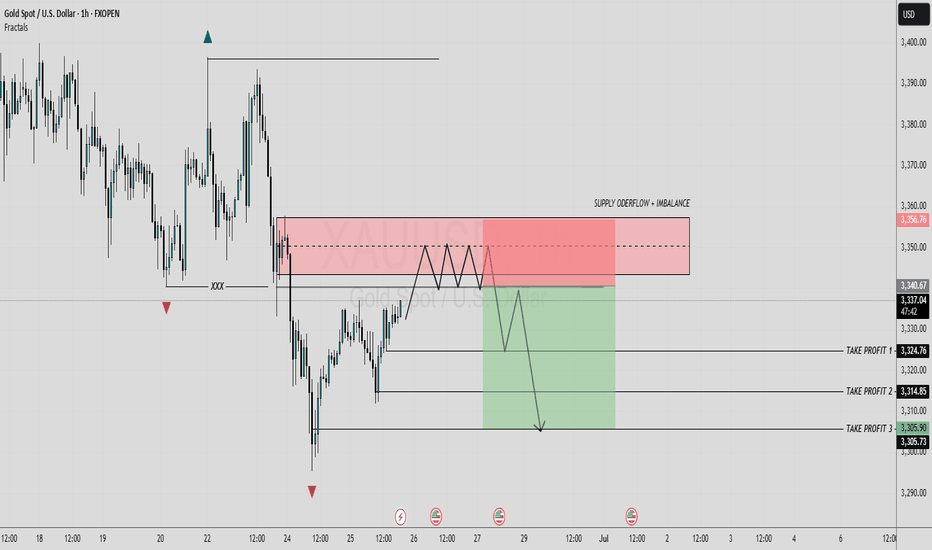
GOLD REVERSAL POINT [Bearish Bias]According to this analysis, today I'm expecting a sell opportunity. So here we're analyze 1H time frame, Price is currently moving near a strong order flow area, and has also SIBI is pending. If price faces clear rejection from this key levels, So there is a high probability that the market may decline from this level. Wait with patient and maintain discipline, confirmation is key.
Now let's see how our sell zone plays out.
Always use stoploss for your trade.
Always use proper money management and proper risk to reward ratio.
#GOLD 1H Technical Analysis Expected Move.
