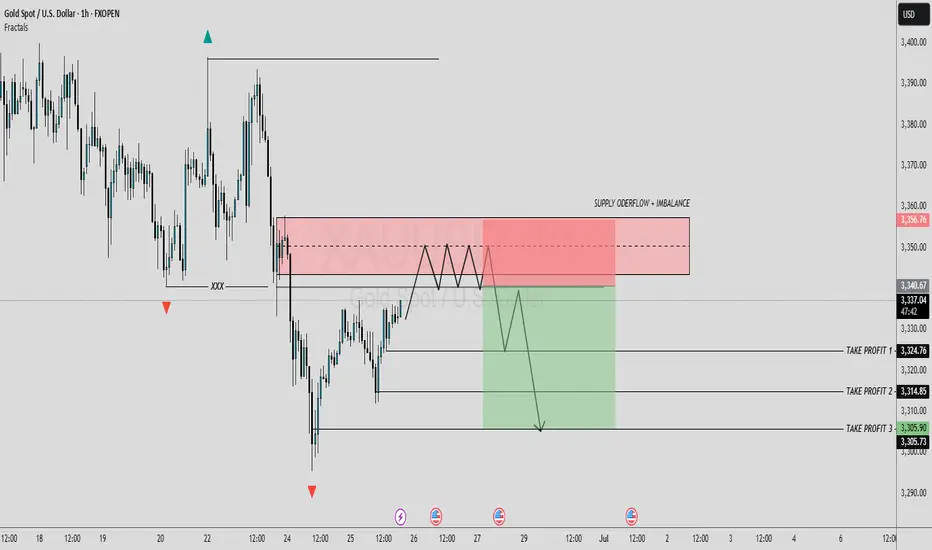
GOLD REVERSAL POINT [Bearish Bias]According to this analysis, today I'm expecting a sell opportunity. So here we're analyze 1H time frame, Price is currently moving near a strong order flow area, and has also SIBI is pending. If price faces clear rejection from this key levels, So there is a high probability that the market may decline from this level. Wait with patient and maintain discipline, confirmation is key.
Now let's see how our sell zone plays out.
Always use stoploss for your trade.
Always use proper money management and proper risk to reward ratio.
#GOLD 1H Technical Analysis Expected Move.
XAUUSDK trade ideas
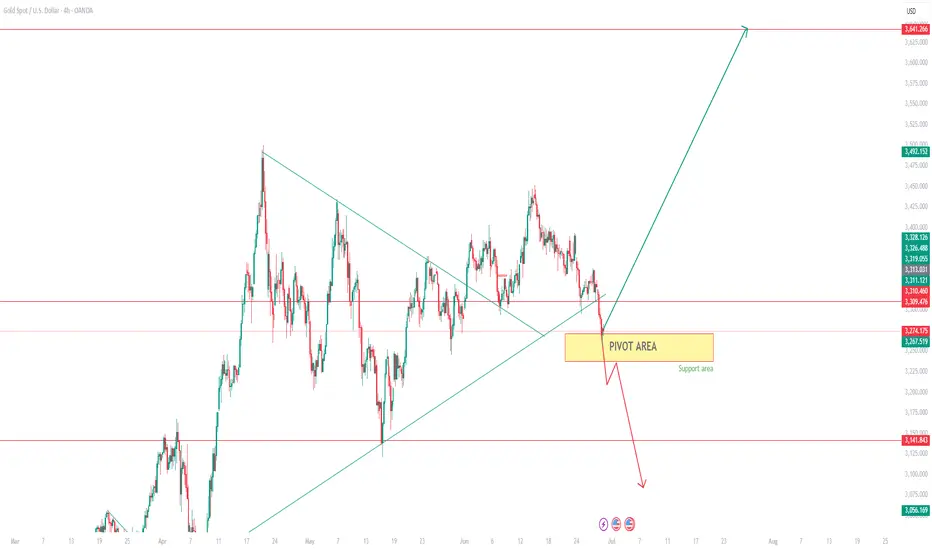
GOLD in PIVOT AREAGold is in the support area. The commodity is expected to hit the levels of 3461 in rejected from here ( 80% Chance).
However the pair can fall further if the price breaks the levels of 3200.
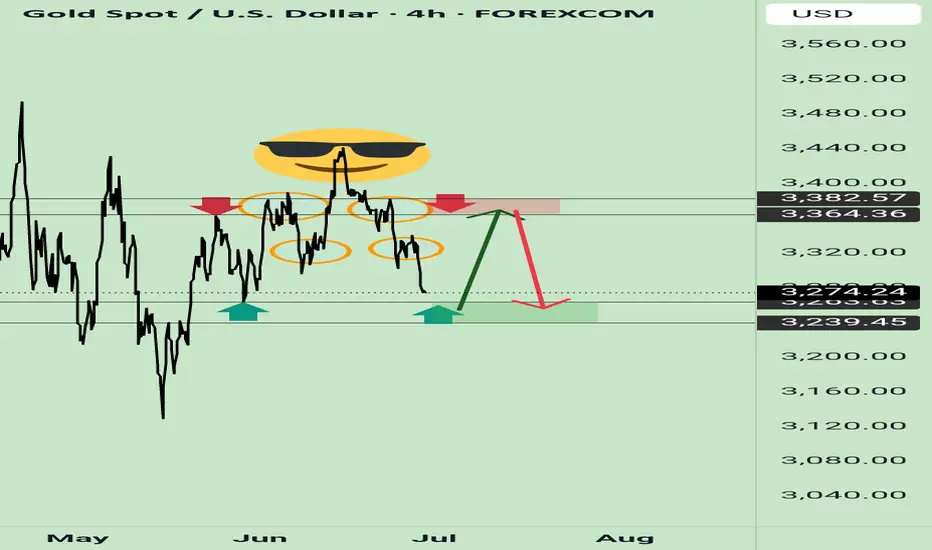
My idea gold wavesCheck my idea gold waves expected moves as per my readings
Rule SL must use and enjoy
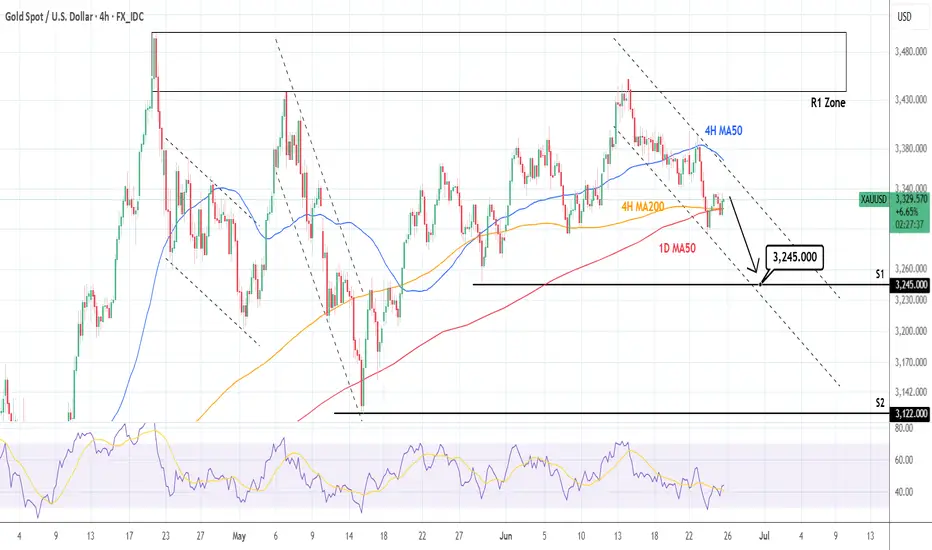
XAUUSD: Trend changed to bearish. Significant downside potentialGold turned neutral again on its 1D technical outlook (RSI = 49.253, MACD = 18.142, ADX = 16.679) as it crossed below both the 4H MA200 and 1D MA50. The two form a Bearish Cross. Technically a Channel Down has emerged, no different than those that emerged after rejections on the R1 Zone (like now). As long as the 4H MA50 acts as a Resistance and holds, we will be bearish, aiming at the S1 level (TP = 3,245).
## If you like our free content follow our profile to get more daily ideas. ##
## Comments and likes are greatly appreciated. ##
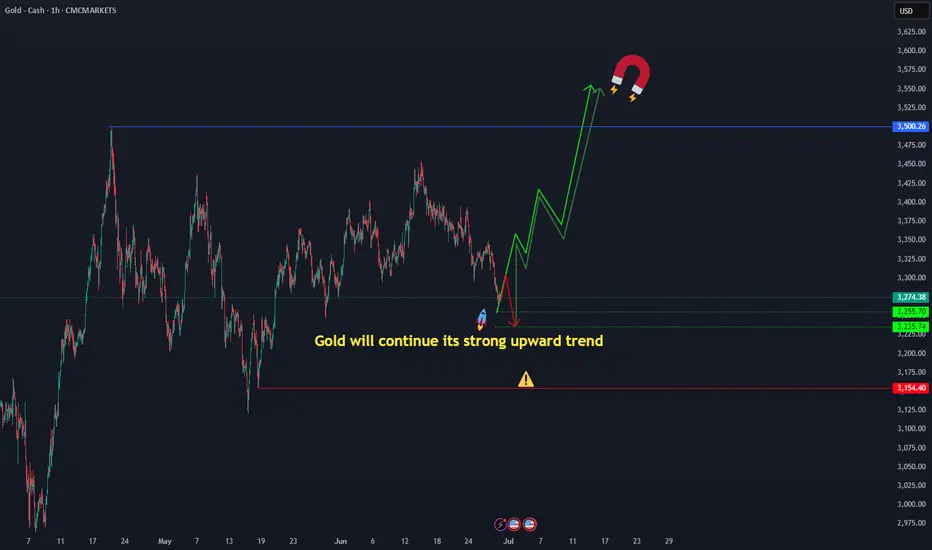
gold strong upwardGold will continue its strong upward trend, the corrections seem to have come to an end, the gold price is certain to reach above $3500, if the current price and the price of 3235 break down, you should not panic, the direction of the gold price movement is still towards the ceiling ( ATH ) CMCMARKETS:GOLD
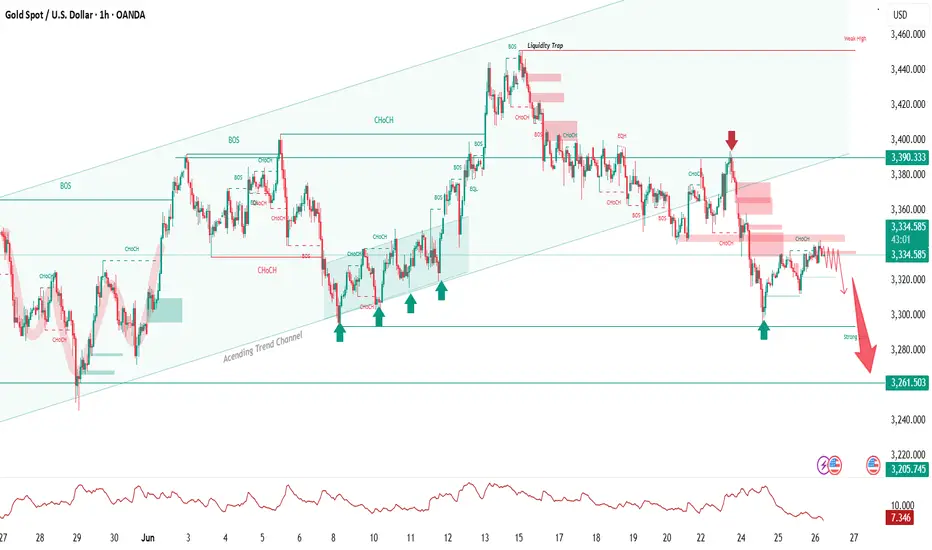
XAUUSD – Bearish Setup Following Liquidity Trap and Channel BreaGold has confirmed a bearish setup after breaking down from the ascending trend channel and trapping buyers near 3,390.
Technical breakdown:
Price engineered a liquidity trap above equal highs, inducing breakout longs near 3,390.
The rejection from that level triggered a clear change of character (CHoCH) and subsequent breaks of structure (BOS) to the downside.
The ascending channel, respected since early June, has now been invalidated with strong bearish momentum.
Lower highs are forming beneath key supply zones around 3,340, reinforcing institutional sell pressure.
Bearish bias:
Price is currently retesting a minor supply zone with signs of weakness.
As long as price holds below 3,340, bearish continuation is likely.
Targeting the strong low at 3,261, followed by the next demand at 3,205 if momentum persists.
This setup reflects smart money principles: engineered liquidity, structure shift, and supply-driven order flow.
Invalidation:
A clean break and close above 3,390 with BOS to the upside would invalidate this setup.
XAUUSD SHORT SELL TRADE IDEA SIGNALSAfter thoroughly analyzing the charts, we are currently setting up for a short trade, awaiting confirmation on LTF charts.
GOLD BUYWith the escalation of war in the middle east and the current U.S.A involvement, Gold is expected to sky rocket
GOLD SHORT FROM RESISTANCE
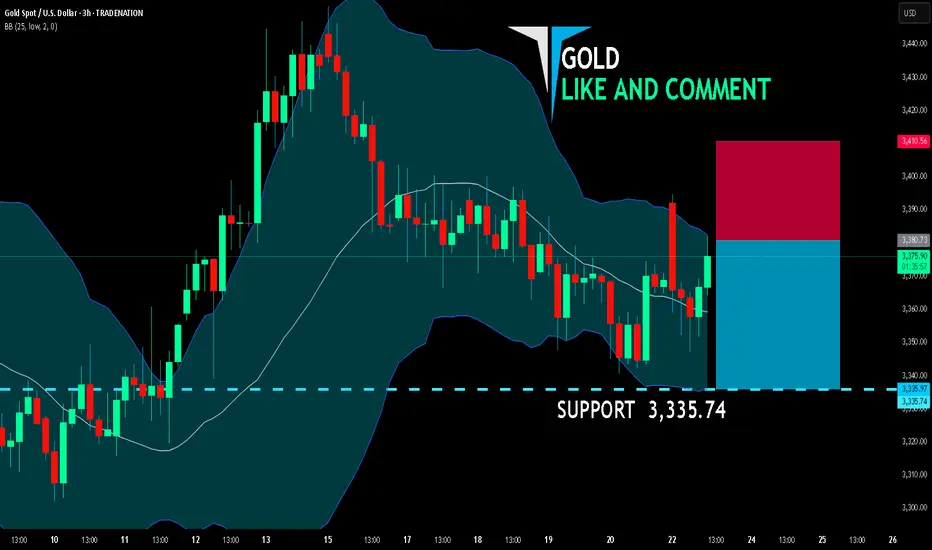
GOLD SIGNAL
Trade Direction: long
Entry Level: 3,380.73
Target Level: 3,335.74
Stop Loss: 3,410.56
RISK PROFILE
Risk level: medium
Suggested risk: 1%
Timeframe: 3h
Disclosure: I am part of Trade Nation's Influencer program and receive a monthly fee for using their TradingView charts in my analysis.
✅LIKE AND COMMENT MY IDEAS✅
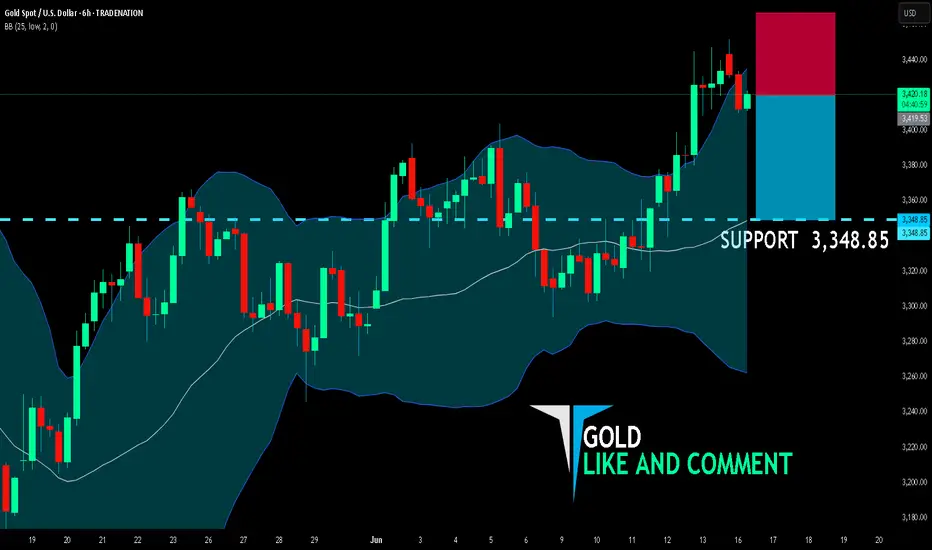
GOLD BEARS WILL DOMINATE THE MARKET|SHORT
GOLD SIGNAL
Trade Direction: short
Entry Level: 3,419.53
Target Level: 3,348.85
Stop Loss: 3,466.65
RISK PROFILE
Risk level: medium
Suggested risk: 1%
Timeframe: 6h
Disclosure: I am part of Trade Nation's Influencer program and receive a monthly fee for using their TradingView charts in my analysis.
✅LIKE AND COMMENT MY IDEAS✅
Is today Black Friday?On Thursday, gold prices rose to 3350 with support from 3333-30. When the key support of 3320 was broken, it indicated that the short-term rise turned into a fall. This morning, the rebound to 3320 confirmed the pressure of the top and bottom conversion, and then slowly fell all the way to break the integer mark of 3300 US dollars.
In 4 hours, it has fallen below the previous low of 3295, and will continue to fall. There are two support positions below, namely 3277 and 3263. Don’t expect a big rebound before going short in the negative market. If the rebound is large, it will not fall. This kind of negative decline is generally judged by the 15- and 30-minute patterns. When resistance appears in the big cycle, the market has actually fallen a lot.
Today, I think the pressure is mainly in the 3300 and 3310 areas. 3310 can be considered as the pressure of the top and bottom conversion. Pay attention to 3377 and 3363 below. If you consider more, you may be at a relatively extreme position of 3363. For the time being, the general direction is mainly short.

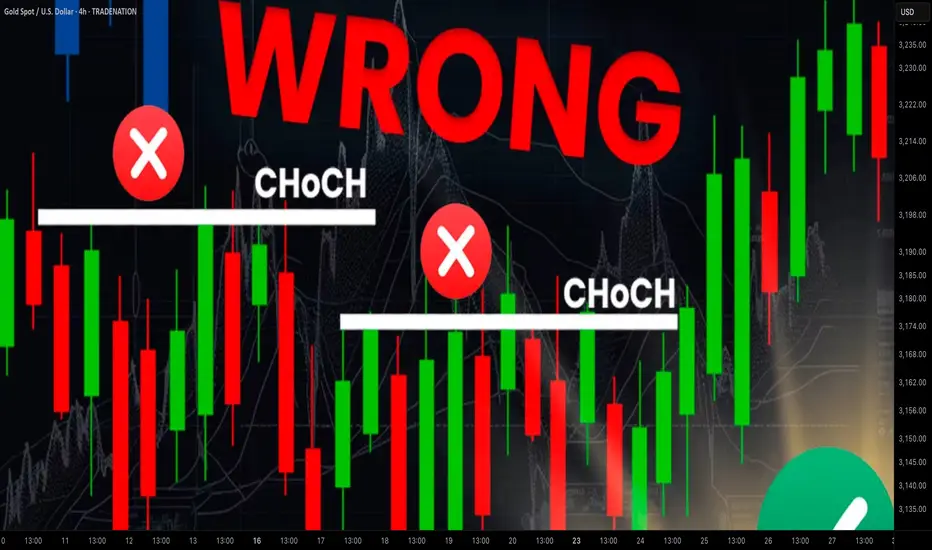
Learn Best Change of Character CHoCH Model in Trading with SMC
Most of the SMC traders get Change of Character CHoCH WRONG!
In this article, I will share with you Change of Character models that have a low accuracy and better to be avoided.
I will teach you the best CHoCH model for Forex Gold trading and show you how to identify it easily.
Let's start with the basic theory first and discuss what Change of Character signifies.
Change of Character in Bearish Trend
In a downtrend, Change of Character CHoCH is an important event that signifies a violation of a bearish trend.
CHoCH is confirmed when the price breaks and closes above the level of the last lower high.
Above, is a text book Change of Character model in a bearish trend.
For the newbie traders, such a price action provides a strong signal to buy while it fact it is NOT .
One crucial thing is missing in this model to confirm a bullish reversal.
According to basic trend analysis rules, we say that the market trend is bullish if the price forms a bullish impulse, retraces and sets a Higher Low HH , forms a new bullish impulse with a new Higher High HH.
Only then, we can say that the market is trading in up trend.
CHoCH model above confirms a bearish trend violation BUT it does not confirm a trend change.
Such a model may easily signify a deeper correction.
Look what happened with GBPNZD.
Though the price formed a confirmed bearish CHoCH, it was a false signal and just an extended correction.
That's a perfect bullish reversal model.
It combines CHoCH and conditions for a bullish trend.
Such a union is extremely accurate in predicting up movements.
Examine a price action on USDJPY.
Not only the price formed a confirmed CHoCH but also we see a start of a new bullish trend.
Change of Character in Bullish Trend
In an uptrend, Change of Character CHoCH is a significant event that signifies a violation of a bullish trend.
CHoCH is confirmed when the price breaks and closes below the level of the last higher low.
Above is a typical model of a bearish CHoCH.
For many traders, that is the signal to open short.
However, it is not that accurate and one important component is missing there.
According to basic price action rules, the market trend is bearish
if the price forms at least 2 bearish impulses with Lower Lows LL and a pullback between them with a Lower High LH.
Only when these 3 conditions are met, a bearish trend is confirmed .
Perfect bearish Change of Character model should include both CHoCH and a bearish trend price action. That will confirm a violation of a bullish trend and start of a new bearish trend.
EURCAD has a very strong potential to continue falling:
not only we see a valid bearish Change of Character but also
a start of a new bearish trend based on a price action.
Next time when you identify CHoCH on forex market, make sure that you check the preceding price action. It will help you to more accurate assess reversal probabilities and make a wiser trading decision.
❤️Please, support my work with like, thank you!❤️
I am part of Trade Nation's Influencer program and receive a monthly fee for using their TradingView charts in my analysis.
XAU/USD) Bullish trand Read The captionSMC trading point update
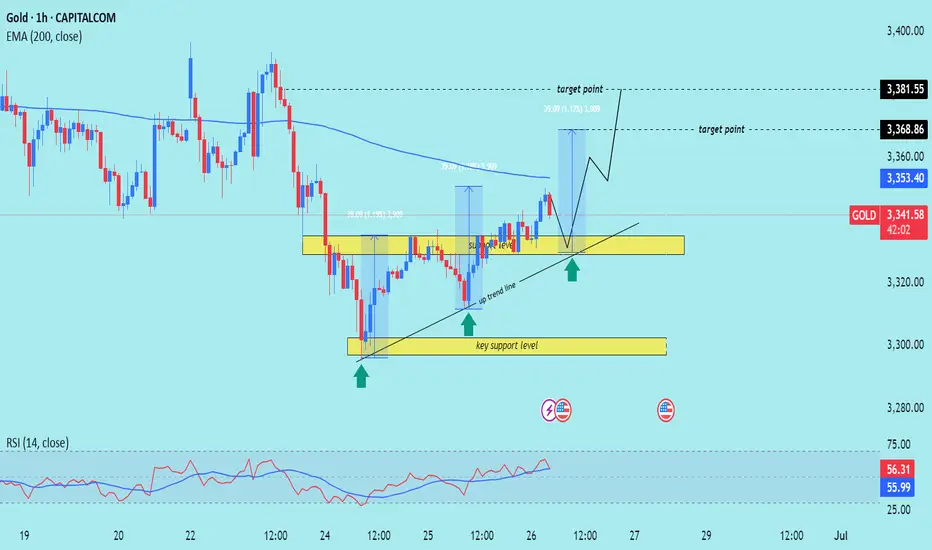
Technical analysis of Gold (XAU/USD) on the 1-hour timeframe, highlighting a breakout from consolidation supported by key levels and trend structure. Here’s the detailed analysis:
---
Technical Breakdown
1. Key Support Zone
Price has formed a strong base around 3,315–3,325, with multiple bullish rejections (green arrows).
This zone has acted as a demand level, reinforcing bullish structure.
2. Ascending Trendline Support
An uptrend line supports higher lows, showing momentum building to the upside.
3. EMA 200
Price is now challenging the 200 EMA (3,353.41) — a key dynamic resistance.
A successful breakout and retest above this EMA will likely fuel continued bullish movement.
4. Breakout & Measured Move Projections
The chart indicates a bullish breakout from a consolidation box (yellow zone).
Measured move targets based on the previous rally:
First target: 3,368.86 (1.17%)
Second target: 3,381.55 (1.75%)
5. RSI Confirmation
RSI (14) is around 57, showing bullish momentum but still below overbought—supporting further upside potential.
Mr SMC Trading point
---
Conclusion / Idea Summary
Bias: Bullish
Entry Zone: On pullback into 3,330–3,340 range or breakout retest above EMA 200
Targets:
3,368.86
3,381.55
Invalidation: Sustained close below 3,320 and break of the uptrend line
---
Please support boost 🚀 this analysis)
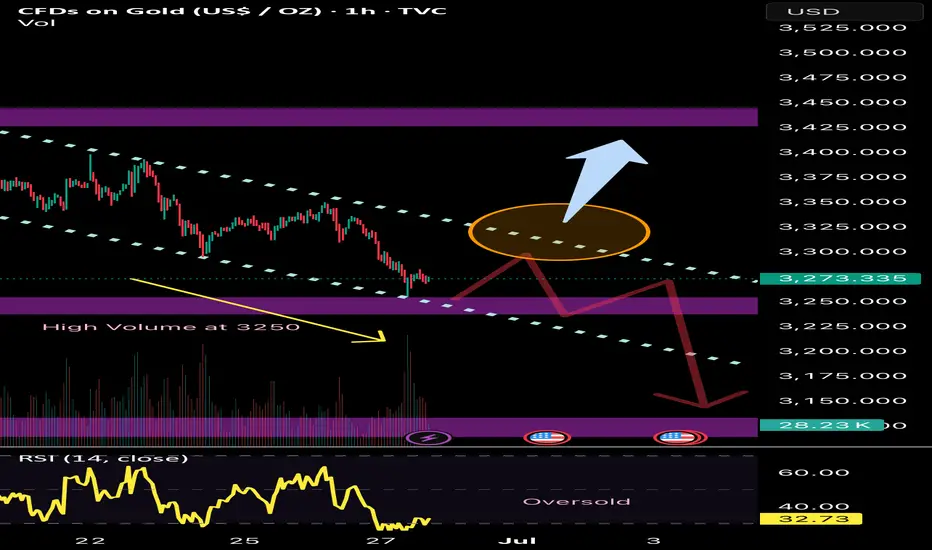
Will the FALL continues?Last trade idea was fulfilled and went into the downside. Targeted 3250. If this 3250 major support area breaks down, we can expect a bigger downside move.
However, there’s a huge buying that happened at that level. It may first have a pullback upwards before it continues its decline. RSI is also at oversold level.
Bullish reversal can be confirmed if 3350 gets broken.
GOLD The US 10-year Treasury yield is approximately 4.29%-4.37%
The US Dollar Index (DXY) is trading near 97.877, showing relative stability with minor fluctuations
Impact on Markets Today
The slight decline in the 10-year yield suggests modest easing of bond market pressure, possibly reflecting cautious investor sentiment amid ongoing fiscal concerns and expectations of Fed rate cuts later this year.
The DXY near 97.9 indicates a moderately strong dollar, though recent trends show some weakening due to fiscal worries and softer economic data.
Together, a stable-to-slightly weaker dollar and a modestly lower 10-year yield can support safe-haven assets like gold, though elevated yields still pose a headwind. But despite the dips of both the 10 year us government bond yield and the dollar index ,GOLD lost over 500pips from Asian session to Newyork session trading on cease fire deal between Israel and Iran by united states of America.
In brief: The US 10-year yield’s slight dip combined with a steady DXY reflects a market balancing inflation, fiscal concerns, and Fed policy outlook. This environment supports cautious risk-taking with safe-haven demand still relevant.
follow zone of buy and sell for educational purpose only.
#gold #dollar
Hanzo Drex | 15-Min Bullish Reversal Setup – 300 Pips in Sight🔥 Gold – 15 Min Scalping Analysis
⚡️ Objective: Precision Reversal Execution
Time Frame: 15 -Minute Warfare
Entry Mode: Only after verified Reversals
👌Bullish Reversal : 3397
Price must break liquidity with high volume to confirm the move.
☄️ Hanzo Protocol: Dual-Direction Entry Intel
➕ Zone Activated: Strategic liquidity layer detected — mapped through refined supply/demand mechanics. Volatility now rising. This isn’t noise — this is bait for the untrained. We're not them.
🦸♂️ Tactical Note:
The kill shot only comes after the trap is exposed and volume betrays their position.
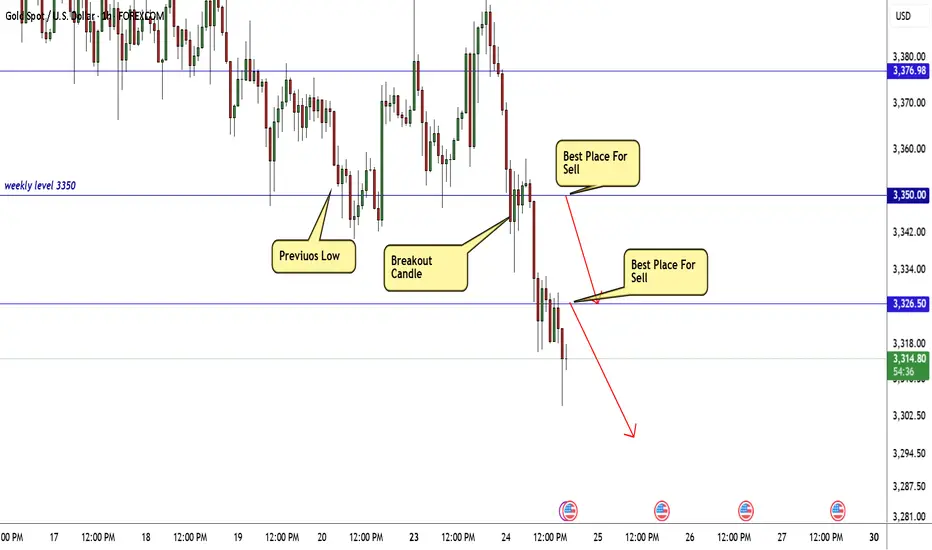
GOLD 2 Best Places For Sell Very Clear , Don`t Miss 300 Pips !Here is my opinion on Gold at the moment after the price moved very hard to downside as i mentioned in the last update , now we have a very good 2 places to sell it again , the first one @ 3326.00 , it`s a very good place to sell it cuz it was a very good support and the price break it and now it will play as a good res so we can sell from it , and if the price go higher we can sell from area between 3350 : 3345.00 , it will be a great place to sell it also , and if the highest place who force the price to downside we can add another sell entry from 3326.00 if we have a daily closure below it .
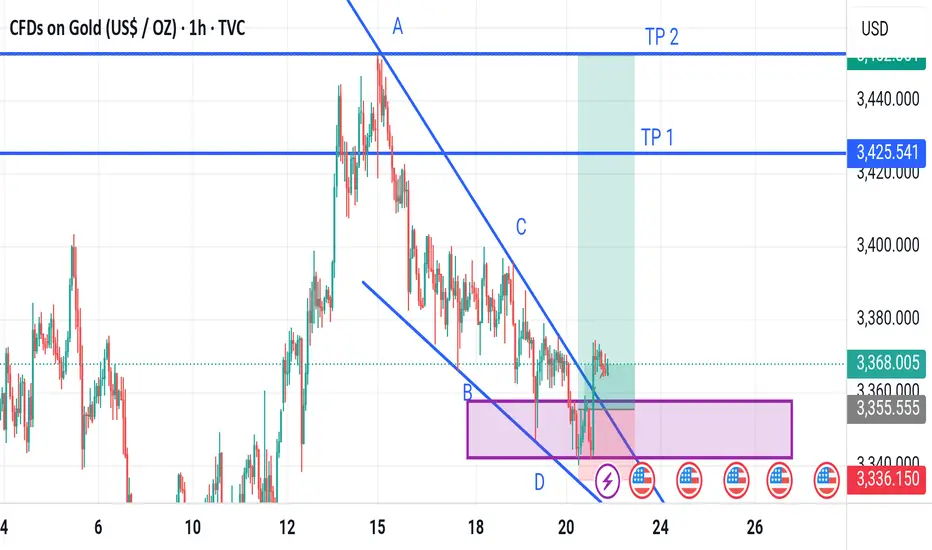
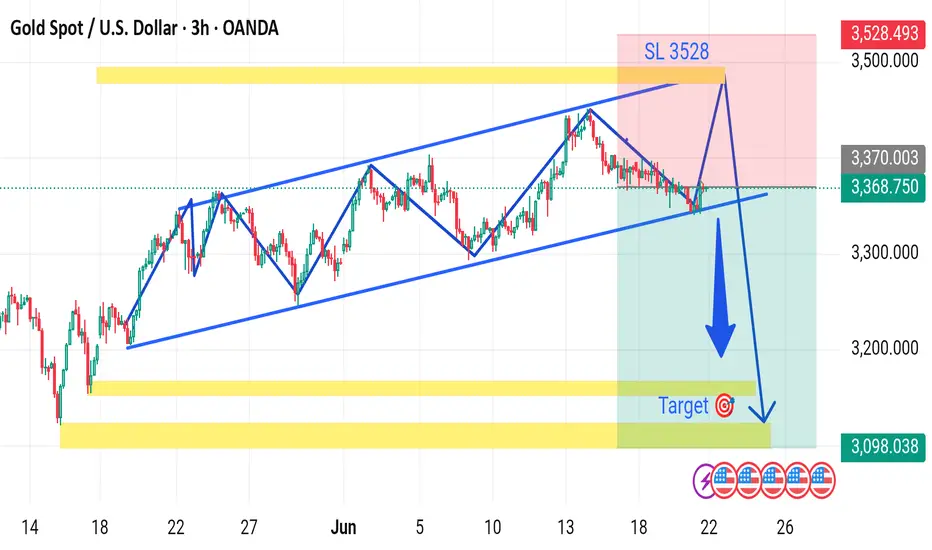
XAUUSD NEXT WEEK UPDATE The chart you provided is a technical analysis of Gold Spot (XAU/USD) on a 3-hour timeframe, showing a bearish setup with the following key features:
---
🔍 Chart Analysis Summary:
Price Channel:
The price has been moving within an ascending channel (marked by two blue lines) but is now testing the lower boundary of this channel.
Breakout Direction:
A bearish breakout is projected, indicated by the large blue downward arrow. This suggests a possible trend reversal from bullish to bearish.
Entry & Target:
Current Price: ~3368.75
Target Price: ~3098.03
This matches the previous demand/support zone (yellow horizontal band near the bottom).
Stop Loss (SL):
Placed at 3528, just above recent highs to manage risk.
Risk Zone:
The red area shows the risk if price moves against the trade (stop loss zone).
The green area shows the reward zone (target profit area), highlighting a favorable risk/reward ratio.
Event Indicators:
Several economic event icons are placed near the projected move date (~June 24–26), suggesting that fundamental catalysts may support this move (e.g., FOMC, CPI, etc.).
---
✅ Bearish Setup Summary:
Setup Type: Bearish channel breakout
Sell Entry: On break and close below channel support (~3368)
Stop Loss: 3528
Take Profit: 3098
R/R Ratio: Favorable
Would you like a written trade plan or a summary in table format?
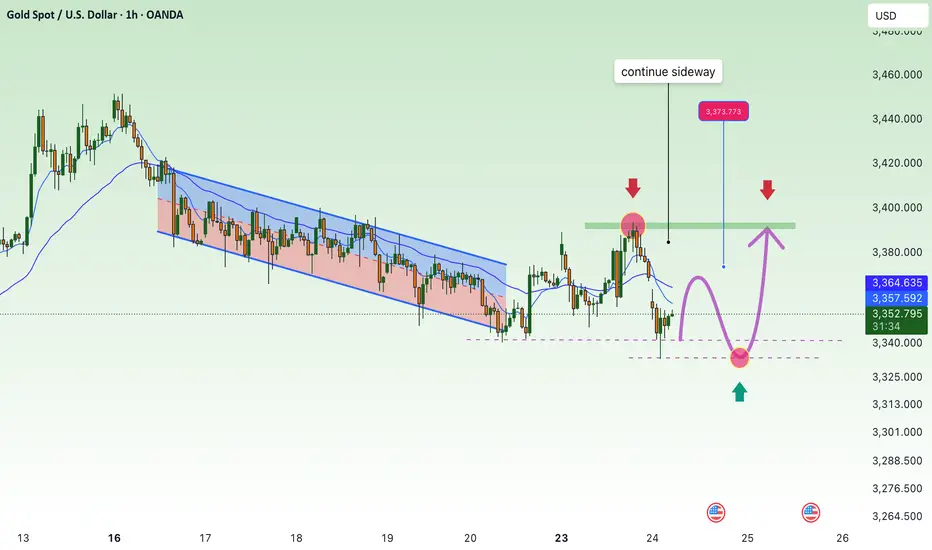
GOLD continue sideway , SELL 3393⭐️GOLDEN INFORMATION:
Gold prices remain well-supported during the North American session following breaking news that Iran has launched retaliatory strikes on US military bases in Qatar. The escalation comes in response to Washington’s weekend assault on Iranian nuclear facilities. As geopolitical tensions in the Middle East dominate headlines, investors have largely sidelined US economic data. At the time of writing, XAU/USD is trading at $3,385, up 0.39%.
Macroeconomic indicators have taken a backseat as heightened conflict drives market sentiment. Citing Israeli media, Al Arabiya reported that Iran targeted US bases in Qatar, Kuwait, and Iraq with missile strikes. In a further escalation, Tehran approved the closure of the strategic Strait of Hormuz and launched additional missiles at Israeli targets—amplifying safe-haven demand for gold.
⭐️Personal comments NOVA:
Gold prices reacted to a decrease in positive news about peace in the Middle East, continuing to accumulate.
⭐️SET UP GOLD PRICE:
🔥SELL GOLD zone: 3392- 3394 SL 3399
TP1: $3382
TP2: $3370
TP3: $3360
🔥BUY GOLD zone: $3319-$3317 SL $3312
TP1: $3327
TP2: $3338
TP3: $3349
⭐️Technical analysis:
Based on technical indicators EMA 34, EMA89 and support resistance areas to set up a reasonable BUY order.
⭐️NOTE:
Note: Nova wishes traders to manage their capital well
- take the number of lots that match your capital
- Takeprofit equal to 4-6% of capital account
- Stoplose equal to 2-3% of capital account
Gold Buy- Go for buy if setup given
- just a small trade
- Refine entry with smaller SL for better RR, if your strategy allow
A Message To Traders:
I’ll be sharing high-quality trade setups for a period time. No bullshit, no fluff, no complicated nonsense — just real, actionable forecast the algorithm is executing. If you’re struggling with trading and desperate for better results, follow my posts closely.
Check out my previously posted setups and forecasts — you’ll be amazed by the high accuracy of the results.
"I Found the Code. I Trust the Algo. Believe Me, That’s It."
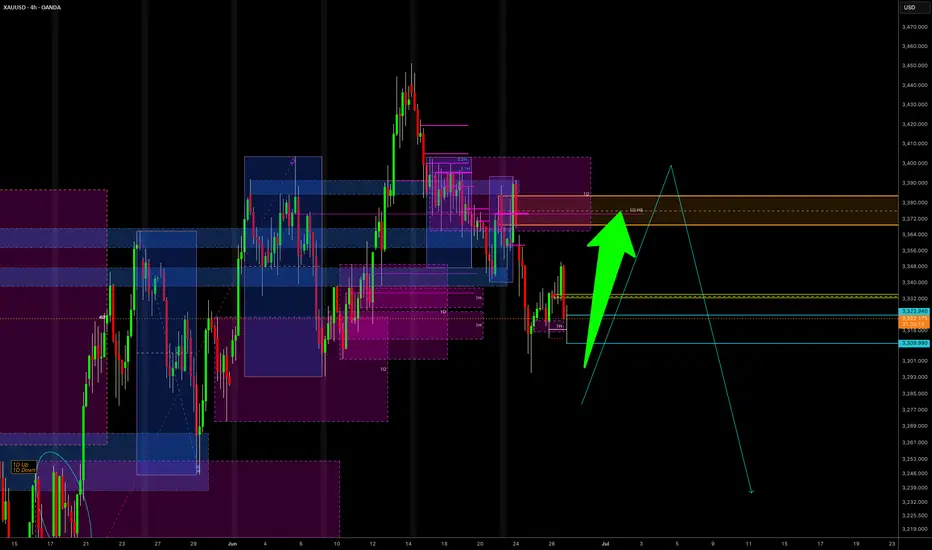
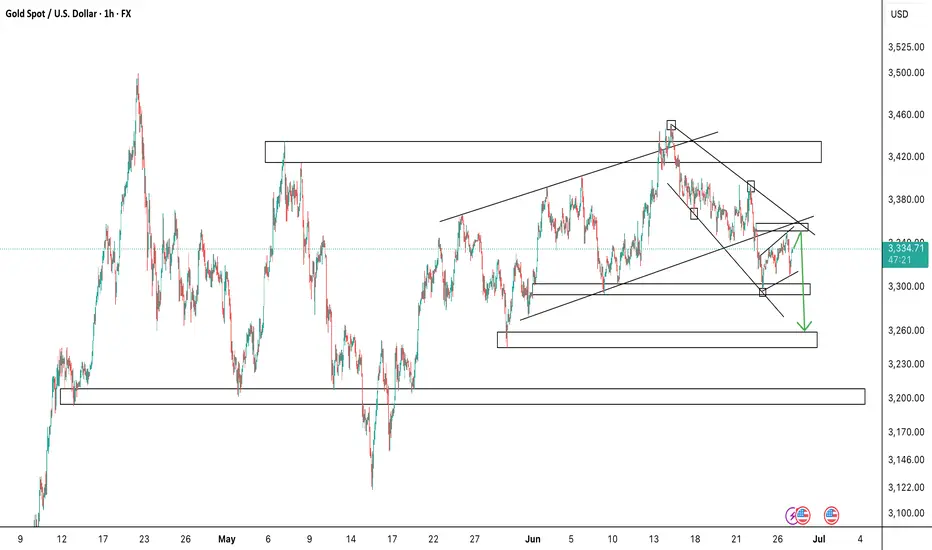
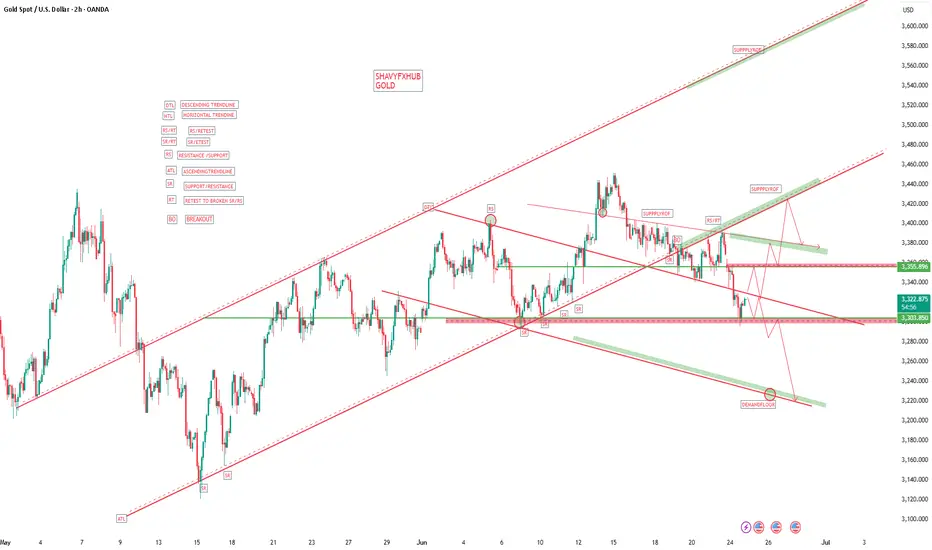
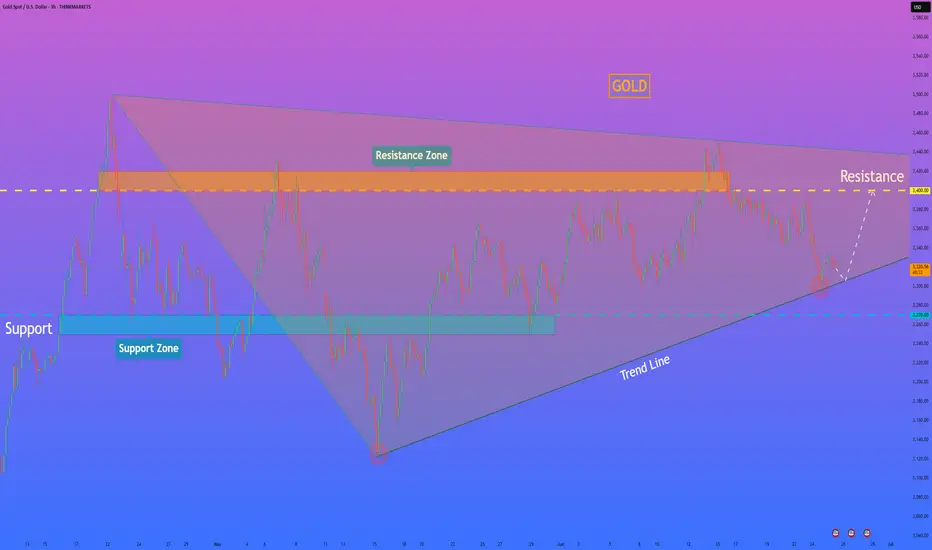
HelenP. I Gold will rebound up from trend line to $3400 levelHi folks today I'm prepared for you Gold analytics. After looking at this chart, we can see how the price after a prolonged consolidation inside a large wedge pattern, XAUUSD, approached the ascending trend line again - this line has acted as a key support several times in the past. This time is no exception: the price reacted to it with a bullish bounce. We can see a confluence here — trend line support coincides with the lower boundary of the wedge and the local support zone at 3270 - 3250 points. Now the price is trading above this line, showing early signs of recovery. Given the symmetry of this structure and past behavior, I expect gold to continue rising from current levels. The nearest major obstacle lies in the resistance zone around 3400 - 3420, which acted as a turning point before. That’s why my current goal is set at the 3400 level. If bulls hold the trend line, we may see a steady move toward this key resistance. Given the trend line reaction, wedge structure, and current momentum, I remain bullish and expect further growth. If you like my analytics you may support me with your like/comment ❤️
Disclaimer: As part of ThinkMarkets’ Influencer Program, I am sponsored to share and publish their charts in my analysis.
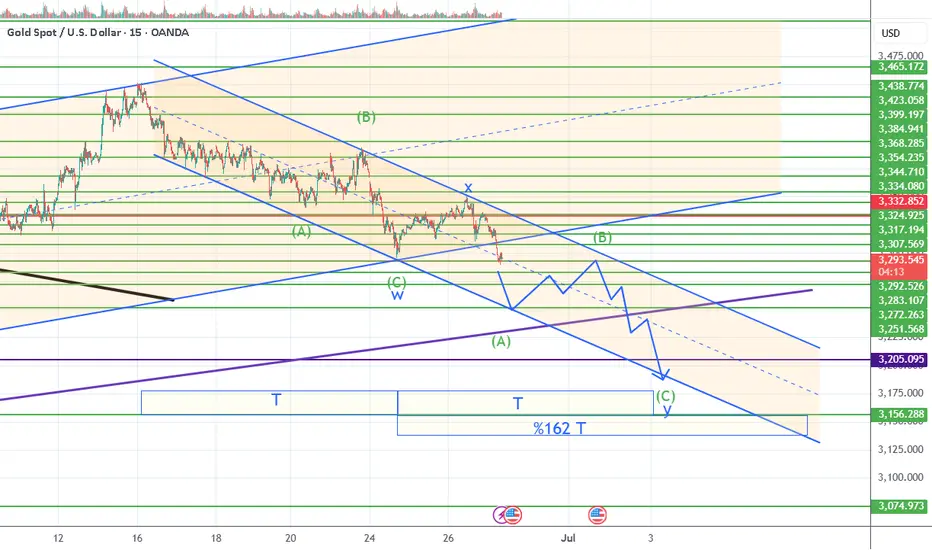
XAUUSD Gold Correction Movesit s a correction, it s messy, it is complicated but also it is necesery, so this is a sell until the brake of channel, until probably next week friday or so.. i expect 3251-3205 or maybe little bit lower targets
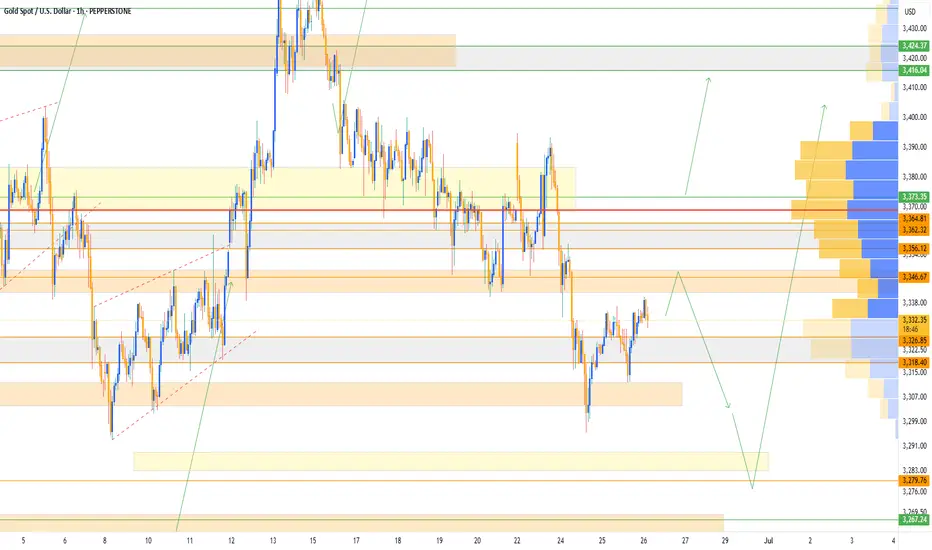
Gold 1H Intra-Day Chart 26.06.2025Option 1: Gold rejects from $3,346 & drops towards $3,280.
Option 2: Gold keeps moving higher into another strong demand zone of $3,416.
Which scenario do you find more likely?