XAUMO REPORT: XAUUSD WEEKLY ANALYSIS
Period: Monday June 30 – Friday July 5
Focus: US Independence Day (July 4), NY Market Closure Impact
🟢1. Price Action Context
Last Week (ending June 28):
Weekly bearish engulfing closed near the lows (~3,250 area).
Series of failed rallies above 3,330.
Price compressed in a tight lower range—distribution, not accumulation.
Monday June 30 – Friday July 5:
Market begins in a low-confidence, low-volume environment.
Tuesday–Wednesday: traders will be positioning ahead of July 4 closure.
Thursday (July 4): NY market closed—no COMEX metals futures settlement.
Friday (July 5): NY market reopens—liquidity and volume surge back in.
🟡 2. Range, Support & Resistance
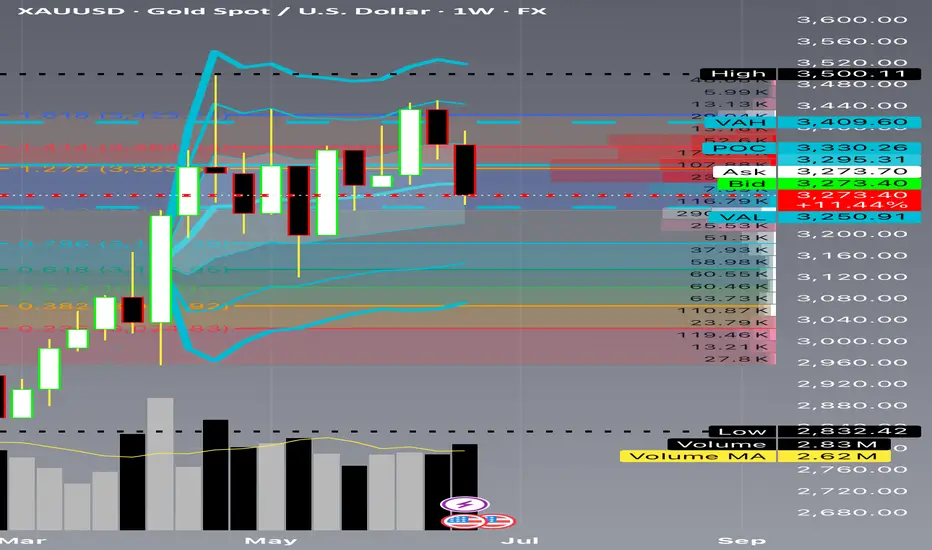
Composite Volume Profile:
VAH: ~3,410
POC: ~3,330 (where the heaviest volume has been transacted)
VAL: ~3,250 (final defense)
Support:
3,250: major structural shelf
3,200: next key liquidity target
Resistance:
3,330–3,350: loaded supply zone
3,390–3,420: overhead liquidity from prior weeks
Interpretation:
Price under POC, hugging VAL, is bearish.
Acceptance under 3,250 sets up a vacuum to 3,180–3,200.
🔵 3. Volume Footprint and Delta
Footprint Characteristics:
Strong negative delta (-21K) as price approached 3,250.
Buyers unable to lift offers at 3,300+.
Repeated ask dominance = supply persistence.
Institutional Read:
They’re selling into every bounce, and liquidity thinness around July 4 increases stop-hunt potential.
🟣 4. Trend and Wave Structure
Weekly trend: bearish
Daily trend: bearish with lower highs and lower lows
Wave count:
Wave 1: 3,500 ➡ 3,273
Wave 2: retrace ~3,330
Wave 3: active—projected target 3,180
🟤 5. Stop Hunt Zones
Above:
3,330–3,350: obvious short stops and breakout buy stops.
Below:
3,250: stop cluster from dip buyers and trapped longs.
Expected Behavior:
Institutions use Wednesday and low liquidity Thursday to spike stops before the real move on Friday.
Stop Hunt Scenario:
July 3–4: quick liquidity sweep above 3,330.
July 5 (Friday): NY reopen—supply steps in, drives price back down.
🟢 6. Market Closure & Liquidity Impact
NY Market Closure Schedule:
July 4 (Thursday):
NY COMEX metals closed for Independence Day.
Forex open but liquidity ~40% of normal.
Price can move erratically with minimal volume.
July 3 (Wednesday):
Early close in many US desks.
Position squaring—thin books.
July 5 (Friday):
Liquidity flood back in—true directional follow-through likely.
Implications:
Avoid heavy positioning during July 4 closure.
Expect false breakouts and “ghost candles”.
Major moves likely Friday July 5 during NY session.
🟠 7. Psychological Dynamics
Retail:
FOMO if price spikes above 3,330 on low liquidity.
Fear if price knifes under 3,250 without volume confirmation.
Institutions:
Use the holiday to:
Clear out stops.
Create liquidity pools.
Accumulate positions for Friday’s push.
🔴
8. Tangible Day-Trader Scenarios
🟢 Scenario A: Pre-Holiday Stop Hunt Trap
When: July 3–4
Price spikes over 3,330 on low volume.
Footprint shows negative delta quickly after.
Execution:
Sell limit ~3,340.
SL: 3,375.
TP: 3,200.
Note: Keep size reduced—thin conditions are volatile.
🟣 Scenario B: Post-Holiday Breakdown
When: Friday July 5
NY opens, volume returns.
Price fails to reclaim 3,250 after test.
Execution:
Sell stop 3,249.
SL: 3,310.
TP: 3,180.
Scale in as confirmation strengthens.
🟠 Scenario C: Holiday Range
When: July 4–early July 5 pre-NY
Price likely ranges 3,250–3,330.
Avoid entries unless volatility contraction ends with volume breakout.
🟡 9. Hypothetical Institutional Trade Plan
✅ Order Type: Sell Stop
✅ Entry: 3,249
✅ Stop Loss: 3,310
✅ Take Profit: 3,180
✅ Position Size: Max 0.5–1% account risk
✅ Trigger: NY session reopens Friday with volume confirmation
✅ Confidence: 85% (post-holiday breakdowns historically have high follow-through)
🟢 10. The Executive Recap
✅ Timeframe:June 30–July 5
✅ Trend:Weekly/Daily bearish
✅ Volume:Negative delta clusters
✅ Stop Hunts:
3,330–3,350 (trap)
3,250 (flush)
✅ Liquidity Event:July 4 closure reduces liquidity by ~60%
False moves likely
Major move probable Friday NY session
✅ Execution:
Low liquidity: reduced size
Confirmation: delta + volume
No chasing pre-closure
#GoldTrading #XAUUSD #ForexTrader #PriceActionTrading #TechnicalAnalysis #VolumeProfile #FootprintAnalysis #InstitutionalTrading #DayTrading #MarketAnalysis #ForexSignals #ComexGold #TradingStrategy #MarketPsychology #LiquidityTraps #StopHunt #NYMarketClosure #July4Trading #MetalsMarket #TrendAnalysis #WaveAnalysis #SupplyAndDemand #SmartMoney #ForexEducation #CMEGroup #TradingMindset #RiskManagement
⚠️ Disclaimer : This is a purely educational scenario. You are the only one responsible for your risk.
XAUUSDK trade ideas
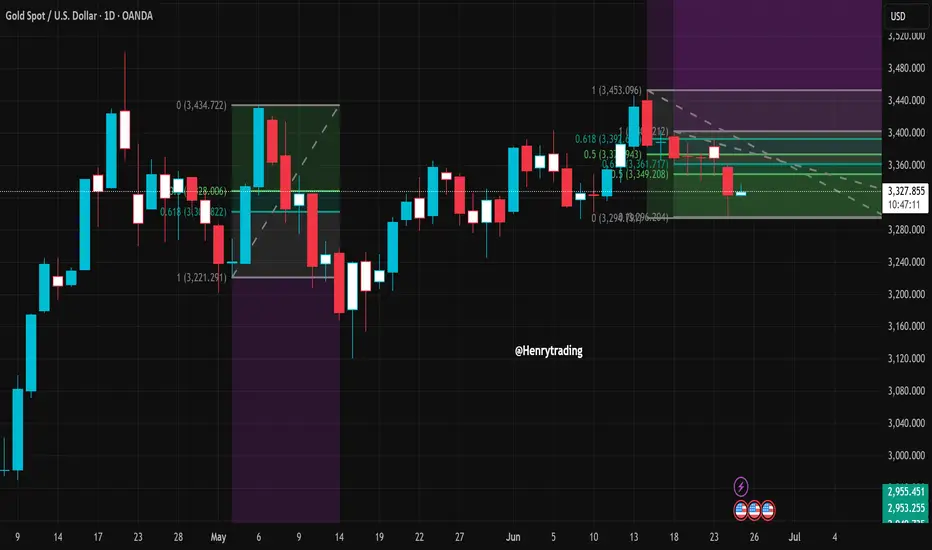
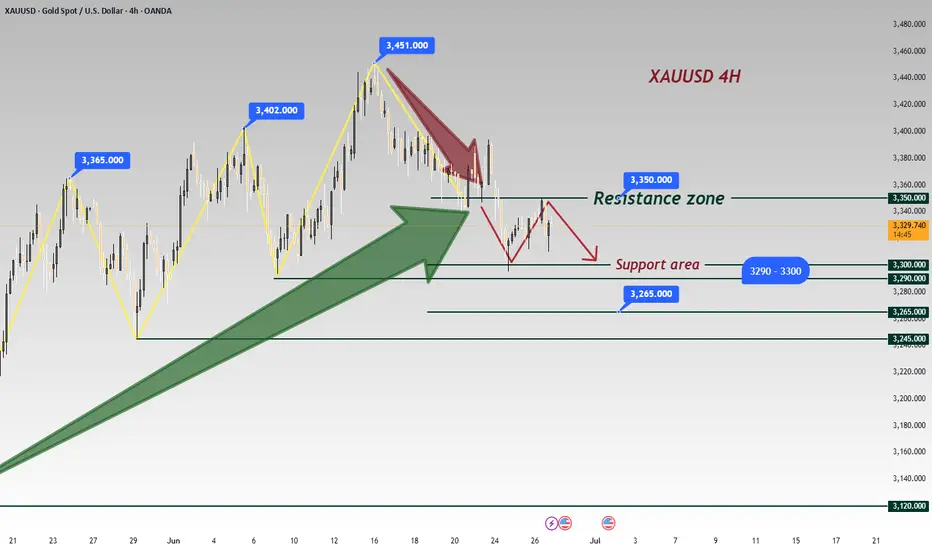
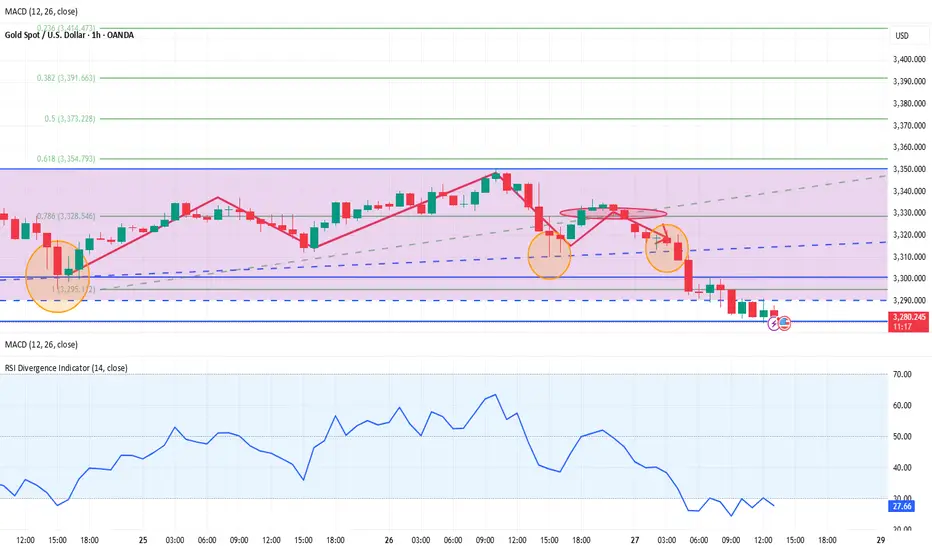
XAUUSD Technical Outlook – Rebound or Trap?1. Market Overview
After a sharp rejection near the 0.618 Fibonacci level, XAUUSD has pulled back and is now trading around 3,323 USD. Although price has stabilized somewhat, technical indicators suggest this is likely a corrective move within a prevailing downtrend.
2. Technical Analysis
Price Action
XAUUSD is currently hovering near 3,323 USD after a failed attempt to break above the resistance zone at 3,373–3,392 USD — an area marked by:
The 0.618 Fibonacci retracement from the recent downtrend
Repeated historical rejections.
The upper boundary of a sideways consolidation range from early June.
Recent candlesticks show indecision and rejection from higher levels, suggesting sellers are still in control.
Support Zone Behavior
The price recently bounced from the 3,294–3,317 USD range, where strong historical support and the 0.382 Fibonacci level align.
This zone continues to hold, but if broken, could open the door to deeper declines toward the 3,250 or even 3,224 USD levels.
RSI Indicator
RSI remains flat around the neutral zone, indicating a lack of bullish momentum.
No significant divergence or breakout signals are currently visible on the daily RSI chart.
3. Key Technical Levels
Resistance:
3,373 – 3,392 USD: Confluence resistance zone (0.618 Fib + historical supply).
3,435 – 3,453 USD: Previous swing high – key medium-term benchmark
Support:
3,294 – 3,317 USD: Immediate support, holding for now.
3,250 – 3,224 USD: Potential next target zone if bearish pressure resumes.
4. Trade Setup Scenarios.
Scenario 1 – Buy if support holds and bullish confirmation appears
Entry: 3,295 – 3,305 USD.
Stop-loss: Below 3,289 USD.
Take-profit: 3,340 – 3,355 – 3,370 USD.
Condition: Look for bullish reversal patterns (e.g., Bullish Engulfing, Pin Bar) on H1–H4.
Scenario 2 – Sell on rejection from resistance zone
Entry: 3,370 – 3,375 USD.
Stop-loss: Above 3,392 USD.
Take-profit: 3,330 – 3,310 – 3,290 USD.
Condition: Clear bearish rejection candlestick with diminishing volume
Note:
XAUUSD remains in a vulnerable state. The current move may be a technical rebound rather than a true reversal. Traders should watch closely how price behaves around the 3,373–3,392 USD zone in the coming sessions. A breakout could signal a new bullish leg, while another rejection would likely confirm a continuation of the bearish trend.
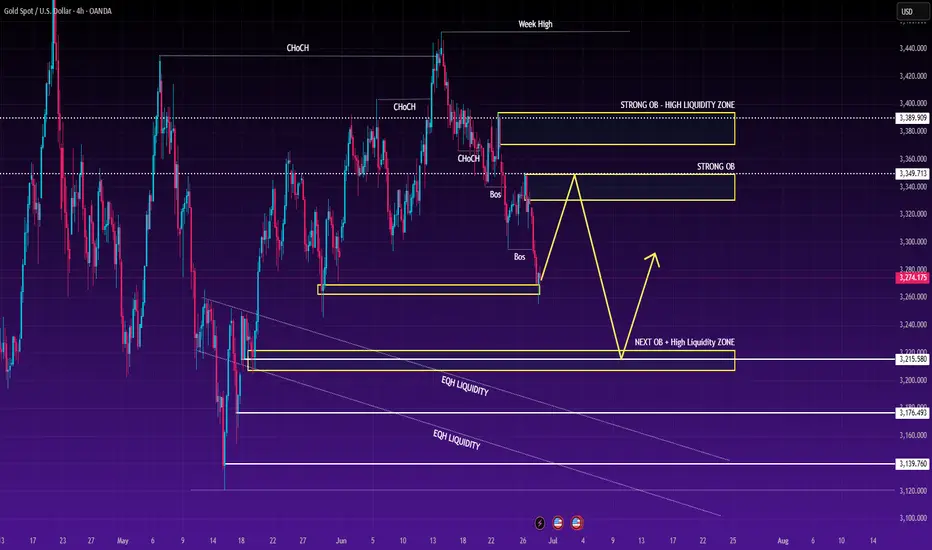
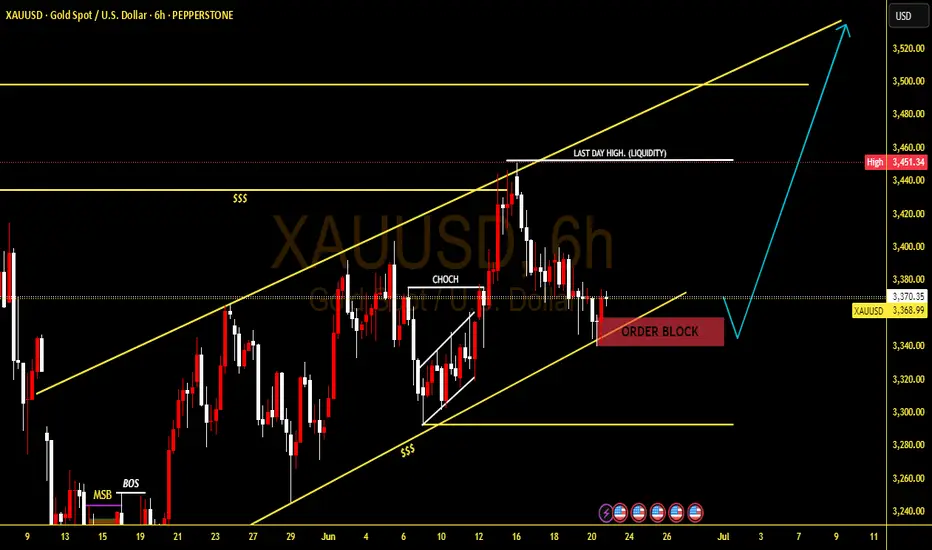
XAUUSD – Smart Money Flow & Weekly OutlookGold reacted precisely at the key OB zone near 3270. Following a clear Break of Structure (BOS) on the H4, Smart Money may be redistributing positions.
🔍 Main scenario:
Price is expected to retrace to the 3349–3360 OB zone, where strong sell-side reactions may occur.
If that fails, the next likely move is a drop toward the high-liquidity demand zone at 3215, where buyers could re-enter.
📰 Key macro drivers:
Final GDP and PCE data show slight economic cooling in the US, reinforcing expectations that the Fed will maintain higher-for-longer rates.
Trump’s recent comments stir political uncertainty, increasing safe-haven demand for gold.
🎯 Strategy:
Look for confirmed short setups near 3349–3360.
Consider longs at 3215 if strong bullish reaction forms.
Gold: Resistance Validated, Short at 3340-3350 Tomorrow📈 Gold Trading Recap & Tomorrow's Strategy: Resistance Holds, Short Opportunities Persist
💎 Today's newly updated live short strategy hit the TP target successfully! As mentioned earlier, when gold failed to break the support level, we anticipated it to range around 3330—today's trades were precisely centered on this logic. The 3350 resistance was also validated firmly during the session.
💎 Expect further upside in tomorrow's Asian session—recommend continuing short positions within the 3340-3350 range 🚀
🚀 Sell@3350 - 3345
🚀 TP 3335 - 3325 - 3315
Accurate signals are updated every day 📈 If you encounter any problems during trading, these signals can serve as your reliable guide 🧭 Feel free to refer to them! I sincerely hope they'll be of great help to you 🌟 👇
XAU/USD: Gold's Critical Decision Point! FOR JUNE 06, 2025 📊 CURRENT SNAPSHOT
---
🎯 THE SETUP: "Golden Triangle Breakout"
Gold is sitting at a CRITICAL JUNCTURE - trapped between major support and resistance levels, forming what I call the "Golden Pressure Cooker" pattern.
🔍 KEY LEVELS TO WATCH
🔴 RESISTANCE ZONE (The Ceiling)
* LWH (Last Week High): \$3,403.55 - Ultimate target
* LWL (Last Week Low): \$3,297.94 - Immediate resistance
* 4H FVG: \$3,350 area - Major supply zone
🟡 CURRENT BATTLEFIELD
* Price Action: Consolidating in tight range
* PWL (Previous Week Low): \$3,245.28 - Key pivot
🔴 DANGER ZONE (The Floor)
* DIE ZONE: \$3,121.70 - Critical support
* Break below = Major bearish signal
---
📈 MARKET STRUCTURE ANALYSIS
What the Chart is Telling Us:
1. 📊 Consolidation Phase: Gold has been ranging for several sessions
2. ⚡ 4H FVG Above: Acting as a magnet for price
3. 🎯 Triple Test: Price respecting the PWL level multiple times
4. 📉 Volume Decline: Typical before major moves
---
🚀 TRADING SCENARIOS
SCENARIO 1: "Golden Rocket" 🚀 (BULLISH)
IF price breaks above \$3,297.94 (LWL):
* Target 1: \$3,330- +1.2% gain
* Target 2: \$3,350(FVG) - +3.9% gain
* Stop Loss: \$3,280 - Risk: -0.5%
Risk/Reward: 1:1.8 ⭐⭐⭐
SCENARIO 2: "Golden Avalanche" 📉 (BEARISH)
IF price breaks below \$3,245.28 (PWL):
* Target 1: \$3,200 (Psychological level)
* Target 2: \$3,121.70 (Die Zone)
* Stop Loss: \$3,297.94 (LWL)
---
💡 SIMPLE TRADING PLAN
🎯 FOR BULLS (Buy Setup):
```
ENTRY: Break above $3,298 with volume
STOP: $3,285
TARGET 1: $3,330
TARGET 2: $3,360
🎯 FOR BEARS (Sell Setup):
```
ENTRY: Break below $3,245 with volume
STOP: $3,298 (LWL)
TARGET 1: $3,200
TARGET 2: $3,122 (Die Zone)
---
⚠️ RISK MANAGEMENT RULES
1. Position Size: Risk only 1-2% of account
2. Wait for Confirmation: Don't jump early
3. Volume is Key: Breakouts need volume
4. Time Limit: Close if no movement in 2 days
---
🔥 WHY THIS SETUP MATTERS
Gold is at a crossroads! The tight consolidation suggests big players are accumulating positions. When this range breaks, expect explosive movement in either direction.
Smart Money Clues:
* Multiple tests of PWL = Strong support
* 4H FVG above = Price magnet effect
* Low volume = Calm before the storm
---
📊 MARKET CONTEXT
* Dollar Weakness: Could fuel gold rally
* Economic Uncertainty: Safe haven demand
* Technical Setup: Clean breakout pattern
* Timeframe: Perfect for swing trades
---
🎯 MY VERDICT
Gold is COILED and ready to EXPLODE!
The setup favors the bullish scenario due to:
✅ Strong support holding at PWL
✅ 4H FVG acting as price magnet
✅ Multiple failed attempts to break lower
✅ Overall uptrend structure intact
But remember: Respect the levels and trade the breakout, not your bias!
---
🚨 ACTION ITEMS
1. Set Alerts: \$3,298 (bull trigger) & \$3,245 (bear trigger)
2. Watch Volume: Breakouts need confirmation
3. Be Patient: Wait for clean breaks
4. Have Both Plans: Ready for either direction
---
Trade Smart, Stay Safe! 🥇💰
The market rewards patience and punishes impatience.

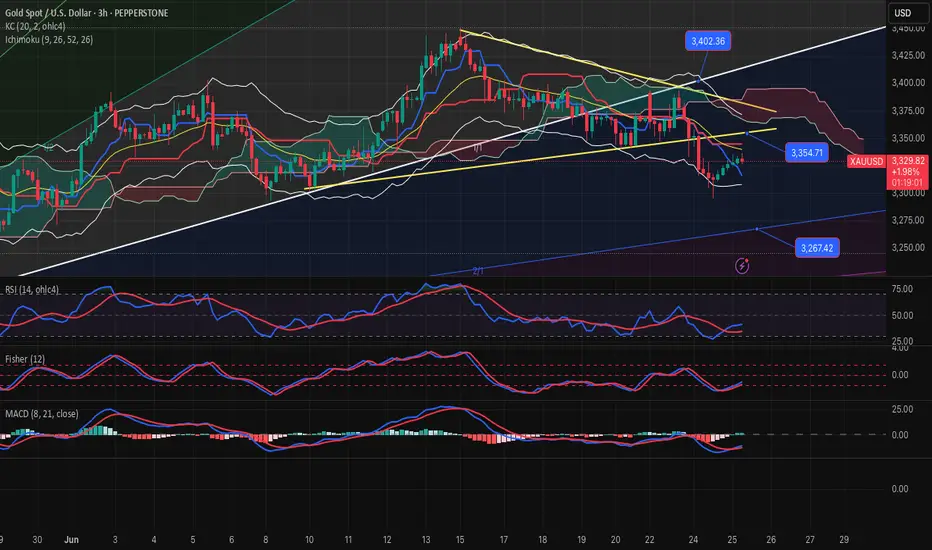
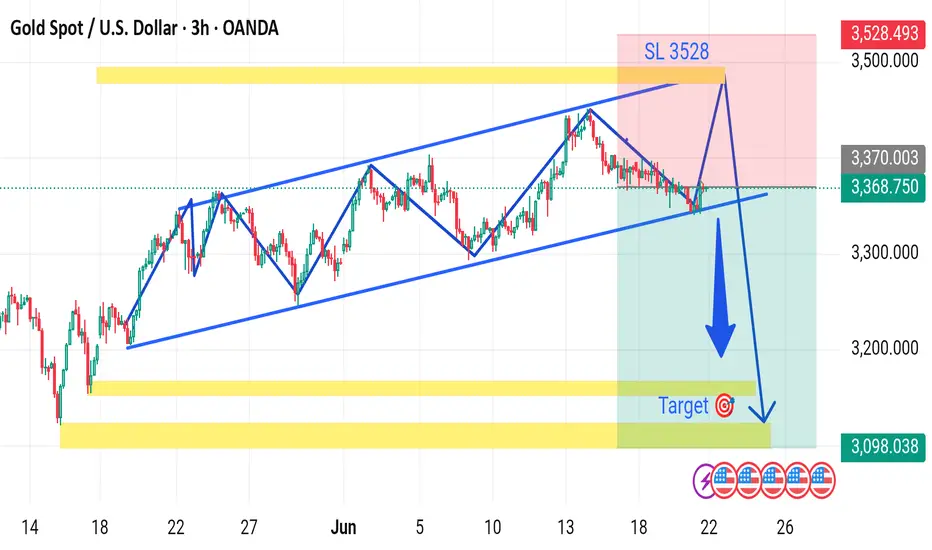
XAUUSD NEXT WEEK UPDATE The chart you provided is a technical analysis of Gold Spot (XAU/USD) on a 3-hour timeframe, showing a bearish setup with the following key features:
---
🔍 Chart Analysis Summary:
Price Channel:
The price has been moving within an ascending channel (marked by two blue lines) but is now testing the lower boundary of this channel.
Breakout Direction:
A bearish breakout is projected, indicated by the large blue downward arrow. This suggests a possible trend reversal from bullish to bearish.
Entry & Target:
Current Price: ~3368.75
Target Price: ~3098.03
This matches the previous demand/support zone (yellow horizontal band near the bottom).
Stop Loss (SL):
Placed at 3528, just above recent highs to manage risk.
Risk Zone:
The red area shows the risk if price moves against the trade (stop loss zone).
The green area shows the reward zone (target profit area), highlighting a favorable risk/reward ratio.
Event Indicators:
Several economic event icons are placed near the projected move date (~June 24–26), suggesting that fundamental catalysts may support this move (e.g., FOMC, CPI, etc.).
---
✅ Bearish Setup Summary:
Setup Type: Bearish channel breakout
Sell Entry: On break and close below channel support (~3368)
Stop Loss: 3528
Take Profit: 3098
R/R Ratio: Favorable
Would you like a written trade plan or a summary in table format?
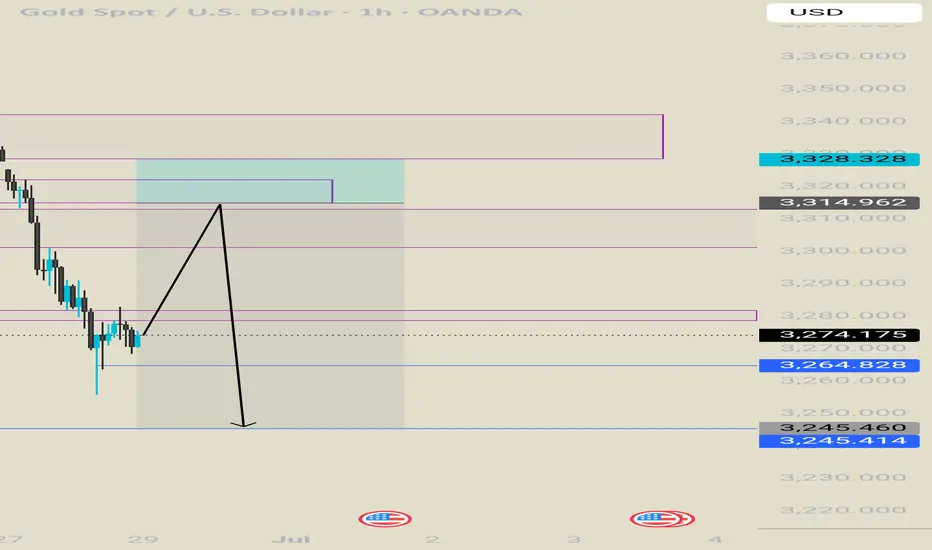
Gold short from 3314Gold projection for the next week.
First a long up until 3300 region then from there i will be lookibg for shorts.
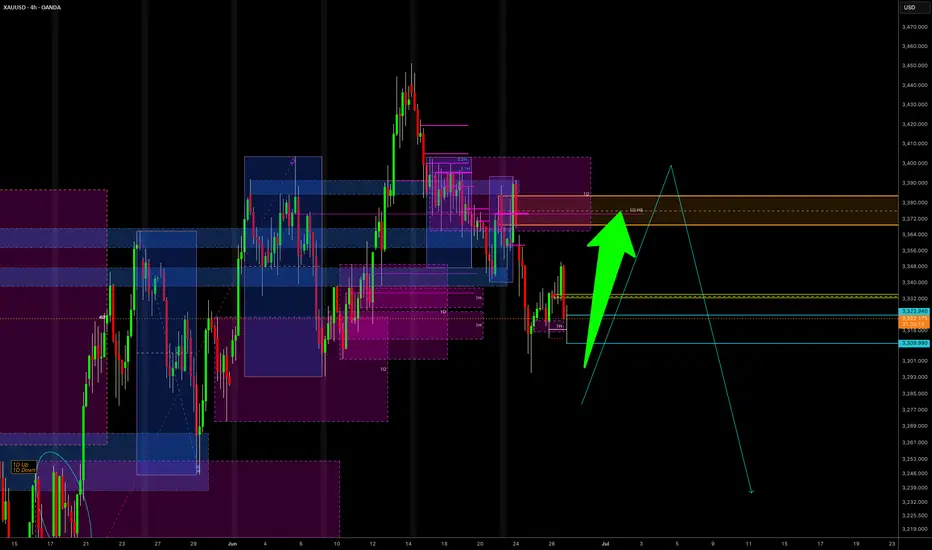
Ready, Steady...?Gold has consolidated the past few weeks and has now bounced from solid support.
The current wave 4 looks complete and should now be followed by a strong upward move in wave 5, wave 5's in the metals are the strongest...expect a move towards $4000 coming.
Your chance to get on board early and ride this bull run again!
Appreciate a thumbs up, good trading and God Bless you all!

Gold Buy- Go for buy if setup given
- just a small trade
- Refine entry with smaller SL for better RR, if your strategy allow
A Message To Traders:
I’ll be sharing high-quality trade setups for a period time. No bullshit, no fluff, no complicated nonsense — just real, actionable forecast the algorithm is executing. If you’re struggling with trading and desperate for better results, follow my posts closely.
Check out my previously posted setups and forecasts — you’ll be amazed by the high accuracy of the results.
"I Found the Code. I Trust the Algo. Believe Me, That’s It."
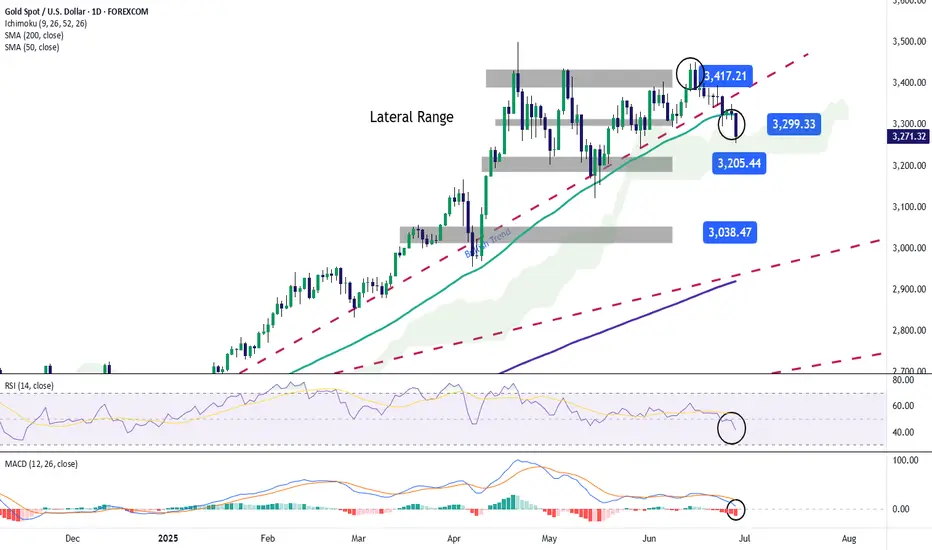
Gold Continues to Fall Below $3,300As the week comes to a close, gold is on track for a decline of more than 1.5% during the latest trading session. So far, the bearish bias remains firmly in place in the movements of the precious metal, as demand for safe-haven assets continues to fade, mainly due to the ceasefire agreement in the Middle East conflict, which has helped restore market confidence. Since gold is a classic safe-haven asset, demand has steadily weakened in recent sessions, and as long as this situation holds, selling pressure on gold may continue to intensify.
Uptrend Breaks:
Recent selling activity has played a crucial role, as it has led to a bearish breakout below the short-term trendline, which had been consistently holding on the chart. This breakdown has now opened the door for a lateral channel to form, suggesting that market sentiment has entered a more neutral zone in the short term. If bearish pressure continues, it could pave the way for a more dominant downtrend to take shape in the sessions ahead.
Indicators:
RSI: The RSI line has started oscillating steadily below the 50 level, signaling that downward momentum is beginning to dominate. If the line continues to move away from the neutral 50 level, we could expect more consistent bearish pressure on the chart.
MACD: A similar setup is emerging on the MACD. The indicator's histogram has dropped below the neutral line at zero and is showing persistent negative readings. This signals that selling momentum remains dominant, based on the average strength of the moving averages. If this continues, it would confirm a clear bearish bias.
Key Levels to Watch:
$3,300 – Current barrier: This level aligns with the midpoint of the short-term lateral channel. Price action around this area could reinforce the neutral outlook in the near term.
$3,400 – Key resistance zone: This level marks the historical highs of the gold market. A return to this level would revive the recently abandoned bullish trend and could reestablish a more optimistic outlook.
$3,200 – Critical support: This marks the lower boundary of the short-term channel. A breakdown below this level could trigger a fresh selling trend in the coming sessions.
Written by Julian Pineda, CFA – Market Analyst
GOLD 1. Final GDP q/q
Actual: -0.5%
Forecast: -0.2%
Previous: -0.2%
The US economy contracted by 0.5% in the first quarter, worse than the expected 0.2% decline, indicating a sharper slowdown than anticipated.
2. Unemployment Claims (Week ending June 21)
Initial Claims: 236,000
Forecast: 244,000
Previous: 245,000
Initial jobless claims fell by 10,000 to 236,000, lower than forecast and near historically low levels, suggesting that layoffs remain relatively subdued despite economic challenges.
Context:
Despite the drop in new claims, continuing claims (people receiving ongoing benefits) rose to about 1.97 million, the highest since November 2021, indicating some softening in the labor market. Economists expect the unemployment rate to edge up slightly to around 4.3% in June from 4.2% in May.
3. Core Durable Goods Orders m/m (May 2025)
Actual: +0.5%
Forecast: +0.1%
Previous: +0.2%
Core durable goods orders, which exclude transportation, rose 0.5% month-over-month, beating expectations and signaling some resilience in business investment.
4. Durable Goods Orders m/m (May 2025)
Actual: +16.4%
Forecast: +8.6%
Previous: -6.3%
Total durable goods orders surged 16.4%, a strong rebound following a prior decline, indicating a pickup in demand for long-lasting manufactured goods.
5. Final GDP Price Index q/q (Q1 2025)
Actual: 3.7%
This measure of inflation in the GDP deflator remains elevated, reflecting persistent price pressures in the economy.
Summary of Market Implications:
The larger-than-expected GDP contraction signals economic weakness, which could increase expectations for accommodative Fed policy.
The drop in initial jobless claims supports the view that layoffs are limited, but rising continuing claims suggest some labor market softness ahead.
Strong durable goods orders point to underlying business investment strength, providing a mixed but cautiously optimistic outlook.
Elevated inflation as shown by the GDP price index keeps inflation concerns alive.
Overall, the data presents a complex picture of a slowing economy with pockets of resilience and ongoing inflationary pressure.
#GOLD

Daily live trade with XAUUSD in 15m/30m/1h 20250625Daily live trade with XAUUSD in 15m/30m/1h 20250625
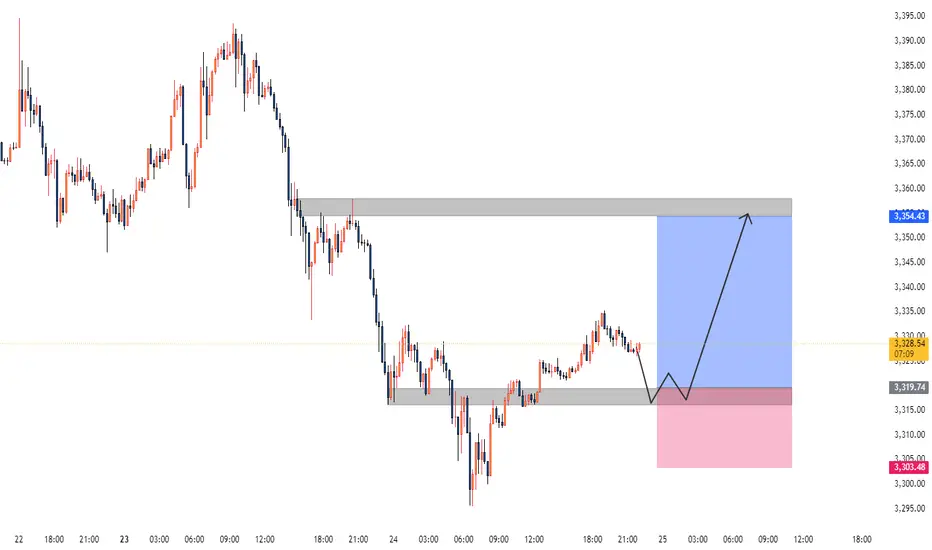
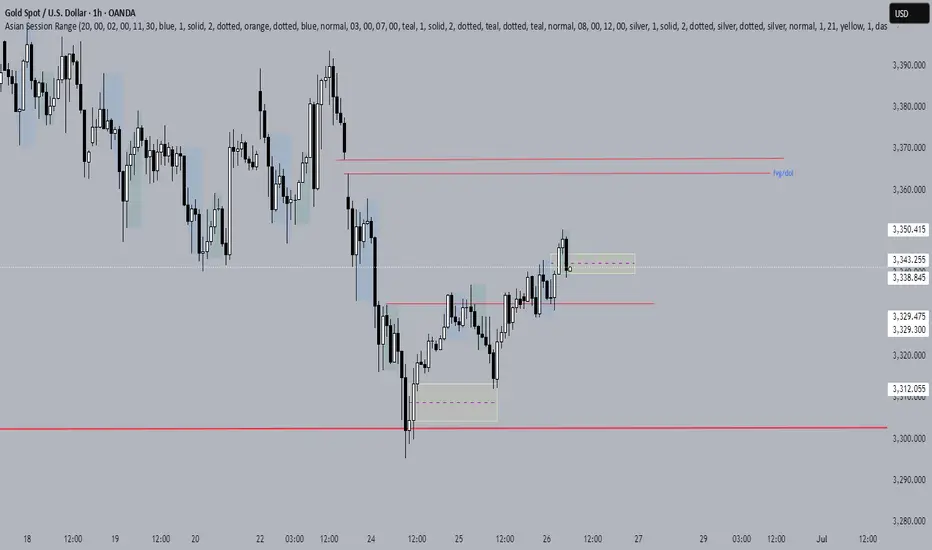
Gold XAUUSD Analysis 25.06.2025The Gold shows with a recent upward trend following a period of consolidation and a dip. Key observations:
The price previously fluctuated between a support level around 3,310-3,319 and a resistance near 3,354.
The current price is consolidating near the recent high, suggesting potential for further upward movement or a pullback.
Signal:
Buy signal is present in the range of 3,316-3,319, aligning with the support level, offering a good entry point for a potential upward move.
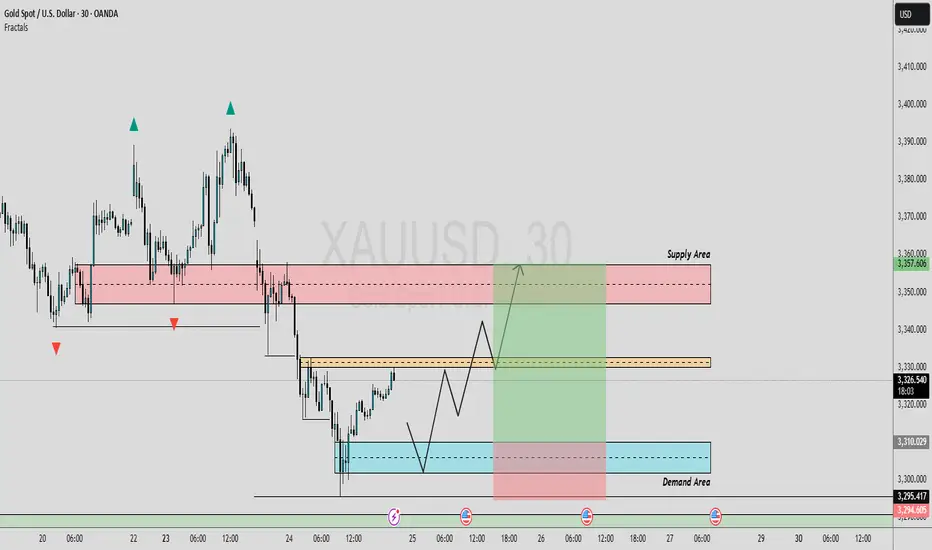
GOLD 30M ANALYSIS (LONG)In this analysis we're focusing on 30Min time frame. If we look in this 30Min chart, we have supply area and demand area. And we have also a minor resistance level. Now what I'm looking for that price move impulsively upside after sweeping all SSL. I'm expecting that price will come back and retest (3310 - 3305) area at least. So keep an eye on these level, confirmation is key.
Second Condition:
If price break above 3332 and close above 3332 with strong momentum than we will plan a buy trade on retracement.
Always use stoploss for your trade.
Always use proper money management and proper risk to reward ratio.
#XAUUSD 30M Technical Analysis Expected Move.
gold bearish trading ideagold bearish trading idea gold breakdown traingle now gold next move [possible to sell target 3170

Gold Turns Bullish After Clearing Daily Sell-Side LiquidityThe purge of this liquidity indicates that institutional players may have engineered a move to grab orders before initiating a new upward leg. Following this move, price action shows signs of strong bullish intent, such as bullish engulfing candles, increased volume on up moves, or a break above short-term resistance.
This liquidity sweep not only invalidates bearish pressure but also creates a clean bullish imbalance, offering a potential entry zone for buyers. Traders should now watch for:
A break and retest of the key structure above the liquidity sweep.
Bullish order blocks forming on lower timeframes (e.g., H1 or H4).
Confluences like Fibonacci retracement levels, trendline support, or moving average bounces.
As long as price holds above the level of the purge and continues forming higher lows, gold is likely to trend upward in the near term. Potential targets include recent highs or fair value gaps left behind during the bearish move.
This setup favors buying pullbacks rather than chasing price, with invalidation below the recent sweep level.
Waiting for data release to rebound and short📰 Impact of news:
1. PCE and Consumer Index
📈 Market analysis:
The current price of 3280 has a higher profit and loss ratio advantage. Technical indicators show that the hourly chart is severely oversold. Combined with the top and bottom conversion of 3300 above, there is a 20-point rebound space in the short term. If the PCE data is in line with the trend, gold prices are expected to quickly regain the 3,300 mark. Note that negative data beyond expectations may cause a brief decline.
🏅 Trading strategies:
BUY 3295-3280-3275
TP 3298-3300-3310
SELL 3300-3310
TP 3290-3280-3260-3250
If you agree with this view, or have a better idea, please leave a message in the comment area. I look forward to hearing different voices.
TVC:GOLD FXOPEN:XAUUSD FOREXCOM:XAUUSD FX:XAUUSD OANDA:XAUUSD
Gold Distribution I missed the perfect entry for this distribution model, but since the technical target hasn't been reached yet, I'll look for valid entries if they arise. The time displacement is good, it swept internal liquidity and left more to the downside. It looks more like a trend than a range deviation, so I'll be cautious with this trade if I take it.

"Gold’s War Cry: XAUUSD Eyes $3700 Amid Middle East Turmoil"PEPPERSTONE:XAUUSD
Gold is once again stepping into the spotlight as global markets reel from escalating geopolitical tensions. With President Trump confirming a full-scale U.S. airstrike on Iran’s nuclear facilities—Fordow, Natanz, and Esfahan—the world is bracing for potential retaliation and broader instability.
In times like these, gold doesn’t just shine—it roars.
📈 My Bias: Strongly Bullish
🎯 Targets:
- Primary: $3500
- Extended: $3700
These levels are not just technical aspirations—they’re grounded in the reality of rising global risk aversion, central bank accumulation, and a potential flight to safety as the Middle East teeters on the edge of wider conflict.
🔍 Key Technical Zone:
- $3341–$3352: This is my immediate area of interest. I expect a pullback into this zone on market open, which could offer a high-probability long setup.
- Break Below? If price slices through this zone, I’ll be watching the $3330–$3320 demand area for signs of absorption and reversal.
🧠 Macro Context:
- The U.S. strike marks a historic escalation, with Trump declaring the nuclear sites “completely and totally obliterated”.
- Iran’s expected retaliation could further destabilize the region, fueling safe haven flows into gold.
- Central banks remain net buyers of gold, and with inflation still lurking, real yields remain a key driver.
📊 Confluence Factors:
- Rising volume on bullish candles
- RSI holding above 50 on higher timeframes
- DXY showing signs of topping out
- VIX creeping higher—risk-off sentiment brewing
📌 Final Thoughts:
Gold is no longer just a hedge—it’s becoming a statement. In a world where headlines move markets, XAUUSD is poised to benefit from both fear and fundamentals. I’ll be watching price action closely at the open, ready to strike if the setup aligns.
Gold prices are consolidating at a low level!International spot gold continued to fluctuate and fall. Looking back at the market performance on Thursday, gold prices maintained a narrow range of consolidation. Investors focused on the upcoming US inflation data to judge the direction of interest rate policy, while paying close attention to signs of easing geopolitical tensions in the Middle East. The current gold market is facing the influence of multiple factors: in the short term, PCE inflation data will become a key variable in determining the trend of gold prices. If the data is lower than expected, the market will strengthen the Fed's expectations of rate cuts, thereby supporting the upward trend of gold prices; on the contrary, if the inflation data exceeds expectations, it may delay the Fed's pace of rate cuts, resulting in pressure on gold prices. From a medium- and long-term perspective, the low interest rate environment, continued geopolitical risks and the potential weakening trend of the US dollar jointly provide structural support for gold prices. In addition, it is necessary to focus on the capital diversion effect that may be caused by the rising heat of the platinum and palladium markets. It is recommended to closely track the changes in capital flows in the precious metals sector.
From the analysis of the gold 4-hour level chart, today's gold price showed a downward trend at the opening, and the lowest fell to around US$3289.25 and then temporarily stabilized at US$3298. Technical indicators show that the 4-hour moving average system shows a dead cross arrangement, the MACD indicator dead cross continues, the gold price has fallen below the lower track support of the Bollinger Band, and the Bollinger Channel shows a narrowing trend, and the short-term price is in a low-level weak consolidation pattern. In view of the fact that the weekly line is about to close this week and the volatility of the end-of-month market is intensifying, it is necessary to focus on preventing the risk of a second bottoming out of the price. Comprehensively judged, the current gold trend is bearish, and the operation strategy is recommended to focus on rebound shorting.
Operation strategy:
1. It is recommended to short gold in the rebound area of 3311-3316, with a stop loss at 3324 and a target of 3300-3290

Strong weekend selling pressure, below 3300⭐️GOLDEN INFORMATION:
Gold prices (XAU/USD) came under renewed selling pressure during the Asian session on Friday, retreating below the $3,300 level after a lackluster performance the previous day. The precious metal is edging closer to the two-week low seen on Tuesday, as investors await the release of the US Personal Consumption Expenditures (PCE) Price Index. This key inflation gauge is expected to offer fresh insight into the Federal Reserve’s policy outlook and could significantly influence US Dollar (USD) movements—ultimately shaping the near-term trajectory of the non-yielding yellow metal.
⭐️Personal comments NOVA:
Selling pressure at the end of the week caused gold prices to fall below 3300, maintaining selling pressure and falling today
⭐️SET UP GOLD PRICE:
🔥SELL GOLD zone: 3326- 3328 SL 3333
TP1: $3315
TP2: $3302
TP3: $3290
🔥BUY GOLD zone: $3248-$3250 SL $3243
TP1: $3260
TP2: $3270
TP3: $3280
⭐️Technical analysis:
Based on technical indicators EMA 34, EMA89 and support resistance areas to set up a reasonable SELL order.
⭐️NOTE:
Note: Nova wishes traders to manage their capital well
- take the number of lots that match your capital
- Takeprofit equal to 4-6% of capital account
- Stoplose equal to 2-3% of capital account
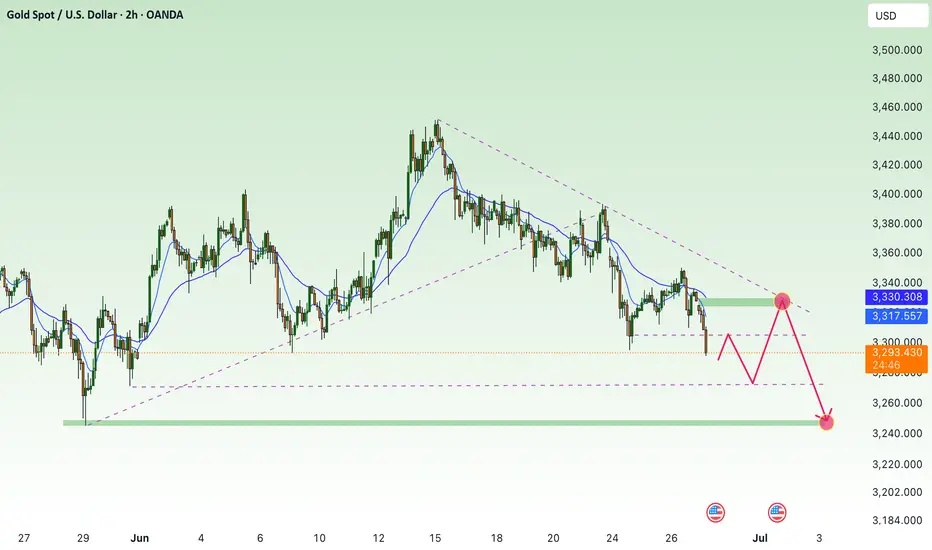
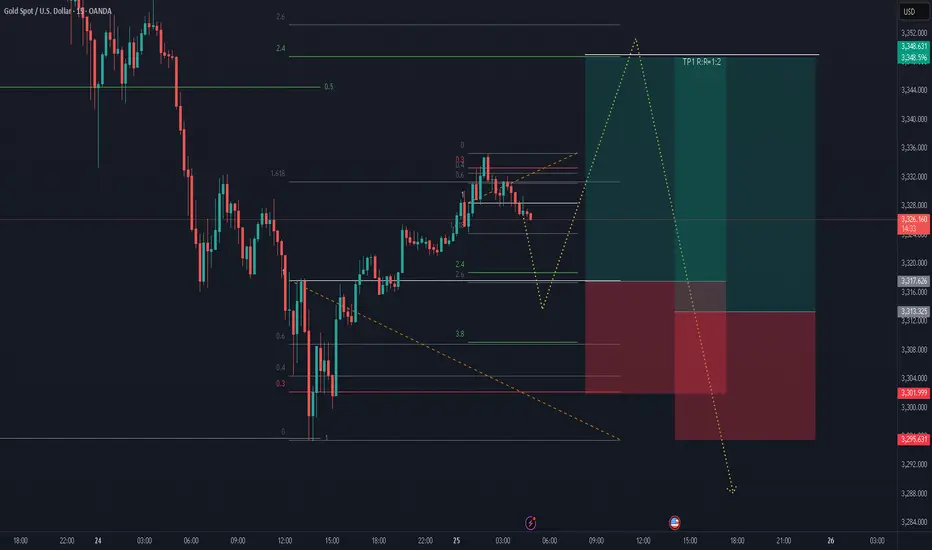
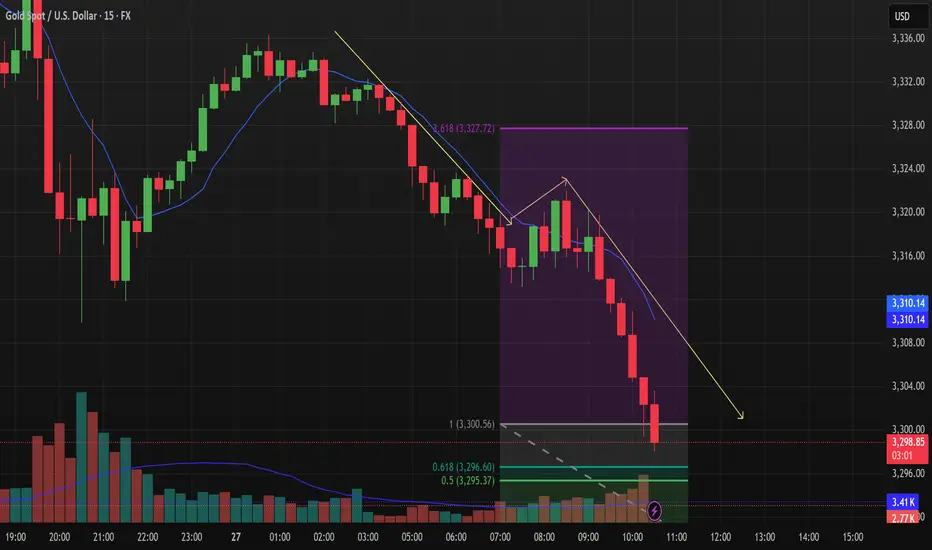
XAUUSD: Bearish Trend, Key Support at $3,295Market Overview
In today’s trading session (26/06/2025), XAUUSD shows continued downward momentum. Gold prices are currently hovering around $3,302.05, with a slight drop of 0.01%. The intraday price range has been tight, between $3,330.00 and $3,350.00, indicating a battle between the buyers and sellers around the short-term equilibrium zone.
Recent price action suggests that after a brief recovery, gold is once again encountering resistance at the $3,350.00 level. In the coming hours, a decisive breakout either above this resistance or below current support will dictate the market’s next move.
Key Technical Levels to Watch:
Support Levels: The first significant support is at the $3,295.37 level (50% Fibonacci retracement), with the next support at $3,296.60 (61.8% Fibonacci retracement), followed by a crucial level at $3,300.56.
Resistance Levels: The primary resistance area lies around $3,350.00, with the second resistance at $3,327.72, which coincides with the 3.618 extension of the previous price swing.
Price Action Analysis
As seen in the chart, XAUUSD is currently trading below both the 50-period (blue) and 200-period (yellow) moving averages, indicating a strong bearish trend. The price action is forming a series of lower lows and lower highs, reinforcing the downtrend.
Bearish Trend Continuation: A break below the support at $3,295.37 could signal further downside towards $3,290.00 or even $3,275.00. The yellow trendline indicates the overall bearish direction, and any failure to hold above $3,300.00 could trigger additional selling pressure.
Fibonacci Retracement Levels: Price is testing the 50% and 61.8% Fibonacci levels. A rejection at these levels could cause a pullback towards lower support zones, confirming the bearish outlook for the short term.
Volume Analysis
The volume chart shows relatively low volatility, with decreasing volume during the price pullbacks. This suggests that there is not enough buying interest to push the price higher, and the market may be more inclined towards bearish continuation in the near term.
Market Sentiment
Currently, the market is undecided. The recent price action suggests that traders are waiting for a confirmation of direction. The next few hours are critical in determining if the downtrend will continue or if we will see a short-term bounce at one of the key support levels.
Trading Strategy
Short Position: A break below $3,295.37 would be an excellent opportunity to short XAUUSD with a target at $3,290.00, and further down to $3,275.00.
Long Position: Only consider long positions if XAUUSD manages to break above $3,350.00 decisively, with the next target near $3,375.00.
Conclusion
XAUUSD remains under pressure, and unless there’s a strong reversal at support levels, the bearish momentum could continue in the short term. Traders should monitor the key levels mentioned above closely to adjust positions accordingly.
GOLD-SELL strategy 3 hourly chart GANNGOLD is still under selling pressure, indicators 9slightly) but below cloud is crucial and feels we may see $ 2,267 test in the near future.
we are perhaps tiny oversold, and for that reason strategy is:
SELL @ $ 3,350-3,375 and take profit near $ 3,275 for now.