XAUUSDK trade ideas
Dramatic change coming?In response to prospects of a de-escalation in the Middle East tensions, XAU/USD fell and has continued to decline throughout the day.
Despite the apparent breakthrough, Israeli Defense Minister Israel Katz ordered retaliatory strikes after claiming Iran violated the agreement hours after both nations agreed to the ceasefire, allegations that Tehran denies.
US President Donald Trump announced the initial ceasefire between Israel and Iran on Monday evening during an address at Capitol Hill, stating that “Stability in the Middle East is essential for global peace.”
The announcement followed Iranian missile strikes on US bases in Qatar, which were intercepted without casualties.
The ceasefire has pressured Gold and Crude Oil prices as traders unwind risk hedges tied to potential disruptions in the Strait of Hormuz, a critical chokepoint for roughly 20% of global Oil supply.
The reduced threat of supply disruption would help lower inflation expectations, a key theme for the Fed, which is facing pressure from Trump to cut interest rates.
However, investors expect the Gold price to get supported by a dramatic change in the Federal Reserve’s (Fed) stance on the monetary policy outlook. Fed Vice Chair Michelle Bowman stated in a gathering in Prague on Monday that monetary policy adjustments are becoming appropriate amid growing job market risks and expectations that the tariff policy announced by Donald Trump will have limited impact on inflation.
Tomorrow,Federal Reserve Chairman Jerome Powell testifies about the semiannual Monetary Policy Report before the US Senate Committee on Banking, Housing, and Urban Affairs.
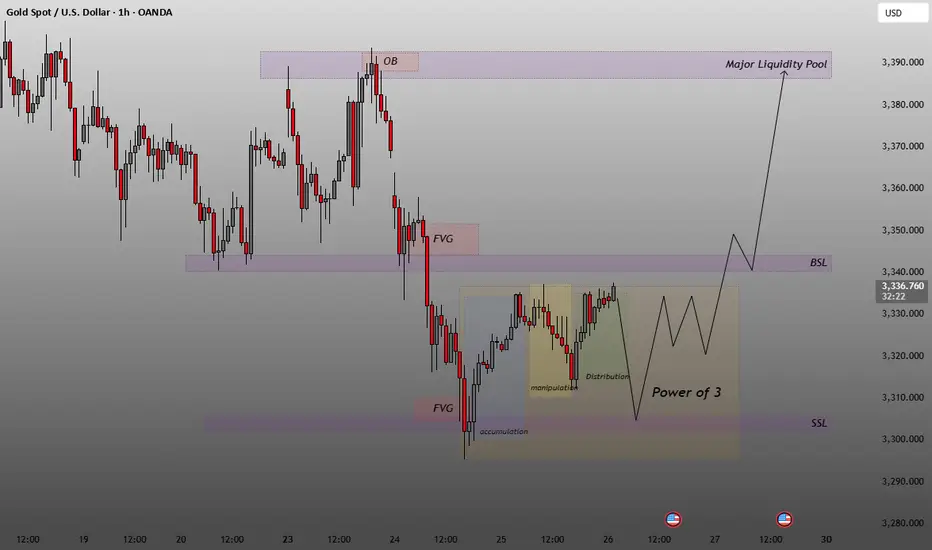
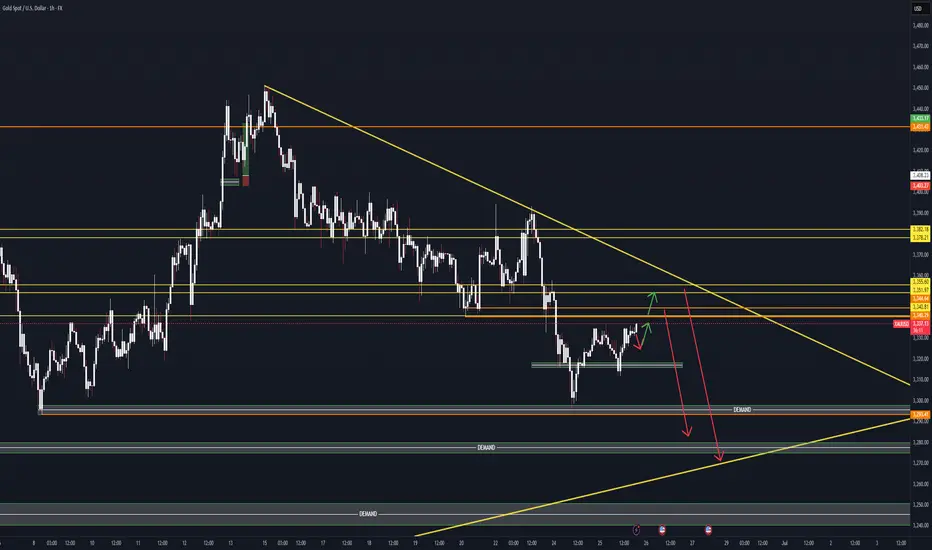
XAUUSD 1H–Power of 3, Liquidity Grab, FVG Fill & Bullish TargetThis is a classic Smart Money Concept (ICT) setup XAUUSD 1H – Power of 3, Liquidity Grab, FVG Fill & Bullish Targeting OB + Major Pool.
Accumulation at the bottom
Liquidity grab below SSL (Sell-Side Liquidity)
Expecting bullish expansion toward:
FVG fills
Break of BSL (Buy-Side Liquidity)
Tap or break of OB (Order Block)
Final target: Major Liquidity Pool ~3380–3390
🧠
Trade Plan:
Entry: After SSL sweep + bullish confirmation (FVG or MSB)
TP1: FVG fill
TP2: BSL break
TP3: OB or final pool zone
SL: Below manipulation wick.
XAU/USD: Range Trading Awaiting BreakoutCore Logic:
1.Macro Drivers: Powell's dovish remarks continue to reverberate, with U.S. Treasury yields declining, the U.S. Dollar Index breaking below 97, and the debt ceiling extended to July 24—safe-haven demand props up gold prices.
2.Technical Outlook:
Currently trading in a $3,300–$3,350 range, with shrinking volume reflecting market caution.
Trend Projection:
- Likely to remain range-bound between $3,300–$3,350; a breakout will depend on progress in previously mentioned catalysts.
- If data misses expectations or geopolitical risks (e.g., Iran tensions) escalate, gold may rally to $3,360; otherwise, it could test $3,300 support.
Trading Strategies:
- Long positions: Enter lightly at $3,300–$3,310, stop-loss at $3,290, target $3,340.
- Short positions: Sell on rejection above $3,345, stop-loss at $3,360, target $3,320.
- Risk management: Cap single-trade exposure ≤3% to mitigate data-driven volatility.
I am committed to sharing trading signals every day. Among them, real-time signals will be flexibly pushed according to market dynamics. All the signals sent out last week accurately matched the market trends, helping numerous traders achieve substantial profits. Regardless of your previous investment performance, I believe that with the support of my professional strategies and timely signals, I will surely be able to assist you in breaking through investment bottlenecks and achieving new breakthroughs in the trading field.

Start going long on goldAlthough gold is under pressure and weak at present, gold still rebounded near 3295 under the influence of yesterday's major negative news, proving that there is still a large amount of buying funds below, limiting the retracement space of gold; and from 3295 to 3335, there is still a rebound space of $40, proving that gold is not extremely weak. Moreover, there is a gap left above, and there is a technical need to rebound to fill the gap;
In addition, yesterday gold fell sharply due to news, and there should be many longs trapped in the market. If gold is relatively stable, there may be self-rescue behavior of the trapped longs, so gold longs still have the opportunity to rebound to 3340-3350. At present, the main focus is on the short-term support area of 3315-3305, and we can moderately consider going long on gold in this area.
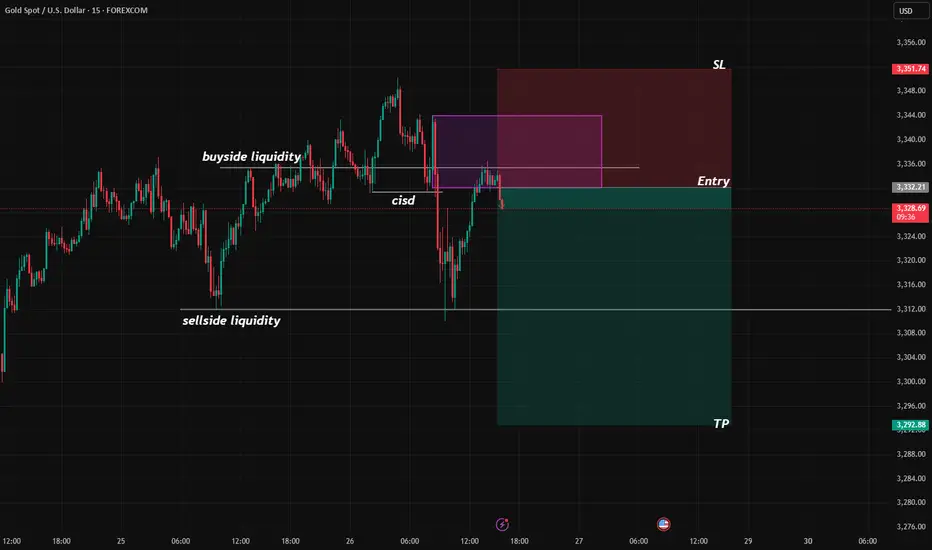
GOLD SETUPGold setup as it switches price delivery from a bullish program to a bearish program with a good trade entry on the touch of the order block.
XAUUSD - Breakdown: Israel-Iran Conflict - RISK OFF Part III missed to Publish my Idea here, I frequently share charts on my X handle for those who would like to follow, @JOHNDOUGHFX
OK let get into it.. I will publish my entire Idea as I did from the start of the sells, it has been quiet accurate but with terrible choppy PA.
FOMC likely a no move event. Rates to stay high due to tariff risks, Gold has been sentiment driven from last week-so Risk ON/OFF dominates.
Israel-Iran talks ongoing → expect noise + fake escalations before a “Deal"
Gold Order Flow zones at 3409 / 3450
Israel–Iran conflict = main wildcard.
Expect sudden headline moves: escalation threats → quick spikes.
But watch for fake outs followed by a “deal” headlines.
That’s your Risk ON trigger.
Buy the rumor, sell the news.
Key levels for OANDA:XAUUSD :
⚠️ Liquidity trap zone: 3409–3415
⚠️ Double top watch: 3448–3450 (psy level)
Below 3400, we could fade toward:
🔻 3350
🔻 3330
🔻 3322
Plan both sides, don’t chase breakouts.
For today's Analysis, Yesterday we have closed a bullish Doji Candle, signaling buyers, even though we broke below today, there was no selling pressure breaking the previous Daily low, and it has reacted close to As we have tapped the 39 Area, and pulled back, 43-45 if defended, will see price push higher into the high 65-70-75 extended Price Points before we can look for sells again.
As Iran - US tensions are now extended for 2 weeks, I believe the typical news escalations will keep price action on the edge, at present the market is sentiment driven with Risk OFF, so plan your trades accordingly. Risk ON can come with any optimistic news, especially a "DEAL"
Cheers and have a good last trading day!!
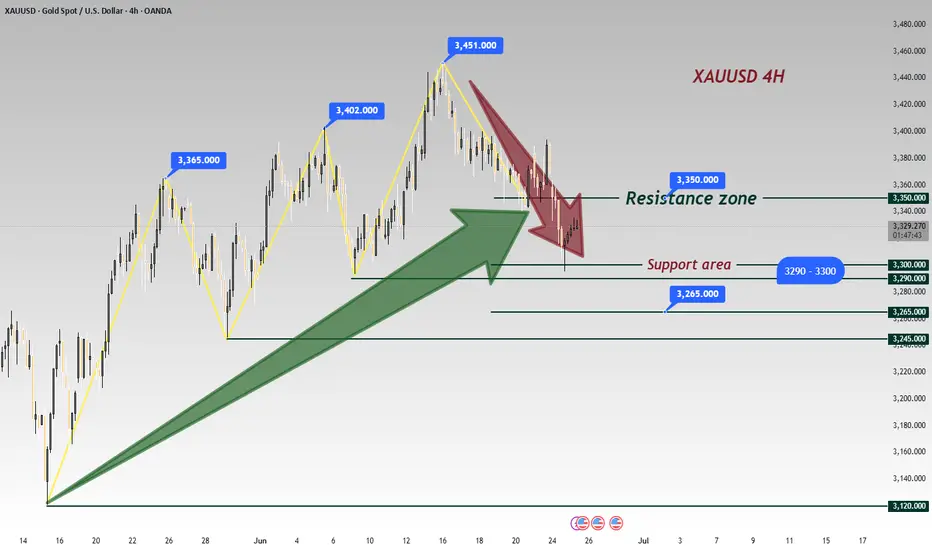
XAUUSD - Breakdown: - RISK OFF - Gold BearsGOLD has reached my previous analysis target ✅
Now seeing a pullback wave before potential continuation to the downside, keep in mind it is End of Month.
🎯 Pullback Zones:
1️⃣ 3340
2️⃣ Extended: 3350–3356
📉 If no new bullish fundamentals:
Next targets: 3293–3280
#XAUUSD #Gold #TechnicalAnalysis #Forex #Commodities #TradingLevels #MarketOutlook
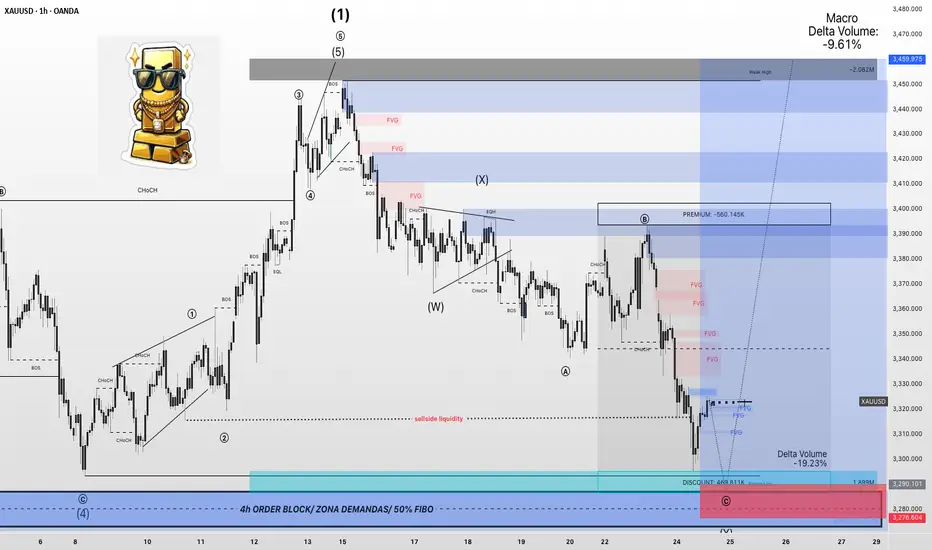
Gold Short: Wave 5 of C In this video, I explained my change in the Gold Elliott Wave counts on the cycle level (red font numbering) and how I think the Gold price movement will go down in a double combination (because the previous 2 waves are double combinations).
I also go through how I set the short target using Fibonacci extensions.

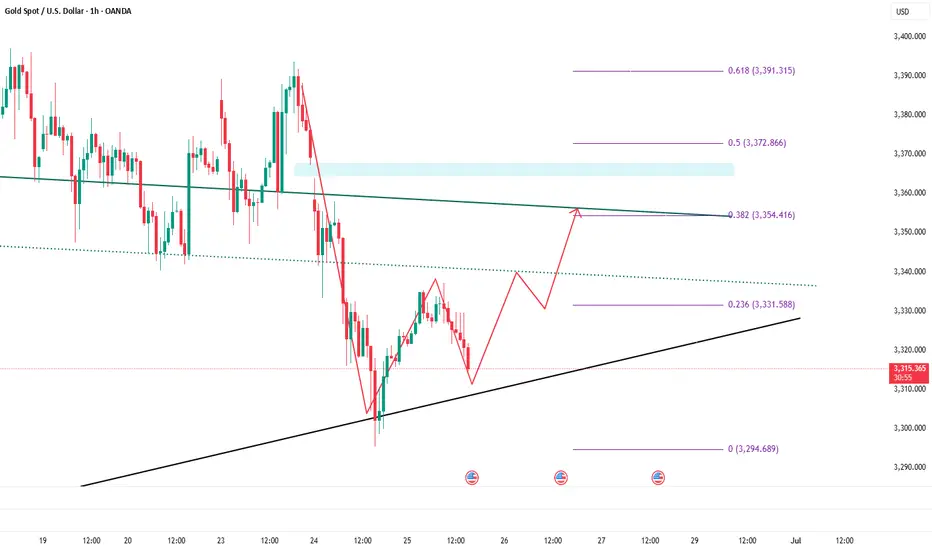
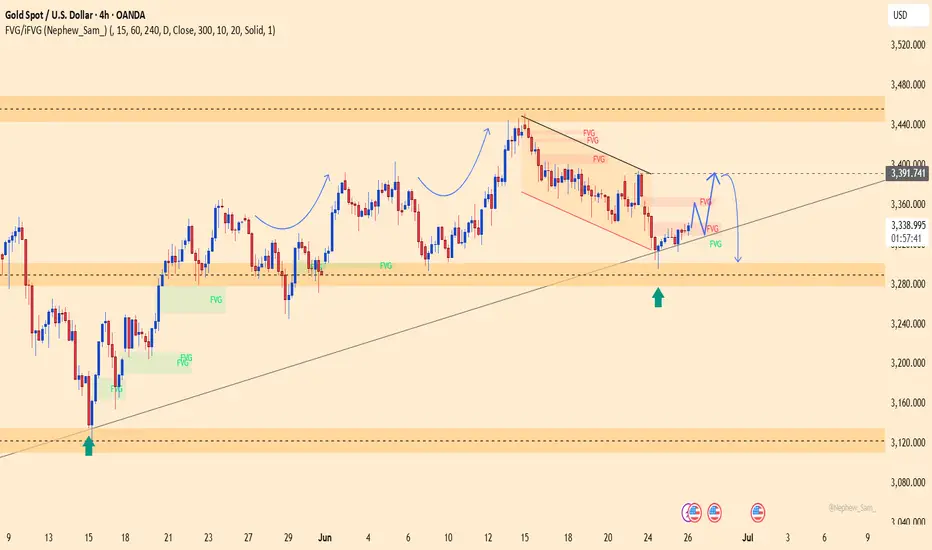
Is Gold Setting a Trap for Traders?Gold is currently retesting the FVG zone around 3,392 after breaking below a key trendline — a classic sell-trigger area if price gets rejected.
Bearish momentum is supported by:
U.S. jobless claims: 244K < 245K forecast → Stronger USD
Iran–Israel ceasefire → Reduced demand for safe-haven assets
If price fails to break above 3,392, the next downside target is the 3,299 support zone.
Trade idea: Watch for a rejection around 3,390–3,392 to consider short positions.
Bearish bias remains valid as long as price stays below 3,392.
#XAUUSD #GOLD 30Min 📉📈 #XAUUSD 30m Analysis – Dual Setup Scenario
We’re monitoring two potential trade setups depending on how price reacts at key levels:
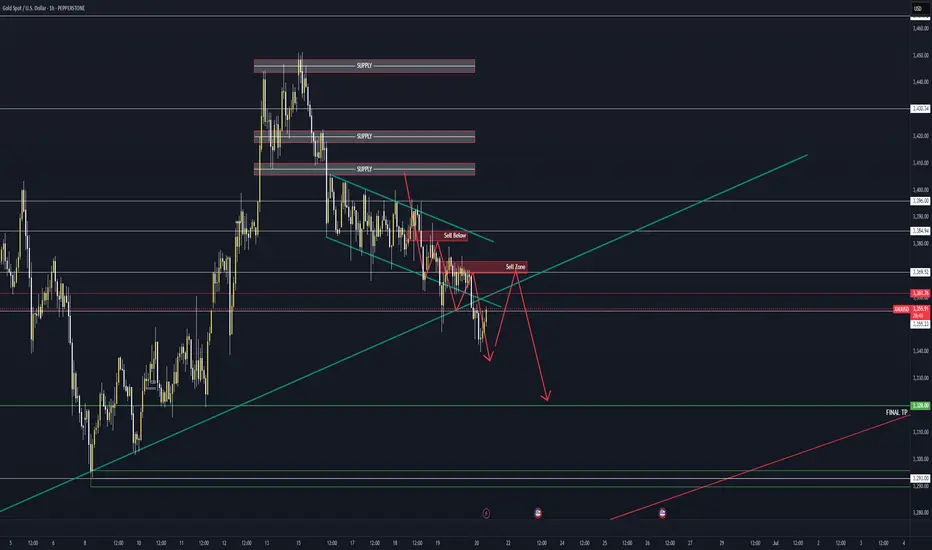
🔴 Sell Setup:
Price is entering a Sell-Side Order Block Zone between 3350–3360, aligned with a Fair Value Gap (FVG). This premium zone is likely to act as strong resistance, with potential rejection targeting downside liquidity near 3310 — an ideal area for short positions.
🟢 Buy Setup:
If price sweeps below and taps into the Liquidity Zone / Demand Area around 3305–3311, we’ll watch for a bullish reversal from this discount zone. This area offers a favorable setup for long entries, aligning with institutional buying levels.
📌 Be sure to mark these key zones on your chart for enhanced clarity and execution.
💬 What’s your outlook on Gold? Share your thoughts below 👇

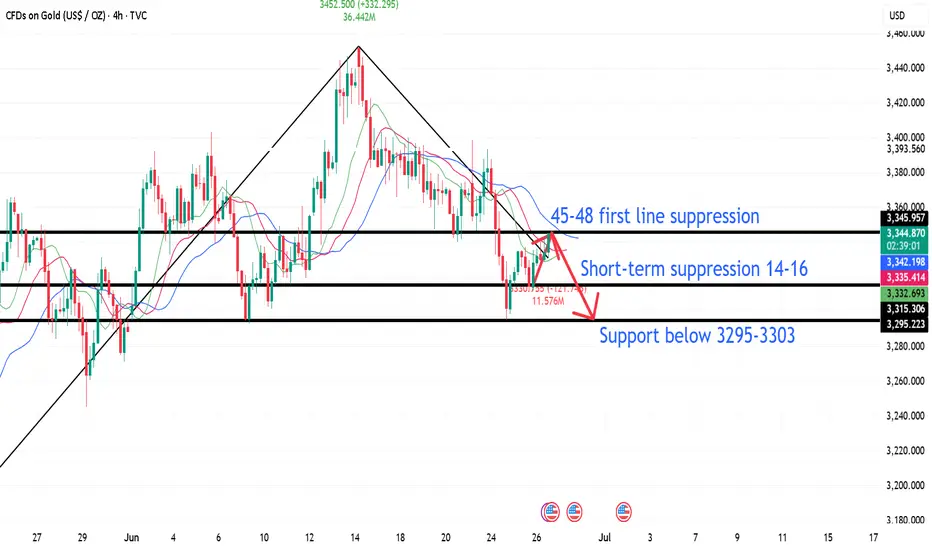
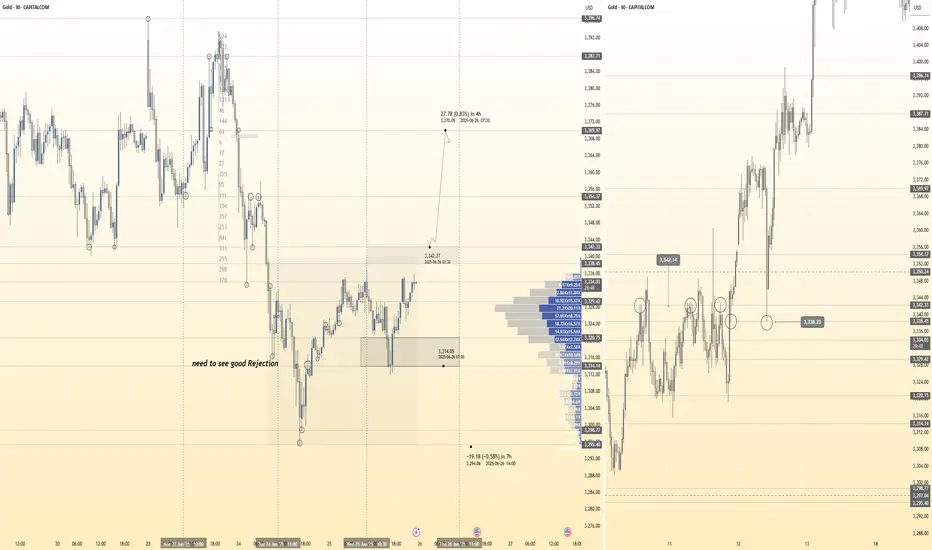
6.26 Gold intraday operation strategy, rebound 42-48 line shortFrom the 4-hour analysis, the upper resistance is around 3342-48. The intraday rebound relies on this position to continue to be short and follow the trend to fall. The short-term support below is around 3314-3316 integers. The upper pressure is around 3342-48. The overall support relies on this range to maintain the main tone of high-altitude low-multiple cycles. The short-term long-short watershed is 3370. It is difficult to say that it is strong before the daily level breaks through and stands on this position. I will remind you of the specific operation strategy during the session, so please pay attention to it in time.
Gold operation strategy:
1. Short the gold rebound at 3345-48, stop loss at 3356, target 3317-3325, and continue to hold if it breaks;
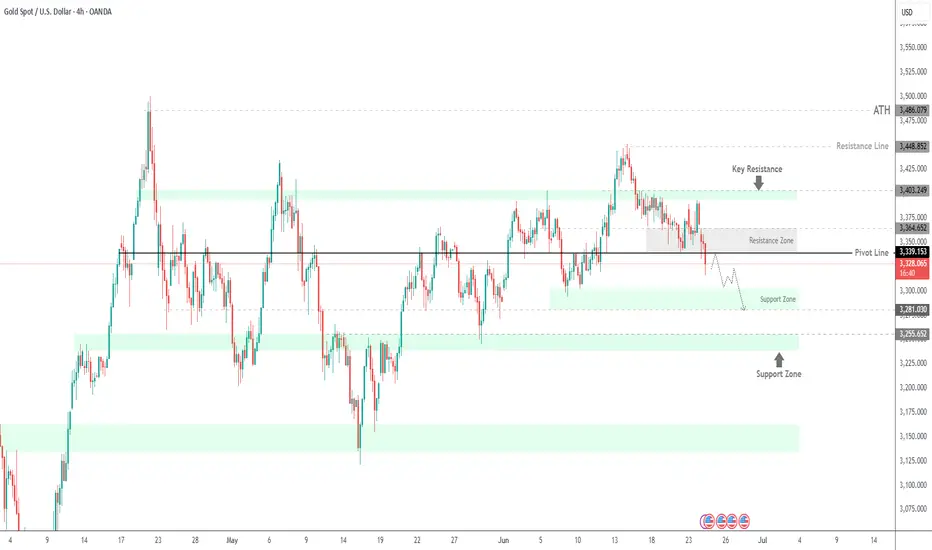
Gold Slips as Ceasefire Eases SafeHaven Demand Bearish Below3339Gold Drops on Israel-Iran Ceasefire
Gold prices declined as safe-haven demand eased following President Trump’s announcement of a ceasefire between Israel and Iran. Despite the pullback, gold remains up nearly 23% year-to-date, supported by ongoing geopolitical tensions, economic uncertainty driven by Trump’s tariffs, and robust central bank purchases.
Market Focus:
All eyes are now on U.S. Federal Reserve Chair Jerome Powell’s testimony, which may offer fresh insights into potential near-term interest rate cuts.
Technical Outlook:
Gold remains under bearish pressure as long as it trades below the 3329–3339 pivot zone.
A confirmed 4H candle close below 3329, or especially 3309, would further validate downside momentum toward the support range.
Support Levels: 3302, 3281, 3256
Resistance Levels: 3364, 3393
A clear break below 3302–3281 would open the path toward deeper bearish continuation.
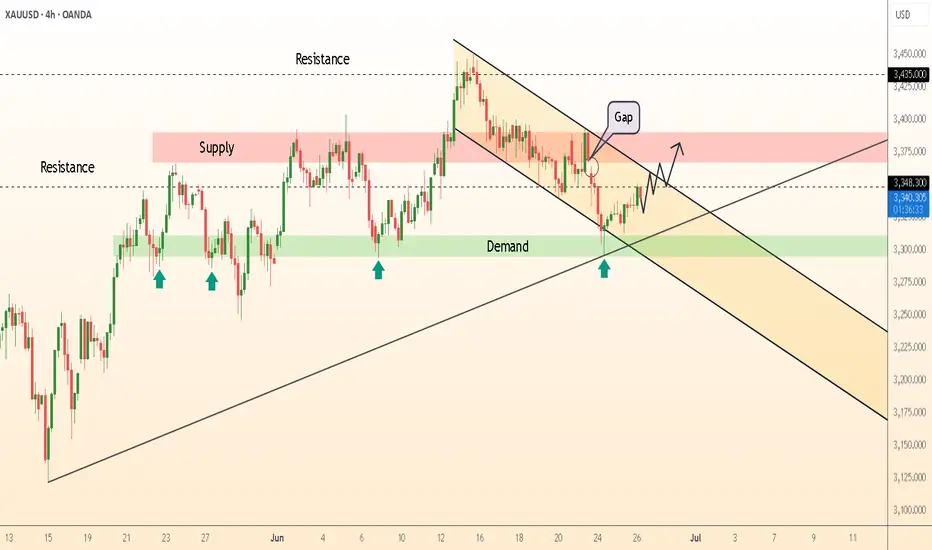
DeGRAM | GOLD rebound📊 Technical Analysis
● Friday’s flush tagged the green 3 300–3 310 demand and the long-term trend-support, then left a bullish gap inside the falling channel; price is now basing above the gap midpoint and printing higher lows toward the pink supply.
● A clean break of channel resistance at 3 348 completes a 4 h inverse-H&S measured to the next confluence at 3 375 (May pivot / former range top).
💡 Fundamental Analysis
● Core PCE cooled to 0.1 % m/m, pulling real 2-yr yields to two-week lows while IMF flagged persistent central-bank bullion buying—both restoring bid tone in gold.
✨ Summary
Long 3 320-3 335; clearance of 3 348 targets 3 375. Bias void on a 4 h close below 3 300.
-------------------
Share your opinion in the comments and support the idea with a like. Thanks for your support!
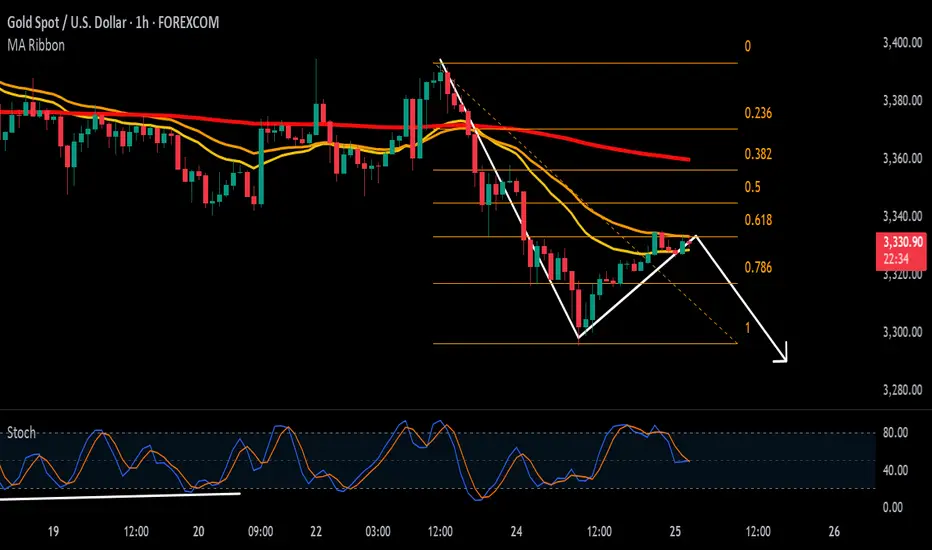
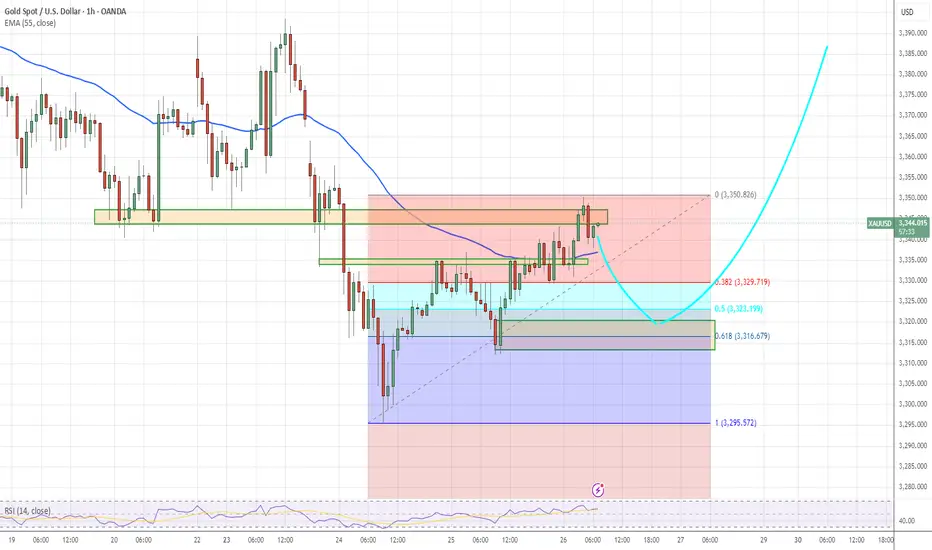
Gold hour chart observationIn the hourly chart period, a small double bottom structure has been broken.
If there is a pullback, pay attention to the 61.8% position to see if there is a reversal signal. You can try to go long
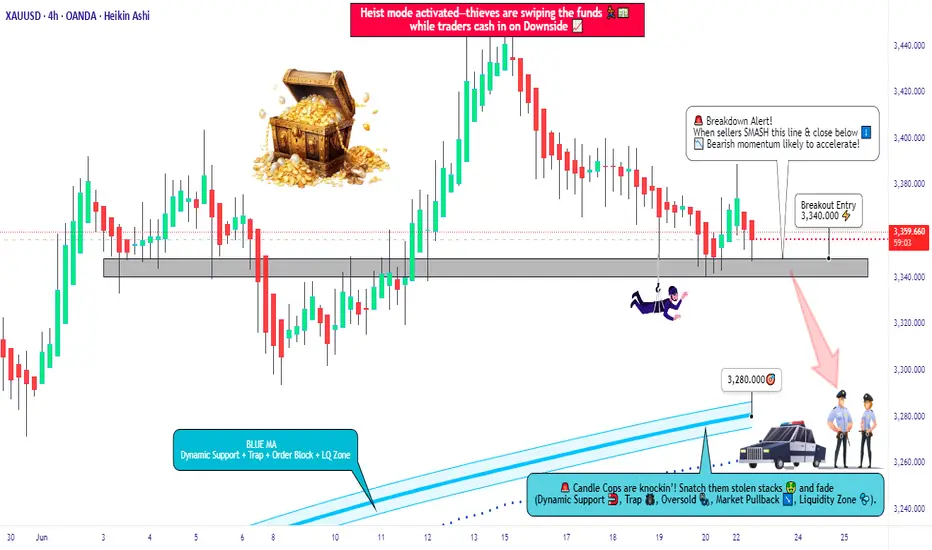
XAU/USD Bearish Bomb Ready to Explode? (Entry Levels Inside)🏦💰 GOLD HEIST ALERT: XAU/USD Bearish Raid in Progress! (Short Setup Inside) 💰🏦
🚨 Cops Waiting at Resistance? Here's How to Steal Pips & Escape Safely! 🚨
🦹♂️ ATTENTION ALL MARKET BANDITS!
To the Profit Pirates & Risk-Takers! 🌍💣
Using our 🔥Thief Trading Tactics🔥 (a lethal mix of liquidity grabs + institutional order flow + macro traps), we're executing a bearish gold heist on XAU/USD—this is not advice, just a strategic robbery plan for traders who play by their own rules.
📉 THE GOLD VAULT RAID (SHORT ENTRY PLAN)
🎯 Loot Zone: 3280.00 (or escape earlier if bulls fight back)
💣 High-Stakes Play: Neutral trend turning bearish - trap for late buyers
👮♂️ Cop Trap: Where bullish traders get arrested by resistance
🔪 ENTRY RULES:
"Heist Activated!" – Strike when price breaks 3340.00
Sell Stop Orders above MA OR Sell Limit on pullbacks (15-30min TF)
Aggressive? Enter at market but use tighter stops
📌 SET ALERTS! Don't miss the breakdown
🚨 STOP LOSS (Escape Plan):
Thief SL at 3390.00 (4H swing high)
⚠️ Warning: "Ignore this SL? Enjoy your margin call."
🎯 TARGETS:
Main Take-Profit: 3280.00
Scalpers: Ride the bear waves only
🔍 FUNDAMENTAL BACKUP (Why This Heist Works)
Before raiding, check:
✅ COT Data (Are big players dumping gold?)
✅ Real Yields (TIPS vs Gold correlation)
✅ Geopolitical Heat (Safe-haven flows drying up?)
✅ DXY Strength (Dollar crushing commodities?)
🚨 NEWS RISK WARNING
Avoid NFP/CPI/FOMC periods (unless you like volatility torture)
Trailing stops = your get-out-of-jail-free card
💎 BOOST THIS HEIST!
👍 Smash Like to fund our next raid!
🔁 Share to recruit more trading outlaws!
🤑 See you at the target, rebels!
⚖️ DISCLAIMER: For entertainment only. Trade at your own peril.
#XAUUSD #GoldTrading #TradingView #LiquidityGrab #ThiefTrading
💬 COMMENT: "Short already—or waiting for confirmation?" 👇🔥
HelenP. I Gold may continue to decline to support levelHi folks today I'm prepared for you Gold analytics. After dropping from the support zone, the price of Gold found temporary support near the trend line and started to rise again. The upward movement was sharp and even created a gap while breaking through the previous support level, which then acted as resistance. For some time, the price hovered around this resistance area but failed to gain enough strength to break higher. Eventually, Gold pulled back to the trend line and began consolidating within a triangle pattern. Inside this structure, it managed to break above the resistance zone again, but this breakout turned out to be false. The price quickly reversed and dropped, breaking through the resistance level and exiting the triangle to the downside. This breakdown also shows that the bullish momentum has weakened significantly. Now, Gold is trading near the trend line again, showing hesitation and a lack of strong bullish continuation. Given this technical behavior, I expect a small rise toward the trend line, followed by a continued drop toward the support level at 3320. That’s the area I’m watching as my current goal. If you like my analytics you may support me with your like/comment ❤️
Disclaimer: As part of ThinkMarkets’ Influencer Program, I am sponsored to share and publish their charts in my analysis.

The Direction After Sideways Fluctuation at 3330Trump's announcement of an Israel-Iran ceasefire dented safe-haven sentiment, curbing safe-haven buying 🛑. Gold opened with a sharp plunge, then extended losses as Powell later stated that more time is needed before considering rate cuts—dovish expectations eased, sending gold further lower ⬇️. The price briefly fell below the 3,300 level, nearing 3,295 at its lowest, but failed to breach the 3,290-3,300 support zone 📊. As I indicated yesterday, traders could test rebound strength near support; once news impacts faded, gold rebounded to close at 3,323 🔄.
Currently trading sideways around 3,330, gold faces resistance at 3,350 while downside support remains at 3,290-3,300 📈📉. We therefore maintain a bearish stance
⚡️⚡️⚡️ XAUUSD ⚡️⚡️⚡️
🚀 Sell@3345 - 3335
🚀 TP 3325 - 3315 - 3305
Accurate signals are updated every day 📈 If you encounter any problems during trading, these signals can serve as your reliable guide 🧭 Feel free to refer to them! I sincerely hope they'll be of great help to you 🌟 👇
Hanzo | 30-Min Setup / incoming 300 Pip After Break Out Time Frame: 30 -Minute Warfare
Entry Mode: Only after verified Break out
🩸Bullish Break : 3338 : 3342.5
Price must break liquidity with high volume to confirm the move.
➕ Hanzo Protocol: Dual- Entry Intel
Zone Activated: Deep Analysis ( 3338 ) Point
why we did chose it ?
Solid Key level
➗1st Wick Touch (11 Jun /2025)
➗2nd Wick Touch (12 Jun /2025)
➗3rd Wick Touch (24 Jun /2025)
Deep Analysis ( 3338 ) Point
why we did chose it ?
➗1st Wick Touch (11 Jun /2025)
➗2nd Wick Touch (11 Jun /2025)
➗3rd Wick Touch (11 Jun /2025)
➗4th x2 Wick Touch (20 Jun /2025)
➗5th x2 Wick Touch (24 Jun /2025)
🔖That means we created a Solid Zone (3338 : 3342) of Breakout on the 30-min Chart -
Price must break liquidity with a clear 30-min candle to confirm the move.
Mastering Delta–Volume Divergence
🎓 Mastering Delta–Volume Divergence: How to Read Institutional Absorption and Trap Setups
⸻
1️⃣ What Is Delta?
Delta measures the net aggression between buyers and sellers:
• Market Buys: traders lifting the ask
• minus
• Market Sells: traders hitting the bid
✅ Positive Delta indicates stronger buying pressure.
✅ Negative Delta indicates stronger selling pressure.
Delta shows who is initiating trades, not just that trading is occurring.
⸻
2️⃣ What Is Volume?
Volume measures the total number of contracts traded, regardless of who initiated them.
Every matched buy and sell contributes equally to volume.
Volume reveals activity, but not who controls the move.
⸻
3️⃣ What Is Delta–Volume Divergence?
Delta–Volume Divergence occurs when:
✅ Volume is high (lots of trades happening),
✅ But Delta is near zero (neither side dominates).
This signals:
• Intense two-sided activity between buyers and sellers,
• Strong participation on both sides,
• Passive absorption—institutions quietly filling large orders without moving price significantly.
⸻
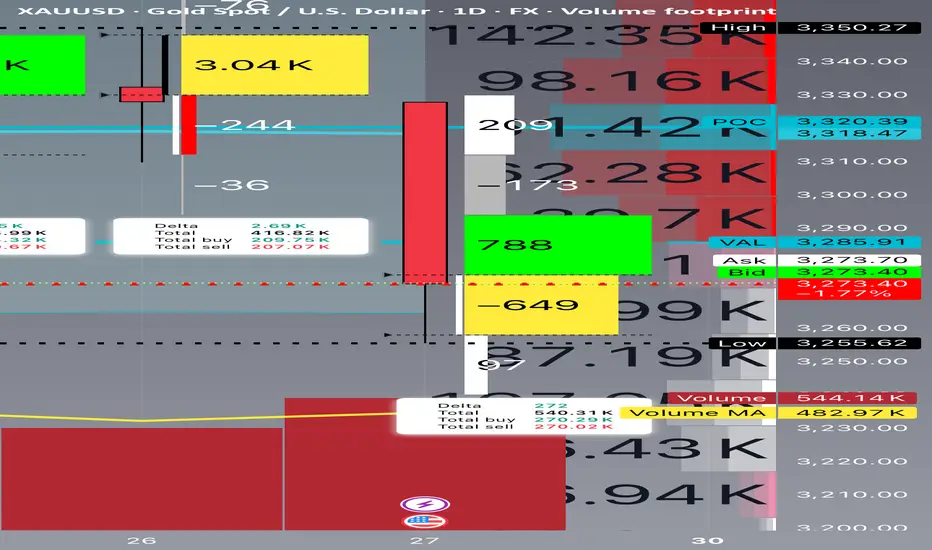
4️⃣ Chart Breakdown – Bar by Bar
Below is a clear example of this concept in practice, reviewing each daily bar from your footprint chart:
⸻
🔴 June 24
• Delta: -8,240 (strong net selling)
• Volume: 575,720 (very high)
• Interpretation:
• Heavy, aggressive selling.
• Clear trend-confirming action.
• No divergence.
⸻
🟢 June 25
• Delta: +4,650 (net buying)
• Volume: 343,990 (moderate)
• Interpretation:
• Counter-trend buying or short covering.
• Less volume and less conviction.
⸻
🟢 June 26
• Delta: +2,690 (mild net buying)
• Volume: 416,820 (higher)
• Interpretation:
• Rising volume but weaker delta.
• Early sign of balance developing.
• Possible absorption beginning.
⸻
🟨 June 27 (Critical Bar)
• Delta: +272 (near zero)
• Volume: 540,310 (very high)
• Interpretation:
• Huge volume churn.
• Neither buyers nor sellers in control.
• Likely institutional absorption of aggressive orders.
✅ This is a textbook example of Delta–Volume Divergence.
⸻
5️⃣ Why This Matters
Professional Insight:
• Sellers had been aggressive for several sessions.
• Suddenly, volume remained elevated, but delta flatlined.
• This suggests:
• Exhaustion of selling aggression, or
• Institutional accumulation and passive positioning.
This often sets the stage for:
• A trap reversal (short squeeze), or
• A continuation flush if sellers regroup and push lower.
⸻
6️⃣ Confirmation Scenarios
Scenario A: Bearish Continuation
• Watch for renewed strong negative delta (e.g., -5,000 or worse).
• Price remains below the last support (~3,250).
• Confirms absorption failed and sellers remain dominant.
Scenario B: Short Squeeze Reversal
• Price reclaims the VAL (~3,285–3,300).
• Delta flips strongly positive (+5,000 or more).
• Trapped shorts begin covering, driving price back toward supply.
⸻
7️⃣ Common Misinterpretation
⚠️ High volume alone does NOT mean momentum.
Key Point:
If delta is flat, high volume simply means churn, not directional energy.
This is why inexperienced traders often get caught:
• They see heavy volume and assume a breakout is underway.
• In reality, the market is absorbing liquidity to trap both sides.
⸻
8️⃣ Professional Tips for Trading Divergence
✅ Wait for confirmation before entering:
• Clear delta shifts, and
• Price reclaiming or rejecting key levels.
✅ Be aware of stop zones:
• Under recent lows if buyers fail,
• Above recent range if sellers get exhausted.
✅ Avoid trading during pure churn without clear follow-through.
⸻
9️⃣ Quick Recap
✅ Delta–Volume Divergence: High volume, flat delta, no clear directional control.
✅ Typically signals absorption and position buildup.
✅ Requires confirmation before committing to trades.
✅ Recognizing it helps you avoid traps and false breakouts.
⸻
🔟 Final Thought
Learning to read divergence is what separates professional traders from retail:
“Volume tells you how hard the market is working. Delta tells you who’s winning.”
Combine both to see the hidden game behind every price bar.
⸻
⚠️ Disclaimer: This lesson is for educational purposes only. Nothing here constitutes financial advice.
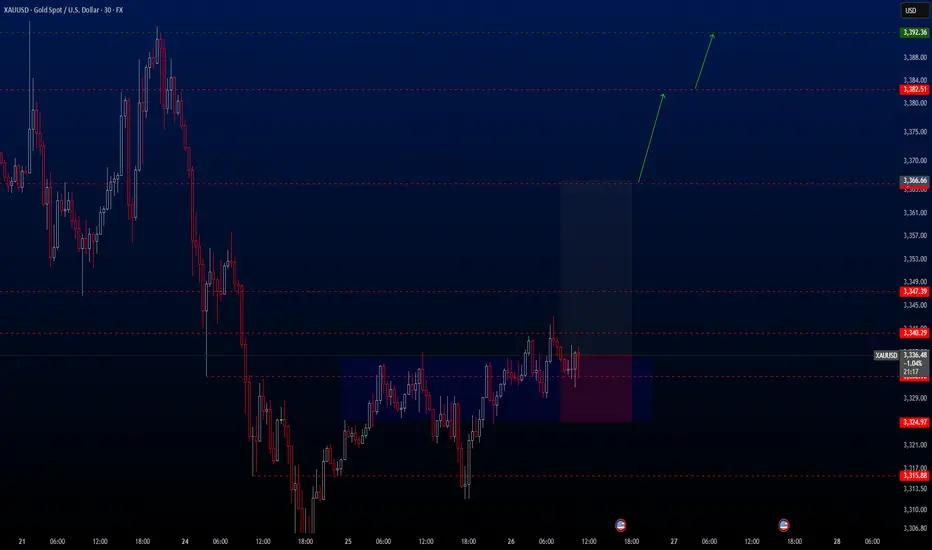
XAUUSD Hello traders.
Today’s first trade setup comes from the XAUUSD pair. The pair is currently positioned in an ideal buy zone, and I’ve spotted a potential long opportunity. There are three different take profit levels, all of which are listed below. Personally, I’ll be closing my position at the first TP level: 3366.66.
However, keep in mind that two major economic events will be released today:
📌 Gross Domestic Product (GDP) (QoQ) – Q1
📌 Initial Jobless Claims
These are highly impactful events, so please manage your risk accordingly.
🔍 Trade Details
✔️ Timeframe: 30-Minute
✔️ Risk-to-Reward Ratio: 1:2.5
✔️ Trade Direction: Buy
✔️ Entry Price: 3336.62
✔️ Take Profit: 3366.67 / 3382.51 / 3392.36
✔️ Stop Loss: 3324.97
🕒 If momentum fades or the price consolidates within a tight range, I’ll keep this trade open only until 23:00 (UTC+4). After that, I’ll close it manually—whether in profit or loss—depending on how the price action evolves.
🔔 Disclaimer: This is not financial advice. I’m simply sharing a trade I’ve taken based on my personal trading system, strictly for educational and illustrative purposes.
📌 Interested in a systematic, data-driven trading approach?
💡 Follow the page and turn on notifications to stay updated on future trade setups and advanced market insights.
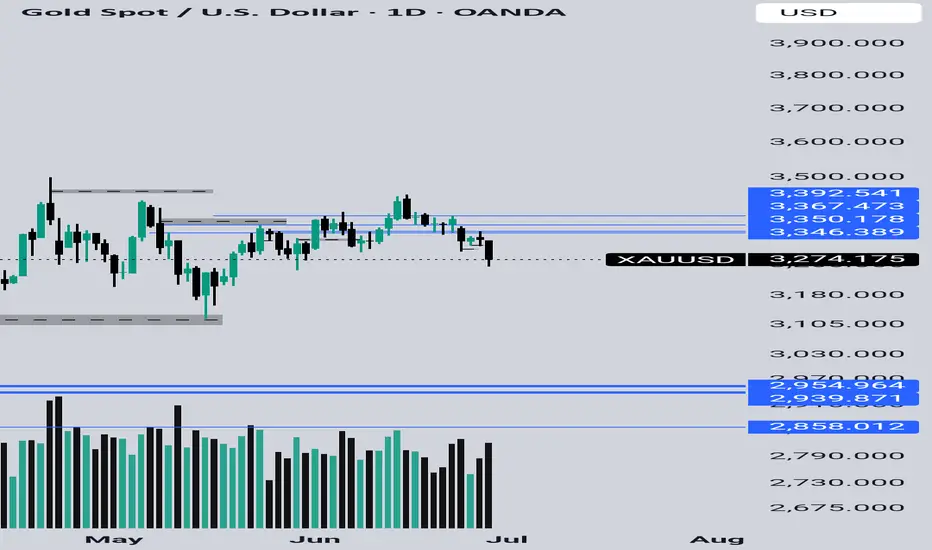
next week trade planBuy Setup (Green Zoon
Buy Entry Zone: 3265–3270
Target: 3290–3300
Stop Loss: 3250
🔻 Sell Setup (Red Zone)
Sell Entry Zone: 3285–3295
Aggressive Sell: Break below 3260
Target: 3235
Stop Loss: 3270