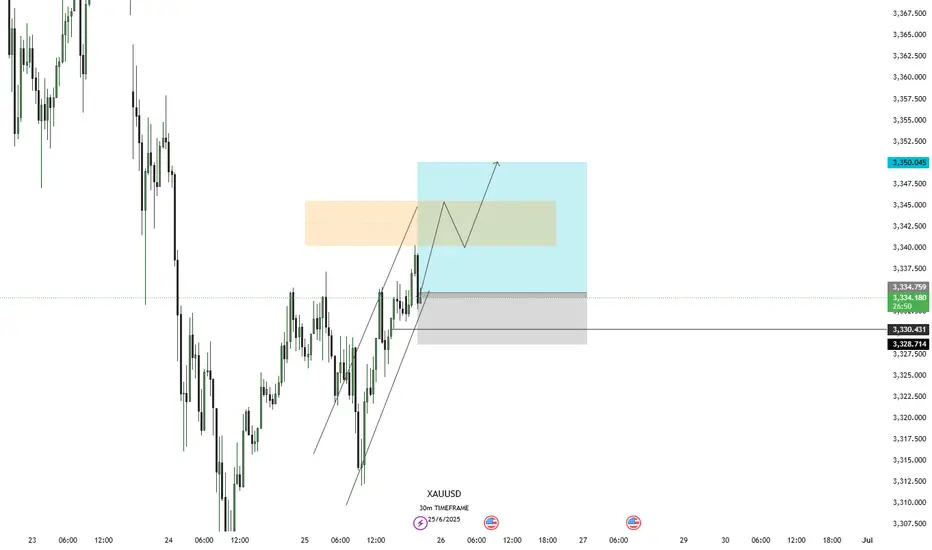
XAUUSD Hello traders.
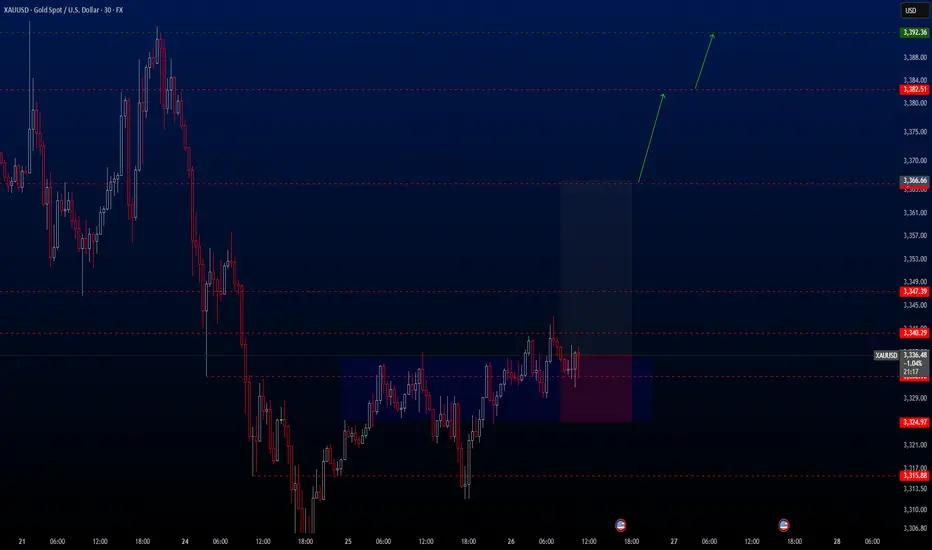
Today’s first trade setup comes from the XAUUSD pair. The pair is currently positioned in an ideal buy zone, and I’ve spotted a potential long opportunity. There are three different take profit levels, all of which are listed below. Personally, I’ll be closing my position at the first TP level: 3366.66.
However, keep in mind that two major economic events will be released today:
📌 Gross Domestic Product (GDP) (QoQ) – Q1
📌 Initial Jobless Claims
These are highly impactful events, so please manage your risk accordingly.
🔍 Trade Details
✔️ Timeframe: 30-Minute
✔️ Risk-to-Reward Ratio: 1:2.5
✔️ Trade Direction: Buy
✔️ Entry Price: 3336.62
✔️ Take Profit: 3366.67 / 3382.51 / 3392.36
✔️ Stop Loss: 3324.97
🕒 If momentum fades or the price consolidates within a tight range, I’ll keep this trade open only until 23:00 (UTC+4). After that, I’ll close it manually—whether in profit or loss—depending on how the price action evolves.
🔔 Disclaimer: This is not financial advice. I’m simply sharing a trade I’ve taken based on my personal trading system, strictly for educational and illustrative purposes.
📌 Interested in a systematic, data-driven trading approach?
💡 Follow the page and turn on notifications to stay updated on future trade setups and advanced market insights.
XAUUSDK trade ideas
XAU/USD) Bullish reversal analysis Read The captionSMC trading point update
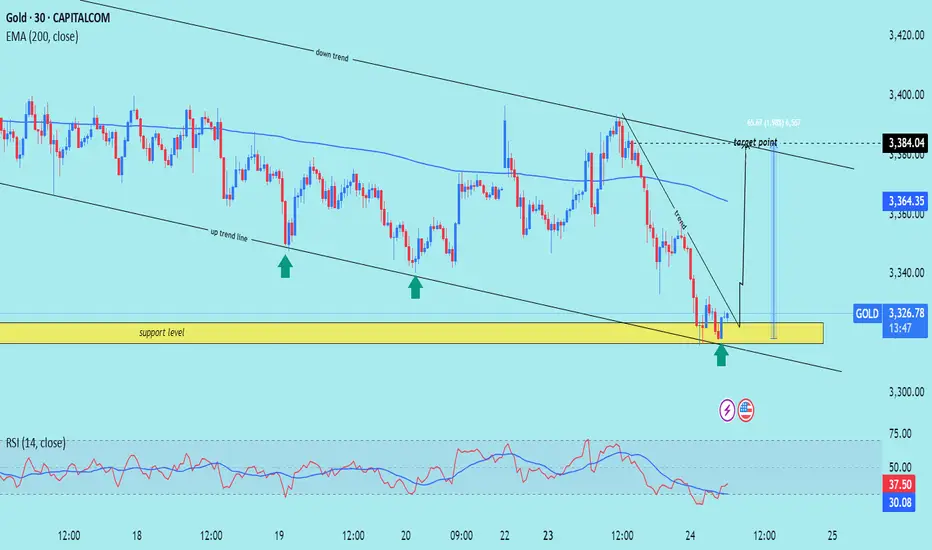
Technical analysis of Gold (XAU/USD) on the 30-minute timeframe, based on technical signals and price action behavior. Here's the breakdown
---
Gold Bullish Reversal Setup – Targeting 3,384
---
Key Technical Highlights:
1. Support Zone & Price Reaction:
Price has tested a strong horizontal support level (highlighted in yellow).
Multiple bullish rejection wicks indicate buying pressure at this zone.
The green arrows show successful support bounces, hinting at bullish intent.
2. Trendline Analysis:
Price bounced near the lower boundary of the falling wedge/downtrend channel.
An uptrend line convergence supports potential reversal.
A breakout above the short-term descending trendline is indicated.
3. EMA & Target Projection:
EMA 200 at 3,364.33 may act as dynamic resistance, the next short-term hurdle.
Target zone projected at 3,384.04, offering a potential move of +65.67 pts (~1.98%).
4. RSI Indicator:
RSI(14) is oversold (~29.93), signaling a potential reversal.
A bullish crossover may be forming, supporting upward momentum.
---
Trading Plan:
Entry Zone: Near current support area around 3,325
Target: 3,384
Stop Loss (Suggested): Below 3,300, under support structure
Risk/Reward: Favorable based on support hold and breakout projection
Mr SMC Trading point
---
Conclusion:
This setup suggests a short-term bullish reversal from a key support area, with confirmation likely if price breaks above the descending trendline and clears the 200 EMA.
Please support boost 🚀 this analysis)
next week trade planBuy Setup (Green Zoon
Buy Entry Zone: 3265–3270
Target: 3290–3300
Stop Loss: 3250
🔻 Sell Setup (Red Zone)
Sell Entry Zone: 3285–3295
Aggressive Sell: Break below 3260
Target: 3235
Stop Loss: 3270
Diamond Targets Loaded 🔱 XAUUSD Trade Setup 🔱
Timeframe: 30m
📈 Price is currently respecting the ascending channel with bullish momentum. We have a clear breakout target area identified.
🎯 Target Zones (Diamonds):
💎 Diamond 1 → 3340
💎 Diamond 2 → 3345
💎 Diamond 3 → 3350
🔻 Support Zone: 3330
💣 Treasure Miss (SL): 3328
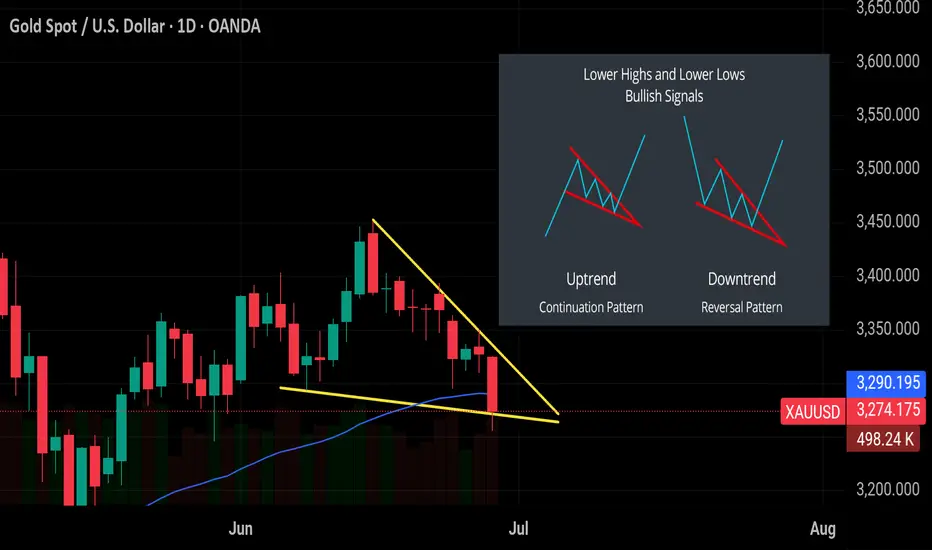
Falling Wedge: The Bullish Pattern Most Traders Miss Falling Wedge: The Bullish Pattern Most Traders Miss
A falling wedge is a bullish pattern that forms when price action contracts between two downward-sloping lines. Both highs and lows are getting lower, but the lower trendline declines more slowly. This shows that sellers are losing momentum.
There are two types of falling wedges:
🟢In an uptrend, it acts as a continuation pattern. The price pauses and consolidates before breaking out upward again.
🔴In a downtrend, it acts as a reversal pattern, often signaling a bottom before a trend change.
Both versions look similar on the chart — a narrowing wedge sloping down. The breakout usually happens to the upside. To trade it 👇
1️⃣Wait for a confirmed breakout above the upper resistance line.
2️⃣Look for strong volume on the breakout to confirm the move.
3️⃣You can enter on the breakout or wait for a retest of the trendline.
4️⃣Place your stop below the recent low.
5️⃣Set a target based on the height of the wedge.
Falling wedges work best in strong trends and become more reliable the longer they form ✍️
#FAQ
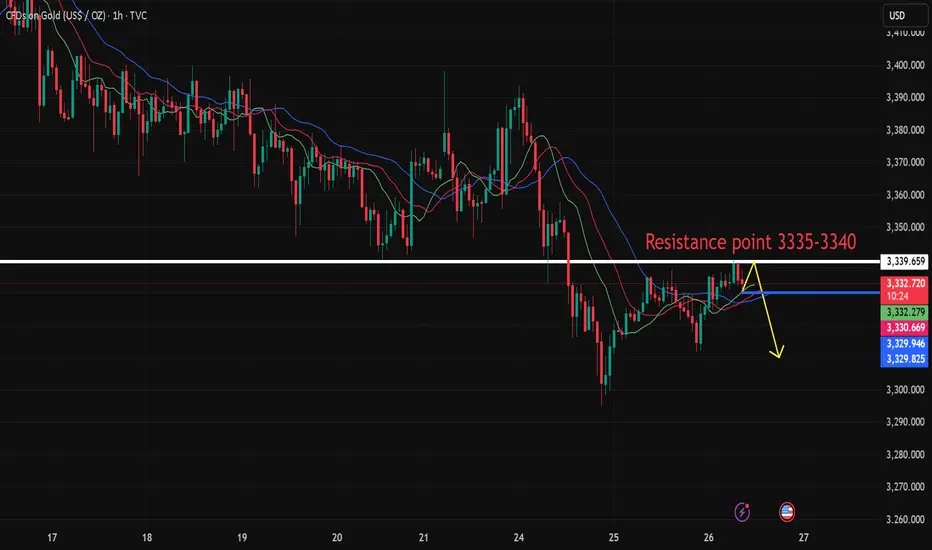
6.26 Gold intraday analysis guideOn Wednesday (June 25), international spot gold rose slightly during the US trading session, but was still suppressed by the 20-day moving average (US$3,355). The RSI (14) was at 48.7, in the neutral range of 40-60, suggesting that the market lacks a clear direction. US$3,355 (20-day moving average) has become the recent watershed between long and short positions. If it breaks through this level, it may test the psychological barrier of US$3,400. The support below is US$3,245 (the low point on May 29). If it fails, it may drop to the integer level of 3,200 and US$3,121 (the low point on May 15). Stability of the geopolitical situation: If the ceasefire agreement in the Middle East continues, the outflow of safe-haven funds may further suppress the gold price. Fed policy expectations: If the July non-agricultural and CPI data show that inflation is cooling down, it may rekindle expectations of interest rate cuts and boost gold. The current gold market is in a "wait-and-see mode", and both long and short sides lack decisive momentum. Traders need to pay close attention to: US economic data: especially employment and inflation indicators for the Fed's policy path. Geopolitical dynamics: Any breakdown of the ceasefire agreement could quickly push up safe-haven demand. Dollar trend: If the Fed maintains a hawkish stance, a stronger dollar may further suppress gold prices. Gold is expected to maintain range fluctuations in the short term, with the $3,355 moving average resistance and $3,245 support forming a key trading range. The direction of the breakthrough depends on new fundamental catalysts.
Personal operation analysis:
Trend: Oscillating trend
Support: Near 3,300.00
Resistance: Near 3,335.50
Strategy:
View logic: Short view near 3,335-3,340, stop loss 3,345, take profit near 3,300--3,280, and follow the stop loss 300 points.
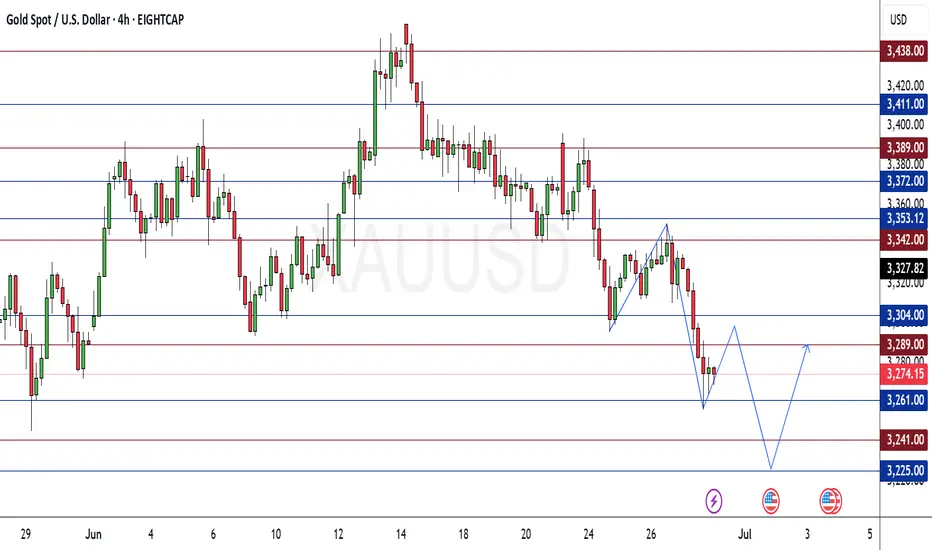
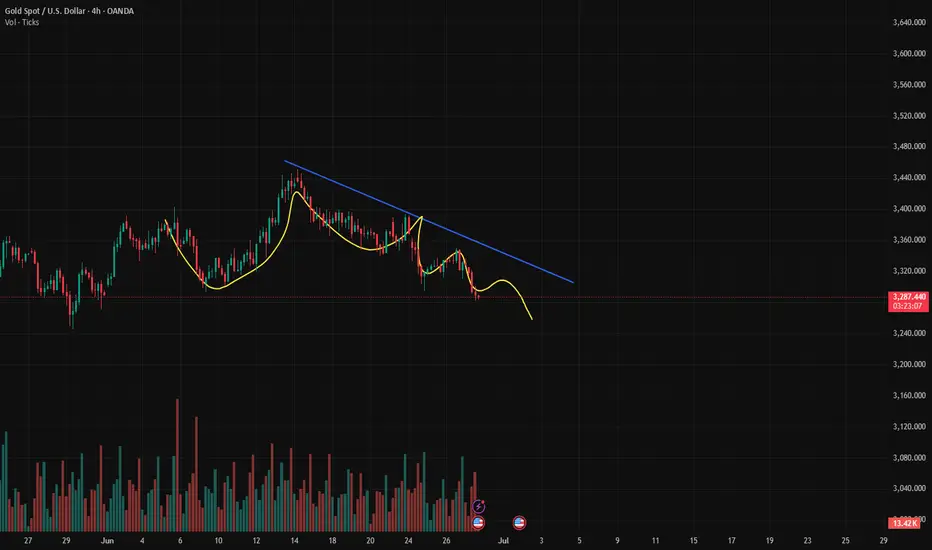
XAUUSD Market Roadmap (June 30 – July 4, 2025)XAUUSD Market Roadmap (June 30 – July 4, 2025)
Currently, XAUUSD is showing a rejection at the 3261 demand zone, signaling a potential short-term pullback. As long as the price remains above the 3241 demand level, there is a possibility of testing the 3289 supply zone. However, if sellers re-enter from that area, the market may resume its decline toward the next demand target at 3225.
Key Levels:
Demand (current rejection zone): 3261
Demand (critical support): 3241
Supply (resistance target): 3289
Next downside target: 3225
Disclaimer:
This analysis is for informational purposes only and does not constitute financial advice or a recommendation to buy or sell any financial instrument. Always conduct your own analysis and apply proper risk management before making any trading decisions.
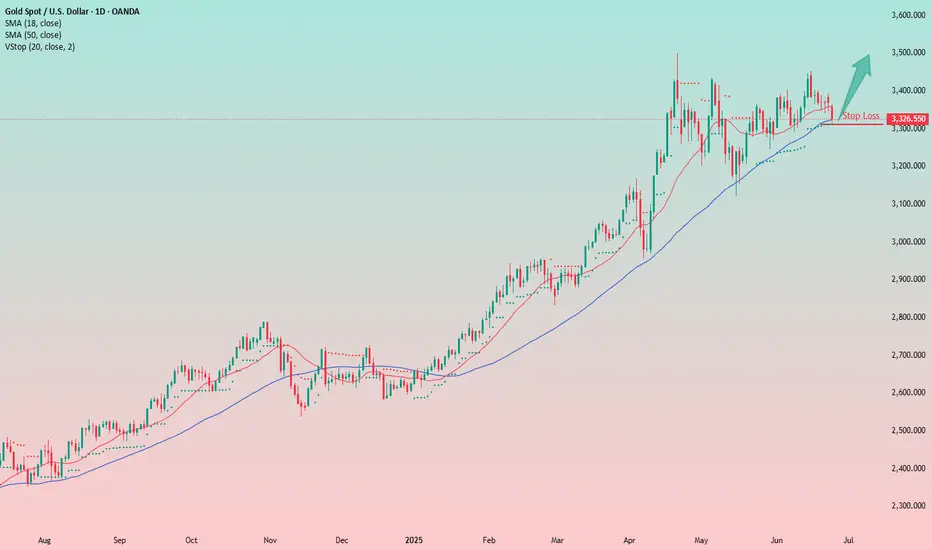
Trend Continuation Setup: Long Entry from MA supportPrice has pulled back to the key moving averages, acting as dynamic support. Trend remains bullish.
A bullish setup has formed, offering a long entry opportunity with limited downside risk.
📝Trade Plan :
Entry: Near the current price, around the moving averages
Stop Loss: Just below today’s low, at the 3310 level
Target: First target around 3500, with potential for continuation if momentum builds
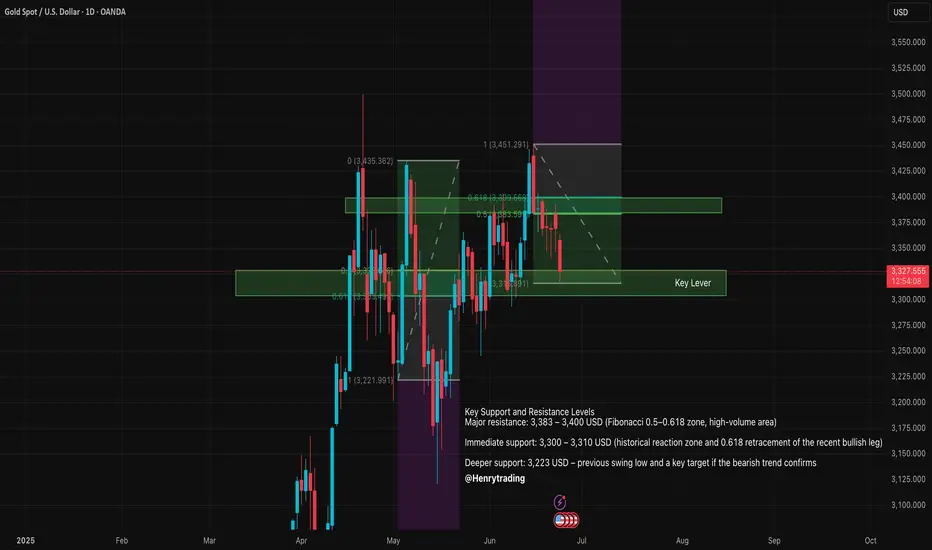
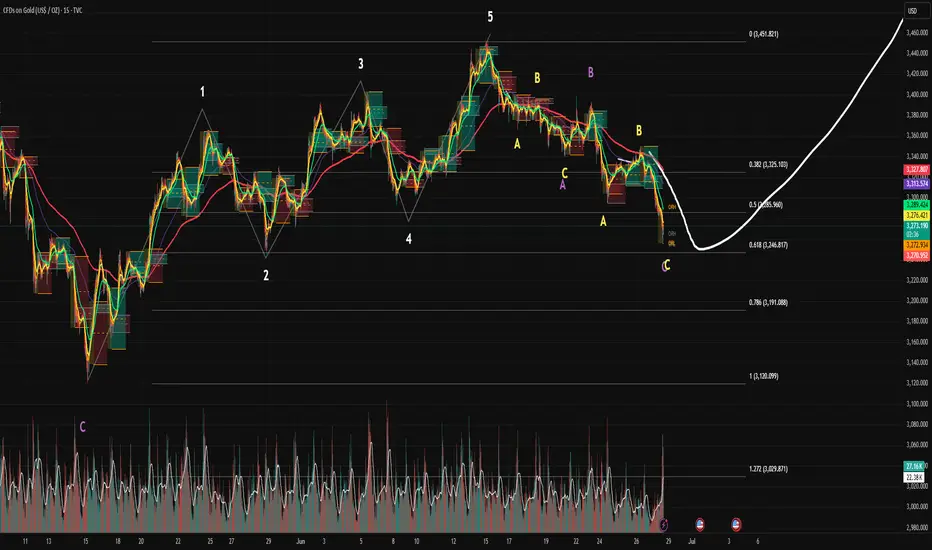
XAUUSD Technical Analysis – June 24, 2025On June 24, 2025, XAUUSD (spot gold) continues to face significant bearish pressure after failing to hold above the key resistance zone around 3,383 – 3,400 USD/oz. This area marks a confluence of the 0.5–0.618 Fibonacci retracement levels and a high-volume distribution zone, signaling strong supply dominance in the short term.
Technical Structure and Fibonacci Analysis
- The recent swing high was established at 3,451 USD, completing a bullish wave from the low of 3,223 USD.
- Price was unable to break through the 0.618 Fibonacci retracement at 3,399 USD, leading to a sharp pullback.
- The current structure suggests the formation of a potential head and shoulders pattern, which would confirm if the market breaks below the 3,300 USD support zone.
Key Support and Resistance Levels
- Major resistance: 3,383 – 3,400 USD (Fibonacci 0.5–0.618 zone, high-volume area)
- Immediate support: 3,300 – 3,310 USD (historical reaction zone and 0.618 retracement of the recent bullish leg)
- Deeper support: 3,223 USD – previous swing low and a key target if the bearish trend confirms
Potential Scenarios
- Bearish scenario: If the price sustains below 3,350 USD and decisively breaks 3,300 USD, it may signal the start of a medium-term downtrend, with targets near 3,200 USD or even lower.
- Bullish scenario: A bounce from the 3,300 USD support could trigger a short-term recovery, but traders should closely watch the reaction near the 3,383 – 3,400 USD resistance zone to assess supply pressure.
RSI and Momentum Indicators
- The 14-period RSI is trading below the 50 level and pointing downward, indicating that bearish momentum remains dominant.
- The RSI has also crossed below its moving average, reinforcing the negative outlook.
Ps: XAUUSD is currently in a critical phase as it tests the 3,300 USD support level. A break below this level could confirm further downside and strengthen the bearish trend. Traders are advised to remain cautious, wait for clear price action confirmation, and apply strict risk management as volatility increases.
Today's gold trading strategy, I hope it will be helpful to you Influencing Factors on Gold Prices:
- Geopolitical Factors:
Trump announced a comprehensive ceasefire between Israel and Iran, which will greatly ease tensions in the Middle East. The market's safe-haven demand triggered by the Israel-Iran conflict will drop significantly, and investors' safe-haven buying of gold will correspondingly decrease, thus exerting downward pressure on gold prices. Historical experience shows that when there was an expectation of a ceasefire agreement between Israel and Hezbollah in Lebanon, gold prices once fell significantly due to the reduction in safe-haven demand.
- Market Expectation Factors:
Although Fed Governor Bowman hinted at a possible rate cut in July, which is positive for gold, the impact of the ceasefire news may be more direct and significant. Currently, market expectations for a Fed rate cut remain uncertain—CME data shows the probability of a rate cut in July is only 8.3%. In this context, the cooling of risk aversion triggered by the ceasefire may temporarily dominate the trend of gold prices, causing gold to face correcton pressure.
- Technical Aspects:
Before the ceasefire news emerged, gold prices fluctuated in the range of $3,350-$3,395, with $3,350 providing certain support and $3,400 serving as the upper resistance level. It is expected that after the ceasefire news is announced, gold prices may test the support at $3,350. If the support fails, they may further fall to around $3,300.
Today's gold trading strategy, I hope it will be helpful to you
XAUUSD sell@3365~3355
SL:3380
TP:3345~3330
USD under pressure ahead of PCE—gold holds $3,300The euro has reached its highest level since October 2021, driven in part by commitments from European leaders to increase NATO defence spending.
The swing factor for the euro dollar in the shorter term is the possibility of US rate cuts. Critical for this will be US inflation data, starting with tomorrow's PCE report. If tariffs fail to significantly lift inflation, the case for a July rate cut strengthens—adding further pressure on the dollar.
That weakness is also supporting gold. XAUUSD is above $3,300. Recent price action has formed a potential symmetrical triangle on the daily chart—a structure that can precede a breakout. A move above $3,400 could signal renewed bullish momentum.
Gold Top Down Analysis end of June 2025Welcome to my Top Down Analysis. My short trade has not yet reached TP but I explain in the video how the next few weeks might go.
My sell entry : 3443
My TP : 3214

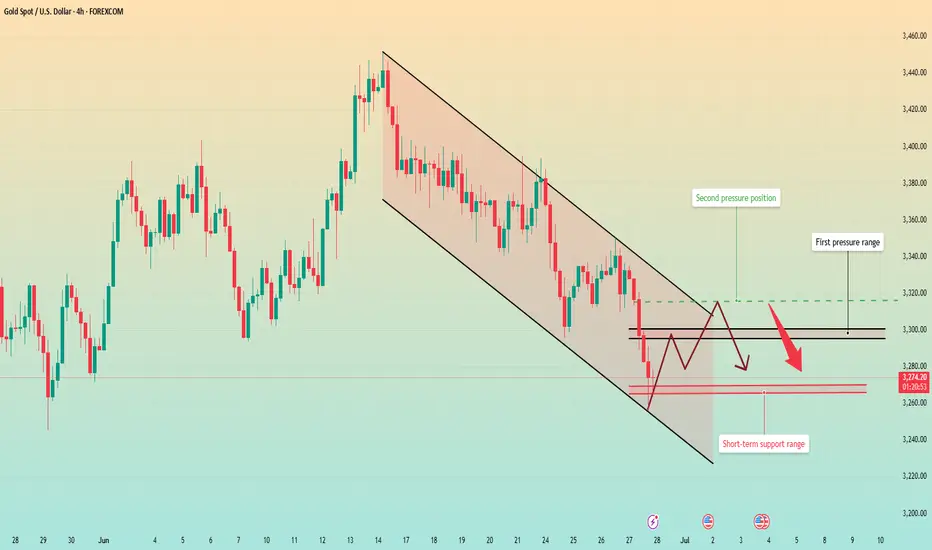
XAUUSD/GOLD/SellThe pressure from the bears is too great. In the end, the pressure from above was not broken. Instead, it broke out and fell after being under pressure. The stop loss was hit.
The current price is 3285. After gradually boosting the US dollar index. The trend of gold prices has continued to fall. More importantly, the tariff issue has been eased. At the same time, geopolitical factors are also orderly and stable. This is the news that caused the bears to attack.
History has not become the savior because of repeating itself. Of course, this is also an emergency. In some transactions, the extremely low probability of causing losses is a common problem in transactions. However, our analysis team has stabilized a high trading win rate.
Then the next trading plan is still to focus on the pressure from above. If the London market rebounds above 3300. It is still mainly selling. 3314 is an important level for short-term rebound, and we need to pay attention. Although there is no obvious sign of rebound yet, the release of short-selling pressure has been alleviated because the decline is slow. Today's main trading idea is still to sell at high levels.
The target is to focus on the position of 3264-3248. Remember the risk of buying at low levels. Do not trade independently.
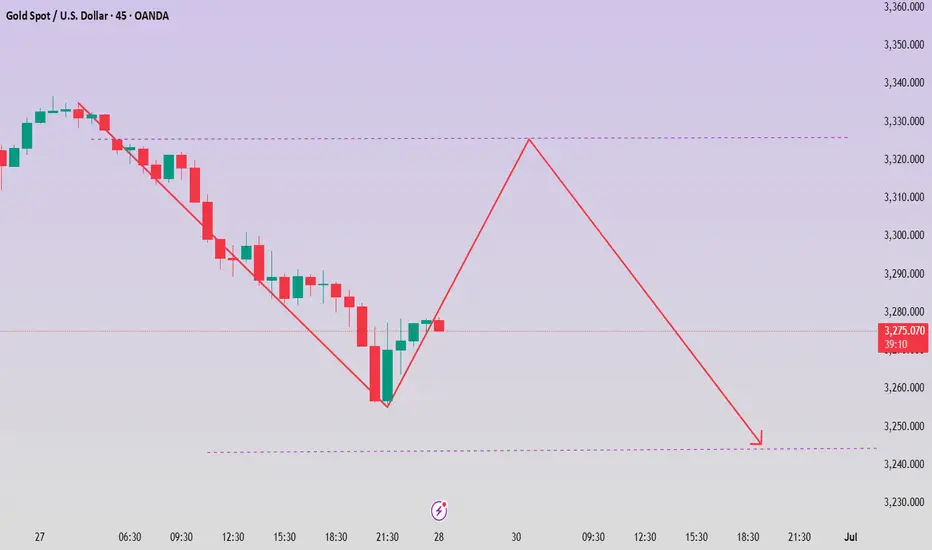
The data is negative. Will the price rebound from the bottom?Gold prices have continued to fall since the high near 3450. This trading day started the downward mode near 3328, and the European session continued to fall, breaking a new low. The negative PCE data also continued the downward mode. So far, it has rebounded after hitting the lowest level near 3255. However, the rebound is small, and the upper pressure is still very strong.
From the 4-hour chart, short-term resistance focuses on the vicinity of 3295-3300, followed by important pressure near 3315. The short-term support below focuses on the vicinity of 3265-3270. The overall strategy of shorting at high positions remains unchanged based on this range.
Operation strategy:
Short at the price rebound near 3295, short covering at the high point of 3315, stop loss 3325, profit range 3370-3360.
At present, the price fluctuates greatly. If you want to try scalping transactions, you can trade with a light position and float up and down 5 points to stop loss or profit in time.
This is the last trading day of this week. I hope you all will gain something and have a happy weekend with your family.
Bullish strategy around 3270 in US trading
Gold prices (XAU/USD) once again came under selling pressure during the Asian session on Friday, falling back below $3,300 following a lackluster performance the day before. Gold prices are approaching a two-week low hit on Tuesday as investors await the release of the US personal consumption expenditures (PCE) price index. This key inflation indicator is expected to provide a new interpretation of the Fed's policy outlook and could significantly affect the direction of the US dollar (USD), ultimately determining the short-term direction of this non-yielding gold.
Selling pressure last weekend caused gold prices to fall below 3300, and today the selling pressure continued to fall
⭐️Set gold price:
🔥Sell gold area: 3326-3328 SL 3333
TP1: $3315
TP2: $3302
TP3: $3290🔥
Buy gold area: $3248-$3250 SL $3243
TP1: $3260
TP2: $3270
TP3: $3280⭐️
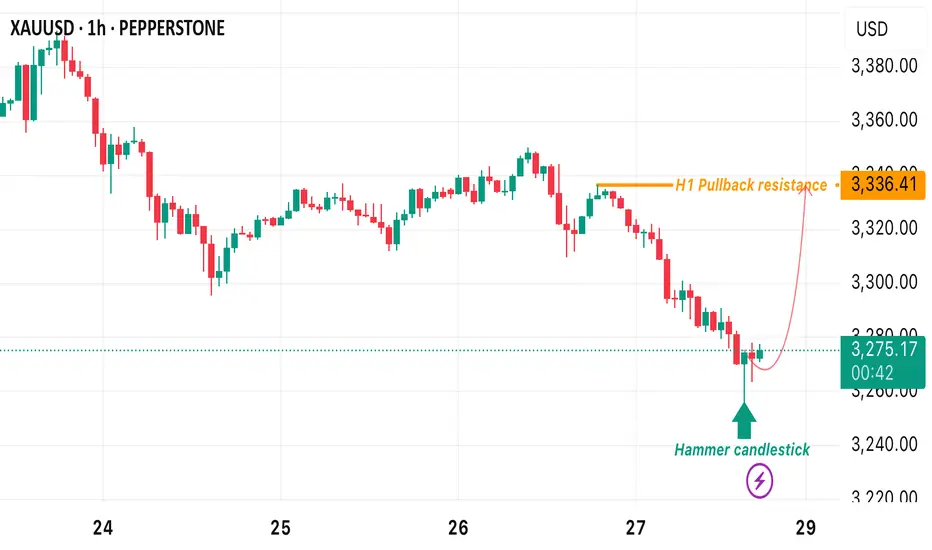
XAUUSD BUY OPPORTUNITY!!Price just formed a reversal Candlestick in H1 after making a new low recently.
From the technical standpoint, i anticipate price to retrace back to the pullback resistance of 3336.41 from the current market price.
Review and Speculation for the 10 Elite PairsYou can follow us for more Analysis(Images and Videos) with Precise definition of the Financial Market.ENJOY!!!

Gold is near the 0.618 levelGold is near that 0.618 level, going to watch it closely from here. We might not get an entry until Sunday at 6pm NY time when market open.
Key Level to watch 3249, 3194
We need SPY / ES to come down for gold to gain momentum.
XAUUSD GOING LONG📊 CHoCH Spotted (LTF) – Market just broke structure bullish!
📈 Buyers are now in control.
🔻 Waiting for price to pull back into Demand Zone (last bearish candle before the push up).
🎯 Target: Supply Zone above
🛑 SL: Just below Demand Zone
🟢 Looking to buy the dip and ride the bullish wave!
GOLD: Will Go Up! Long!
My dear friends,
Today we will analyse GOLD together☺️
The in-trend continuation seems likely as the current long-term trend appears to be strong, and price is holding above a key level of 3,274.66 So a bullish continuation seems plausible, targeting the next high. We should enter on confirmation, and place a stop-loss beyond the recent swing level.
❤️Sending you lots of Love and Hugs❤️
GOLD China Hong Kong gold vault hints at a geopolitical shift, as the Shanghai Gold Exchange's expansion, aims to enhance China's gold trading infrastructure and challenge Western dominance, potentially impacting demand and supply of physical gold need.
3380-3385 triggered but be cautious
wait at 3350-3355 as next demand zone for 70pips or more
Suppression remains unchanged, the latest layout of gold📰 Impact of news:
1. Powell's testimony
2. Geopolitical impact
📈 Market analysis:
The short-term rebound of gold is the release of energy for the accumulated bulls. From the current market trend, 3340 above is the key point of the short-term watershed between bulls and bears. The short-term resistance above is around 3342-3348, and the short-term support below is around 33220-3315. If it falls below this, it will continue to look towards yesterday's low of 3290-3280. The daily level is under pressure and continues to see a decline and adjustment. If it touches 3340-3350 above, you can try to short. After it retreats to 3320-3315 and obtains effective support, you can consider going long.
🏅 Trading strategies:
SELL 3340-3350
TP 3330-3320-3315
BUY 3320-3315
TP 3330-3340-3350
If you agree with this view, or have a better idea, please leave a message in the comment area. I look forward to hearing different voices.
OANDA:XAUUSD FX:XAUUSD FOREXCOM:XAUUSD FXOPEN:XAUUSD TVC:GOLD
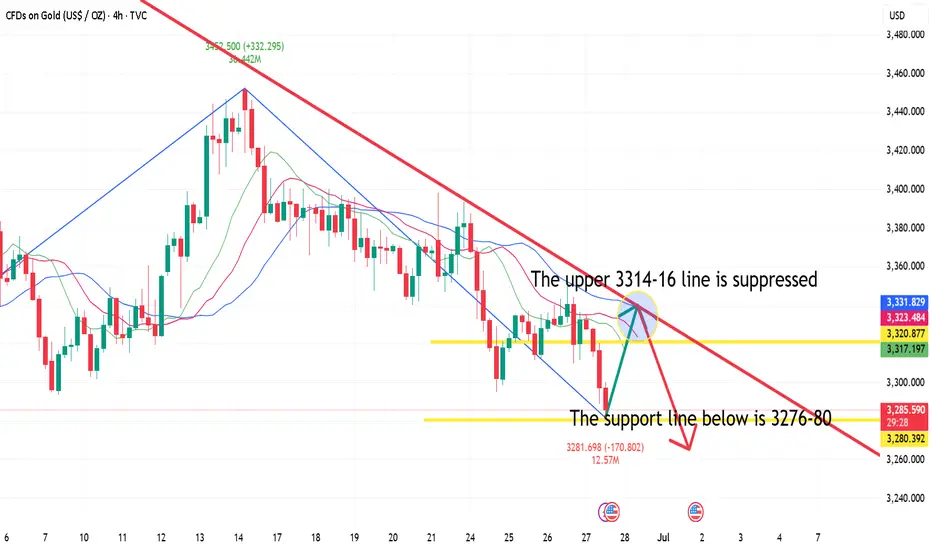
6.27 Gold rebounds and adjusts, don't chase shorts at low levelsGold fell below this week's low of 3295 today. As of now, gold has hit 3285 and is fluctuating. Don't chase the short position and short it when it rebounds. Now you can only wait patiently for the rebound before entering the short position. Be a steady hunter and wait patiently for the appearance of prey!
Gold is now focusing on the short-term suppression of the upper 3301-3306 line, focusing on the suppression of the upper 3314-16 line, and the support below is 3276-80. Short it when it rebounds.
Strategy ideas:
1. Gold rebounds to 3301-3306 line and shorts lightly, rebounds to 3314-16 line to cover short position, stop loss 3324, target 3280-85 line;