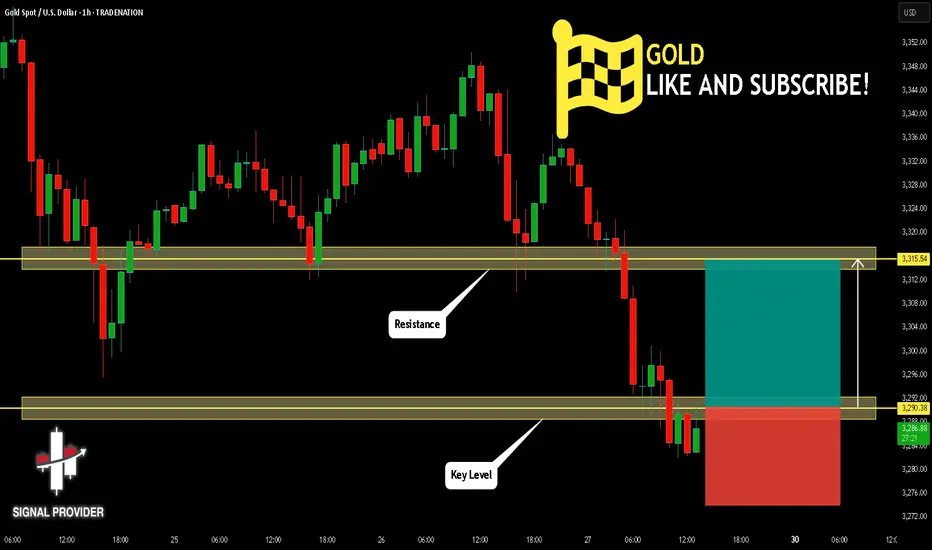
GOLD - SELL TO $3,288 (1H VIEW)Still looking for a move lower into the $2,787 - $3,276 zone, to take out the June low, like I mentioned to you all a few days ago.
Tomorrow is Friday so be careful as price action could be choppy & use strict risk management.
⭕️Imbalance Left Below $3,300 Psychological Number.
⭕️Either Wave 2 or Wave C Not Complete of Major Impulse Move Down.
⭕️Sellers Holding Below Resistance Zone.
TP: $3,288
XAUUSDK trade ideas
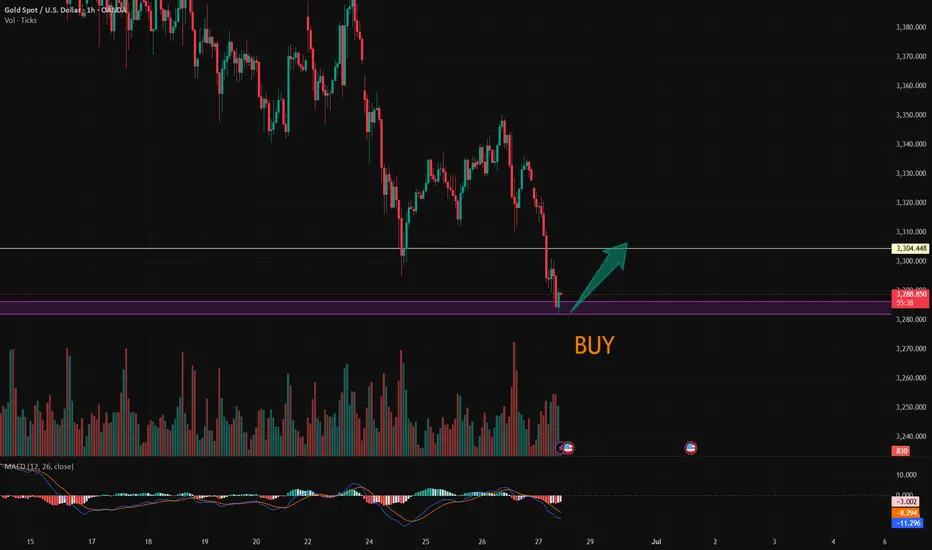
GOLD Will Grow! Long!
Here is our detailed technical review for GOLD.
Time Frame: 1h
Current Trend: Bullish
Sentiment: Oversold (based on 7-period RSI)
Forecast: Bullish
The market is trading around a solid horizontal structure 3,290.38.
The above observations make me that the market will inevitably achieve 3,315.54 level.
P.S
We determine oversold/overbought condition with RSI indicator.
When it drops below 30 - the market is considered to be oversold.
When it bounces above 70 - the market is considered to be overbought.
Disclosure: I am part of Trade Nation's Influencer program and receive a monthly fee for using their TradingView charts in my analysis.
Like and subscribe and comment my ideas if you enjoy them!
XAUUSD:Go long
Short - term first do a rebound.
Trading Strategy:
BUY@3283-86
TP:3297-3304
More detailed strategies and trading will be notified here ↗↗↗
Keep updated, come to "get" ↗↗↗
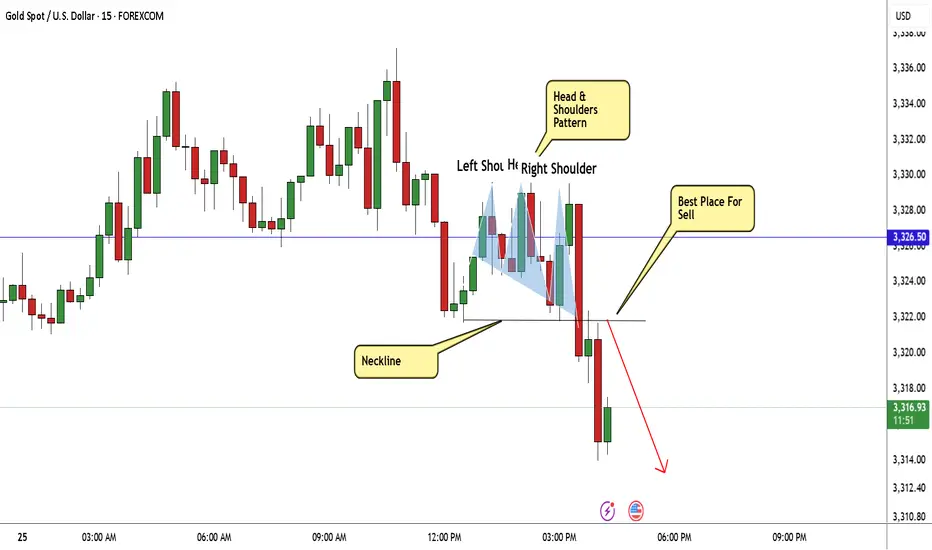
GOLD Made H&S Reversal Pattern , Chance To Sell To Get 200 PipsHere is My 15 Mins Chart On Gold and we have a very good reversal Pattern , Head & Shoulders , we have a 15 mins closure below neckline 3322.00 we can enter a sell trade and targeting at least 100 pips as scalping , we can enter after waiting the price to retest neckline and then enter . and the price can reach 3300.00 to 3296.00 again .
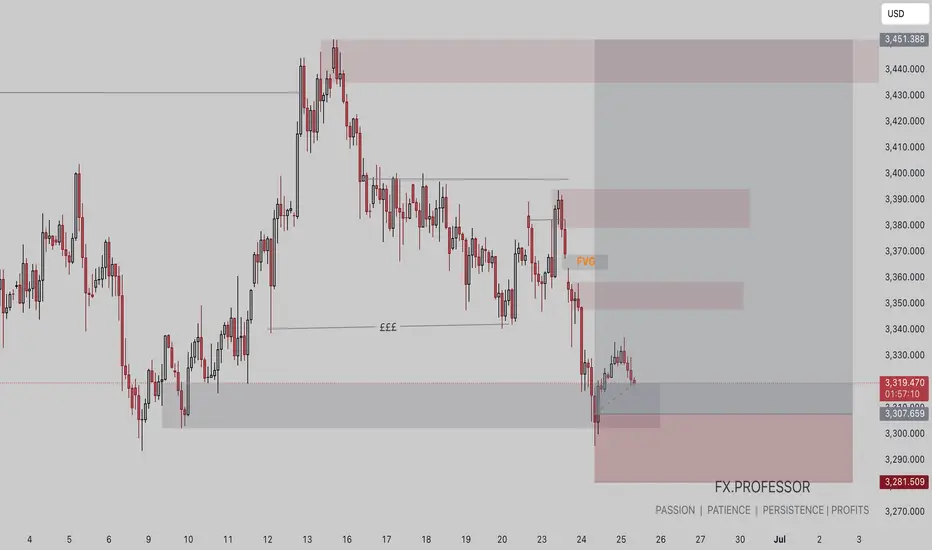
GOLDCurrently on a buy trade on Gold but we also have 2 supply levels above as our POI where we could be watching closely for sell opportunities. Personally, i prefer the extreme POI because it has FVG right below it which i expect to be filled up so my bias on GOLD is buy to sell.
Another excellent sessionAs discussed throughout my yesterday’s session commentary: “My position: Gold is Trading on relief rally and it is now whether #3,352.80 benchmark will break to the upside and extend the relief rally or reversal there and another decline. I personally lean more to the Bullish side with DX chart as main pointer for Gold on current session.”
I have made #7 successful Scalp orders throughout yesterday’s session (all Buying orders) firstly from #3,330.80, then #3,320.80 towards #3,327.80 and final batch of aggressive Scalps from #3,310.80 towards #3,318.80 - #3,325.80 / Highly satisfied with yesterday’s session Profit.
Technical analysis: Gold is currently disconnected from Hourly 4 chart’s Neutral Rectangle and thus I am expecting a new Selling direction starting from today’s session if #3,300.80 benchmark isn’t recovered and market closes above it (Weekly closing as well). Personally I believe it will be a big one on big Volume (best what last session of the week can offer). Hourly 1 chart is delivering firm Selling signals and points to a Bearish breakout and Selling continuation. A red closing on today's Daily chart’s candle points to a Bearish continuation also. Personally I believe that only if local Support gets invalidated (seen Trading at #3,272.80) does the trend resumes its previous Bearish bias also without more disappointing numbers on DX. No surprises so far as rejection on #3,292.80 - #3,300.80 Resistance level is showcasing strong durability for the cycle. This is a Technical pullback as well to cool down Long-term Overbought levels and may precisely test the #3,252.80 benchmark / near pivot point, probability which I mentioned earlier this week.
My position: I am Highly satisfied with my Profit and will take early weekend break, not catching a Falling knife
Another excellent sessionAs discussed throughout my yesterday’s session commentary: “My position: Gold is Trading on relief rally and it is now whether #3,352.80 benchmark will break to the upside and extend the relief rally or reversal there and another decline. I personally lean more to the Bullish side with DX chart as main pointer for Gold on current session.”
I have made #7 successful Scalp orders throughout yesterday’s session (all Buying orders) firstly from #3,330.80, then #3,320.80 towards #3,327.80 and final batch of aggressive Scalps from #3,310.80 towards #3,318.80 - #3,325.80 / Highly satisfied with yesterday’s session Profit.
Technical analysis: Gold is currently disconnected from Hourly 4 chart’s Neutral Rectangle and thus I am expecting a new Selling direction starting from today’s session if #3,300.80 benchmark isn’t recovered and market closes above it (Weekly closing as well). Personally I believe it will be a big one on big Volume (best what last session of the week can offer). Hourly 1 chart is delivering firm Selling signals and points to a Bearish breakout and Selling continuation. A red closing on today's Daily chart’s candle points to a Bearish continuation also. Personally I believe that only if local Support gets invalidated (seen Trading at #3,272.80) does the trend resumes its previous Bearish bias also without more disappointing numbers on DX. No surprises so far as rejection on #3,292.80 - #3,300.80 Resistance level is showcasing strong durability for the cycle. This is a Technical pullback as well to cool down Long-term Overbought levels and may precisely test the #3,252.80 benchmark / near pivot point, probability which I mentioned earlier this week.
My position: I am Highly satisfied with my Profit and will take early weekend break, not catching a Falling knife.
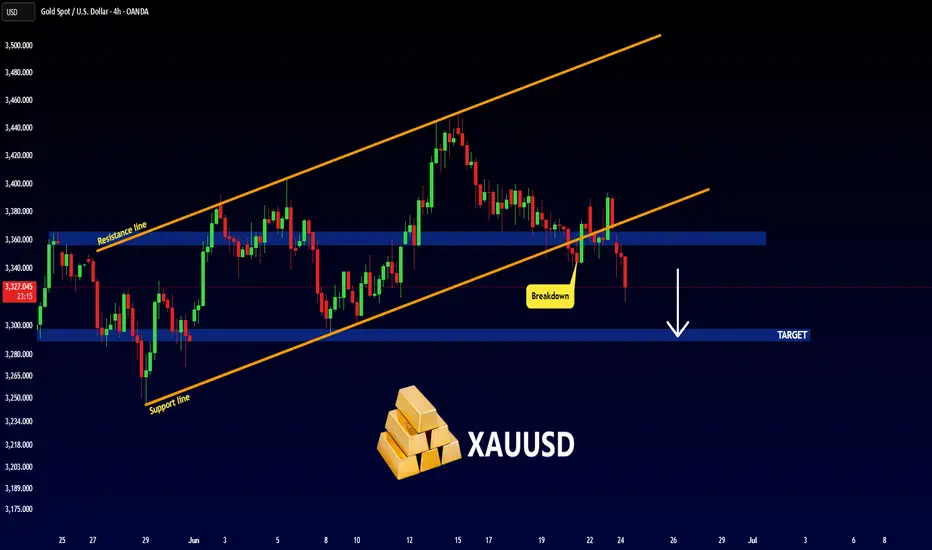
GOLD - BEARISH MOVE !Hello Traders !
The GOLD price formed an ascending channel.
Currently, The support line is broken!
So, I expect a bearish move📉
______________
TARGET: 3300🎯
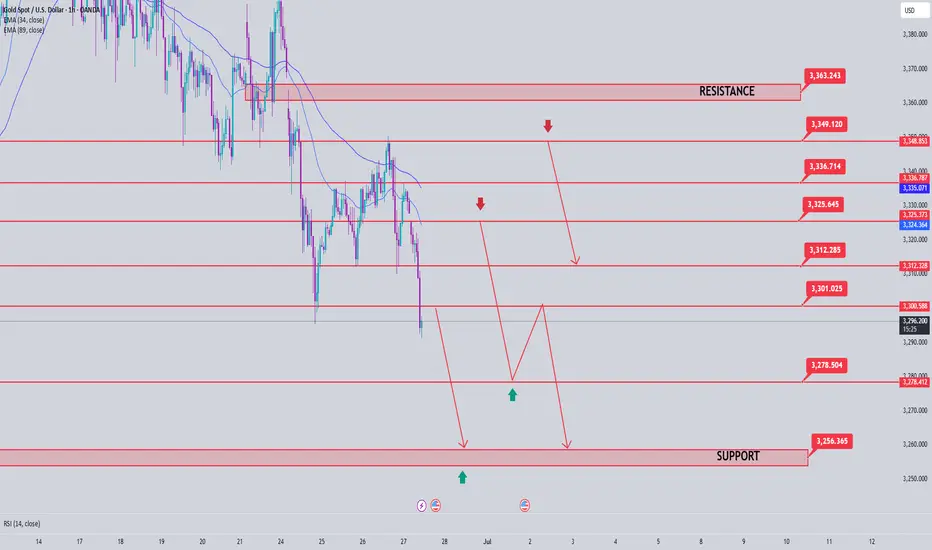
Gold Price Analysis June 27Daily Trend Analysis:
The price has reacted strongly at the 3348 level, forming a clear and sustainable bearish structure. The 3296 zone is now a critical level — a confirmed breakout below this area could lead to a deeper decline, especially with limited potential for recovery on Friday.
Today, the bearish trend is likely to face less resistance compared to the bullish side. As such, a move toward the support zones at 3278 and 3255 is highly probable.
Any bullish retracement during the European session should be viewed as a good opportunity to look for SELL setups, targeting 3278 and 3255.
As previously analyzed, SELL zones are clustered around key resistance levels. Traders should closely watch price reactions in these areas for potential entry signals.
🔹 Breakout key level: 3296
🔹 Support zones: 3278 – 3255
🔹 Resistance zones: 3300 – 3312 – 3325 – 3336 – 3348 – 3363
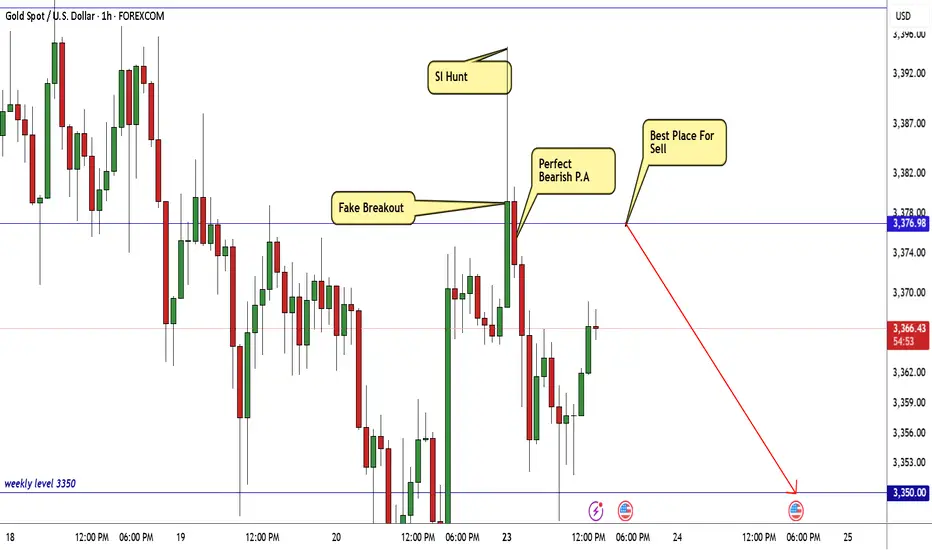
Gold Take All Stop losses,Are You Ready To Sell To Get 300 Pips?Here is my 1H Gold Chart and this is my opinion , the price opened this week with massive wick to upside to take all stop losses and then moved to downside very hard and aggressive , we have a very good Res that we sell from it last week 3377.00 , it`s still strong and forced the price many times to respect it so it still my fav level to sell it again today if the price touch it and give me a good bearish price action to confirm the entry and we can targeting 300 pips at least . if we have a daily closure above my res then we will think about buying instead of selling , but until now i`m looking to sell it from the level i mentioned .
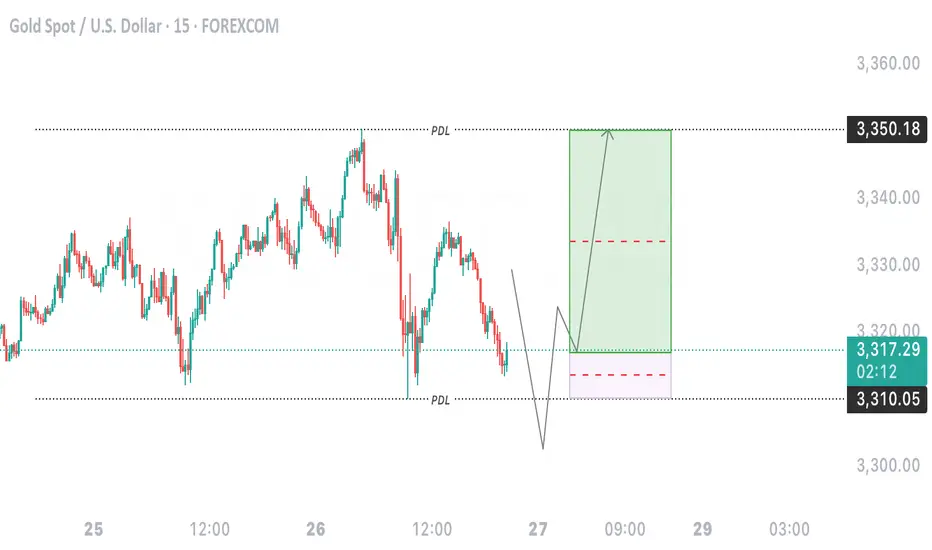
XAU/USD Bullish Reversal from Key SupportXAU/USD Bullish Reversal from Key Support 📈🟢
📊 Chart Analysis:
Rounded Bottom Structure ⬆️
The price has formed a rounded bottom pattern, indicating potential trend reversal from bearish to bullish.
Multiple bounces (🟠 circles) from the curved support trendline confirm the validity of this structure.
Support Zone Rejection ✅
Price recently rejected from a major horizontal support zone (around 3,303.796 USD) with a strong bullish wick.
This zone has acted as a springboard for prior upward moves.
Falling Wedge Breakout 💥
A falling wedge (bullish pattern) has formed and is breaking to the upside.
Breakout confirmation is underway, indicating momentum shift.
Target Projection 🎯
The projected move from the breakout suggests a potential target at 3,385.820 USD.
This aligns with previous resistance areas.
Key Levels to Watch:
Resistance: 3,385.820 USD (target) and 3,425–3,450 USD (major resistance zone)
Support: 3,303.796 USD (short-term), followed by 3,225–3,250 USD zone
🔔 Conclusion:
Price action suggests a bullish bias with a possible upward continuation if it sustains above the wedge breakout.
Confirmation above 3,330 USD with volume can fuel a rally toward the 3,385–3,400 USD target zone.
📌 Risk Management Tip: Watch for fakeouts near wedge resistance or a re-test of 3,303 USD for better entries.

Gold potential short term bullishness Gold prices have found some relief and are experiencing a minor recovery amidst the mixed market sentiment driven by ongoing Middle East tensions, Trump's call for rate cuts, and Fed Chair Powell's hawkish tone. This has led to an interesting market reaction. We might see short-term growth in gold prices after a retest of the liquidity zone below $3,320.
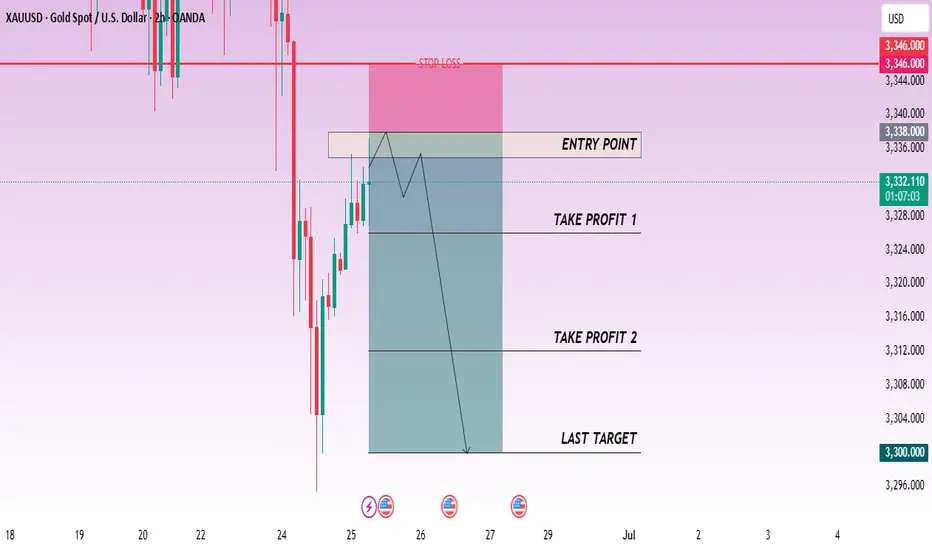
CHECK XAUUSD SIGNAL READ CAPTAINxauusd sell now ✅
entry point (2336) (3338)
TAKE PROFIT 1: (3326)
TAKE PROFIT 2: (3312)
LAST TARGET(3300)
STOP LOSS (3346)
Gold idea Gold looking for crt to play out on today’s market 🙏👊🏻🤩and wait for confirmation before entering
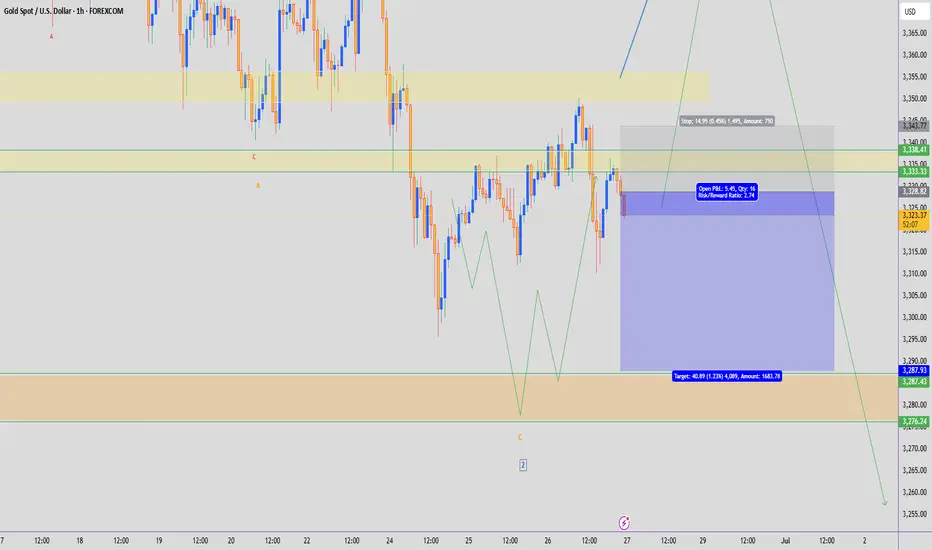
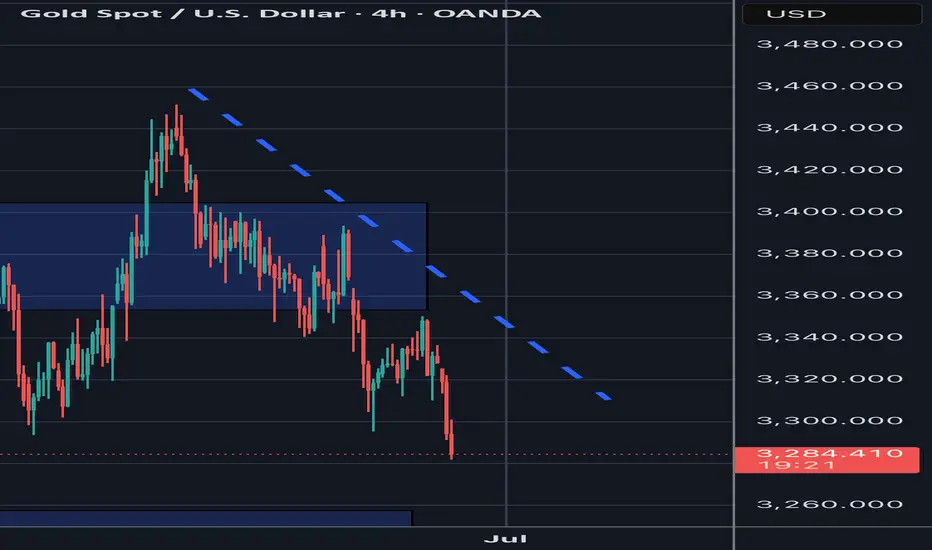
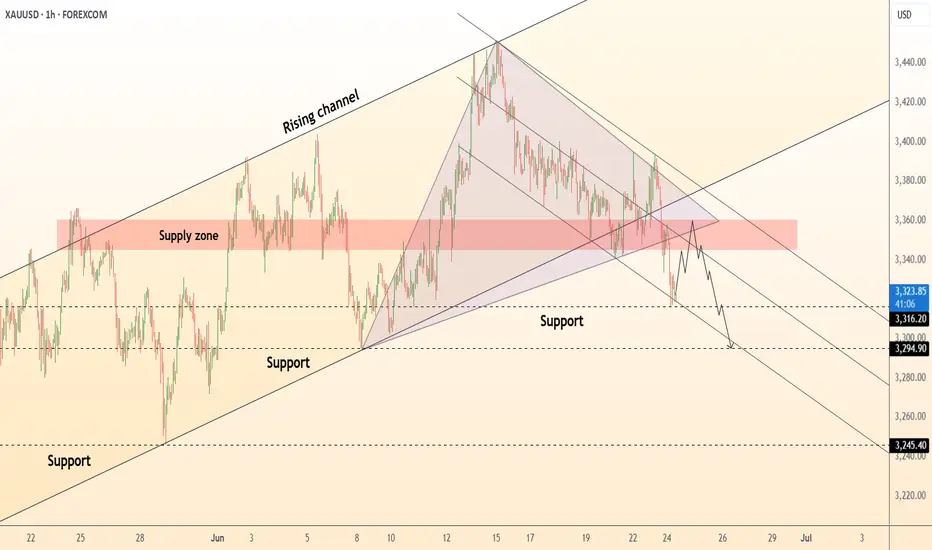
DeGRAM | GOLD dipped below the supply zone📊 Technical Analysis
● Price has broken the inner rising-trend support and is sliding inside a fresh descending channel; the current pull-back is stalling in the 3 350-3 365 supply zone, where the old trend-line and a June distribution block overlap, printing consecutive lower highs.
● The channel’s width and the purple flag just completed project to 3 295 support (May pivot + mid-channel); a close beneath it exposes the outer rail / March swing low around 3 245.
💡 Fundamental Analysis
● Hawkish Fed comments have pushed 2-yr yields back above 4.8 % and lifted the DXY, while CFTC figures show a third straight week of long liquidation, curbing bullion bids.
✨ Summary
Fade 3 345-3 360; sustained trade under 3 320 targets 3 295 ➜ 3 245. Short bias void on an H1 close above 3 365.
-------------------
Share your opinion in the comments and support the idea with a like. Thanks for your support!
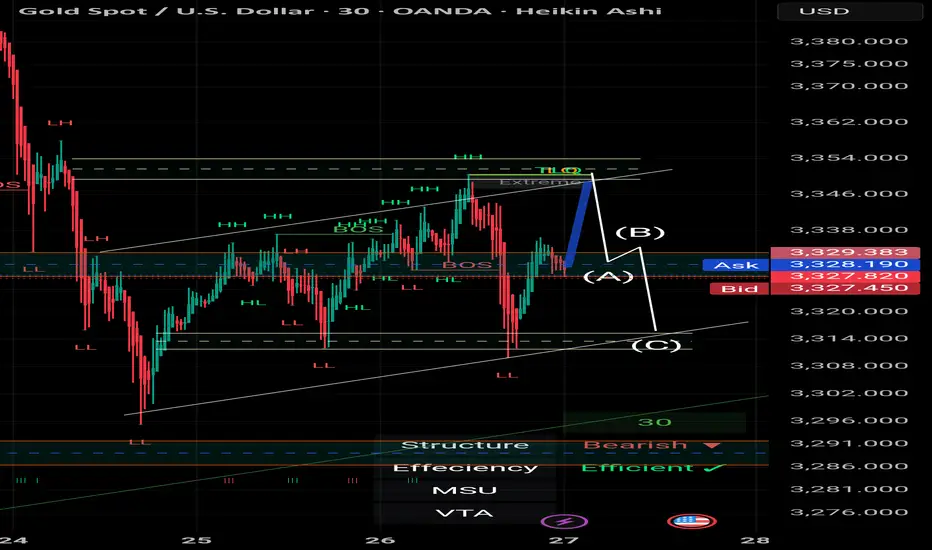
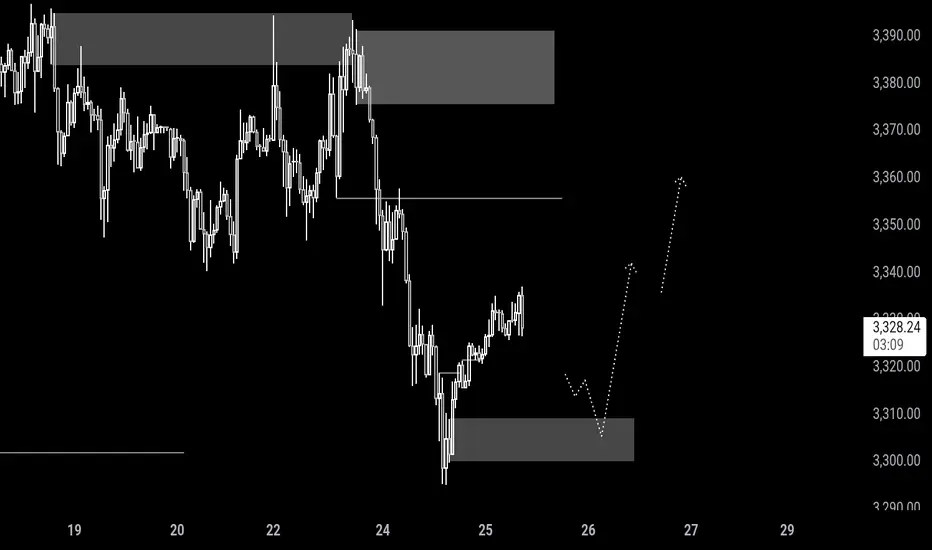
Scalping Strategy Using BOS & OB | Gold Spot | by Mohsen MozafarDescription:
> This is a 30-minute scalping setup on Gold Spot (XAU/USD), based on Smart Money Concepts (SMC) — focusing on Break of Structure (BOS) and Order Blocks (OB).
Analysis and strategy are prepared by Mohsen Mozafari Nejad.
---
📊 Market Context:
Current Structure: Bearish
Short-Term Market Structure: MSU (Market Structure Up)
Efficiency: Confirmed (clean price action & response zones)
---
🧠 Technical Highlights:
1. Double BOS confirms recent shifts in momentum
2. TLQ (Top Liquidity Quest) formed after HH (Higher High) and liquidity sweep
3. Key Demand OB identified (labeled A) — valid based on BOS confirmation
4. Expecting a bounce from OB (A) towards (B) as a reaction to unfilled imbalance
5. Potential drop from TLQ zone (B) to (C) if liquidity is fully absorbed
---
🎯 Scalping Plan:
Entry Zone:
Order Block at (A), waiting for CHoCH or bullish price action confirmation
(preferably on lower timeframe like M5)
Stop Loss:
Just below OB (around 3327)
Take Profits:
TP1: Near TLQ / Extreme zone (B)
TP2: Further liquidity grab or possible continuation above previous HH
---
❗ Alternative Bearish Scenario:
If price fails to hold at OB (A) and breaks below 3327 with BOS,
→ short opportunity opens toward new lows at 3314–3310 (labeled C).
---
✅ Summary:
This is a clean scalping setup following SMC principles:
BOS → OB → Liquidity → Reaction
Focus on structure, precision, and quick confirmation signals.
Prepared by:
📌 Mohsen Mozafari Nejad