APPLE A Fall Expected! SELL!
My dear friends,
My technical analysis for APPLE is below:
The market is trading on 211.18 pivot level.
Bias - Bearish
Technical Indicators: Both Super Trend & Pivot HL indicate a highly probableBearish continuation.
Target - 205.87
Recommended Stop Loss - 213.80
About Used Indicators:
A pivot point is a technical analysis indicator, or calculations, used to determine the overall trend of the market over different time frames.
Disclosure: I am part of Trade Nation's Influencer program and receive a monthly fee for using their TradingView charts in my analysis.
———————————
WISH YOU ALL LUCK
APC trade ideas
APPLE Lagging BehindApple remains a key component on my watchlist, having experienced a significant pullback amid recent market volatility driven by tariff-related macroeconomic tensions. A primary concern contributing to this weakness appears to be the company's delayed integration of AI technologies within its operating systems and hardware. There's a growing narrative among investors that Apple is beginning to resemble a legacy titan — respected but perhaps lagging behind in innovation.
That said, I believe Apple is actively developing AI capabilities behind the scenes, and any formal announcement or rollout could serve as a catalyst for a meaningful revaluation of the stock. Historically, Apple has demonstrated an ability to quietly build, then scale innovation at a massive level — and I suspect AI will be no different.
Interestingly, Apple has also exhibited characteristics of a defensive equity, often rallying even as broader global indices falter. This reinforces the notion that investors still view Apple as a relative safe haven. Given its valuation relative to long-term growth potential, Apple may be increasingly seen as an undervalued mega-cap poised for a strong rebound.
From a technical standpoint, we're beginning to see signs of accumulation, with buyers stepping in around key levels. The prior value area low around $211 has historically acted as a fair value zone. If price action successfully reclaims this level, auction market theory would imply a potential move back toward the upper end of the range — approximately $230 to $235.
Moreover, the current market structure is forming a constructive ascending pattern, with price pressing into higher zones. Should this structure hold and break through resistance, it could trigger accelerated upside momentum. This setup offers a compelling longer-term swing opportunity, particularly with clearly defined risk. The invalidation point lies just below the ascending trendline and the anchored VWAP from the lows — a key trend confirmation tool used to gauge average positioning of market participants.
All considered, this is a technically sound and fundamentally interesting level to consider an entry. Let’s see how this one unfolds.

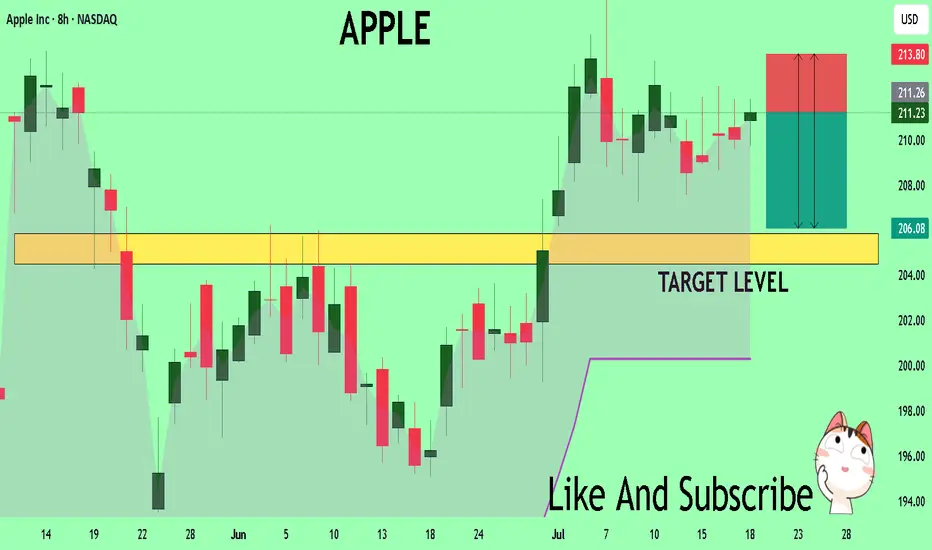
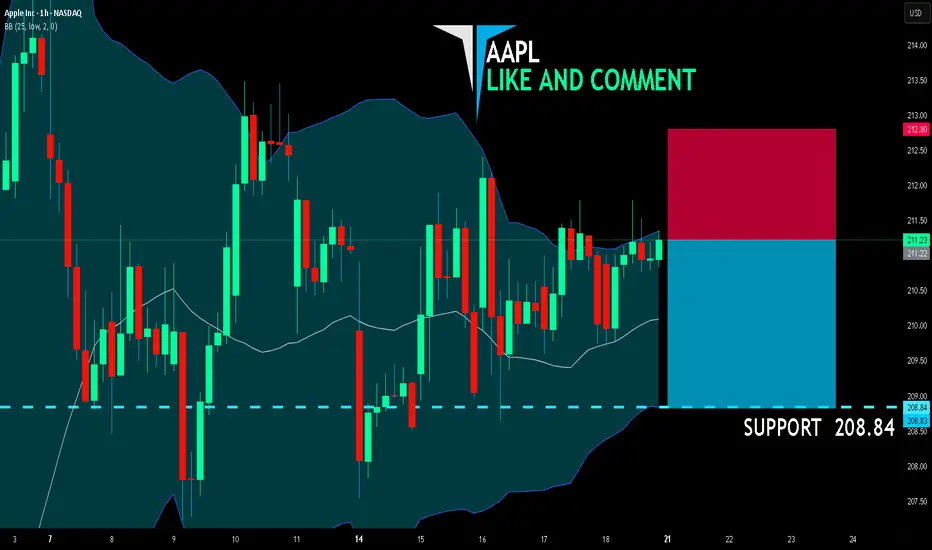
AAPL BEARS WILL DOMINATE THE MARKET|SHORT
AAPL SIGNAL
Trade Direction: short
Entry Level: 211.22
Target Level: 208.84
Stop Loss: 212.80
RISK PROFILE
Risk level: medium
Suggested risk: 1%
Timeframe: 1h
Disclosure: I am part of Trade Nation's Influencer program and receive a monthly fee for using their TradingView charts in my analysis.
✅LIKE AND COMMENT MY IDEAS✅
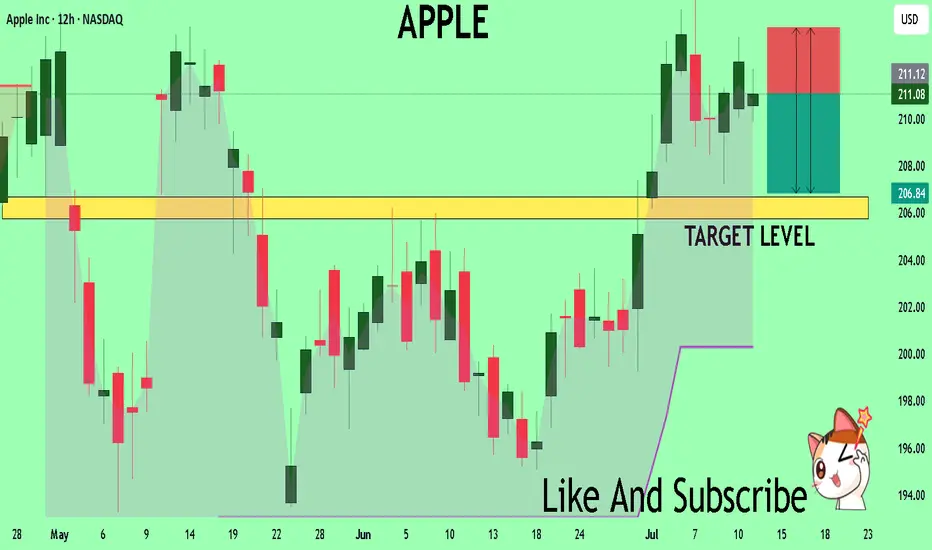
AAPL Set for a Breakout? | Technical Checklist & Projections
▍Observation & Context
▪ AAPL has been moving sideways within a clearly defined range for the past three months .
▪ On July 07 , price tested the range resistance decisively, showing some interest in the upside.
→ Let's first explore the bullish breakout scenario.
▍What Makes a Good Breakout ?
Before we talk about targets, let’s define what a good breakout looks like:
▪ A strong bullish candle breaking through the resistance in one clean move .
▪ Followed by a retest of the broken resistance (now acting as support).
▪ After that, price should ideally:
1. Form a higher low , and
2. Reach the next resistance or target zone before pulling back.
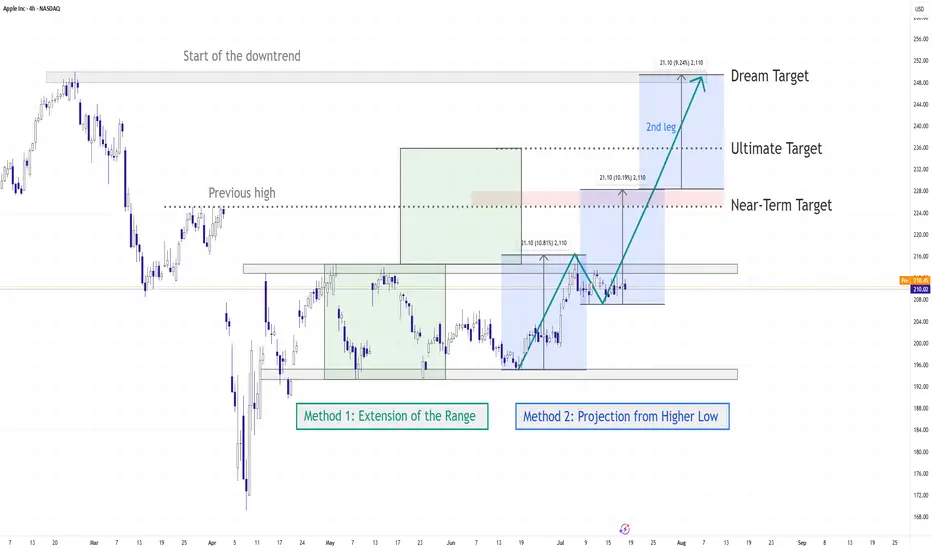
▍Target Price – Method 1: Extension of the Range
🔹 Near-Term Target: 1.5–1.618x Fibonacci Extension
- A common zone where momentum often pauses.
- Aligns with the previous high from the last downtrend.
- Technically, to reverse a trend, price needs to take out the previous high. Even though the range has “cooled off” the pressure, we still respect that level.
🔹 Ultimate Target: 2x Range Extension
- Represents a 100% projection of the previous range.
- Commonly used in range breakout targets.
🔹 Dream Target: 2.618x Fibonacci Extension
- Aligns with the start of the last downtrend , adding significance to the level.
- Often marks the exhaustion point of strong trends.
▍Target Price – Method 2: Projection from Higher Low
Note: The new higher low is not yet confirmed at the time of writing. The levels below assume an upward breakout without dropping below 207.22 . However, the same logic can be applied once the higher low forms.
🔹 Near-Term Target: Same as Method 1
🔹 Ultimate Target: 100% Projection of Prior Swing
- Projecting the prior swing (from previous low to recent high) from the new higher low .
- This level also aligns with the 1.5–1.618x Fibonacci extension of that swing, increasing its significance.
🔹 Dream Target: Another 100% projection
- Rare, but happens when momentum is very strong .
- In such cases, price might skip any retracement and launch directly into a second leg , equal to the previous swing.
- Here, the level aligns perfectly with the start of the last downtrend , just like the 2.618x extension in Method 1.
▋Mental Notes
▪ No one knows for sure if the breakout will be real or fake. But when it happens, knowing what to look for and where price might go next gives us a clear plan of action .
▪ The market will always find ways to surprise. Stay open and follow the flow.
▋Not Financial Advice
The information contained in this article is not intended as, and should not be understood as financial advice. You should take independent financial advice from a professional who is aware of the facts and circumstances of your individual situation.
Apple: Consolidation Before Potential Breakout Toward $260Apple shares have recently pulled back into a consolidation phase. We see further upside potential in magenta wave (B) before a pullback occurs as part of the same-colored wave (C), which is expected to target the low of green wave . After that, we anticipate a new upward move: Green wave should take over—remaining above support at $168—and drive the stock toward the next major resistance at $260.10. However, if the price drops back below the $168 support level, our alternative scenario comes into play: in that case, we would expect a lower low for blue wave alt.(IV), with a probability of 32%.
📈 Over 190 precise analyses, clear entry points, and defined Target Zones - that's what we do (for more: look to the right).

The Crypto Market Shaken by USDe Collapse – What’s Next for BtcIn early July 2025, the crypto market was rocked by the sudden destabilization of one of the fastest-growing stablecoins — USDe by Ethena. In just a few days, the token lost over 10% of its value, dropping to $0.88. This triggered a wave of liquidations across DeFi protocols and a sharp decline in major crypto assets like Bitcoin and Ethereum.
Why USDe Collapsed
The main cause of the collapse was a weak collateral model. Unlike USDT and USDC, USDe lacked full fiat backing. Its reserves were partially based on derivatives and complex hedging strategies. When a few large wallets began withdrawing liquidity, panic spread quickly. The rush to exit USDe overwhelmed the system, breaking the $1 peg.
This led to an accelerated loss of trust and triggered cascading liquidations across multiple DeFi platforms.
Impact on DeFi and the Broader Market
DeFi was hit hard. The total value locked (TVL) across major protocols like Aave, Curve, and MakerDAO dropped by 17% in one week. Some platforms halted USDe-related activity to contain losses.
Bitcoin fell below $58,000, and Ethereum dropped under $3,000, driven not only by lower liquidity but also by renewed skepticism from institutional investors. The volatility in what was perceived as a “safe” asset reignited debates around the future of algorithmic stablecoins.
What Happens Next?
The fallout from USDe is a major stress test for the entire DeFi ecosystem. If the team behind Ethena fails to restore trust, other algorithmic stablecoins could come under pressure. There are already growing calls for greater transparency, independent audits, and stricter collateralization rules.
On the flip side, many see this as a healthy correction — a purge of undercollateralized, risky experiments. The long-term winners could be robust, transparent protocols, and Bitcoin, with its capped supply and increasing institutional demand, may once again be seen as a flight-to-safety asset.
AAPL BULLISH WEDGEApple previously wedged, and broke out into the 213s. I previously tracked it but didn't enter. As of recent the volume has been thinning and the PA has been consolidating. I believe Apple has potential to breakout once again. The EMAs are also in more of a bullish stack. Hoping to hit somewhere in the 218-230. From a technical standpoint looks good but watch for general market sentiment and other tech stocks / QQQ as many have claimed they're due for a pullback and I agree. If they move Apple moves. Nfa
Stocks SPOT ACCOUNT: APPLE stocks Buy Trade with Take ProfitStocks SPOT ACCOUNT:
MARKETSCOM:APPLE stocks my buy trade with take profit.
This is my SPOT Accounts for Stocks Portfolio.
Trade shows my Buying and Take Profit Level.
Spot account doesn't need SL because its stocks buying account.
Looks good Trade.
Disclaimer: only idea, not advice

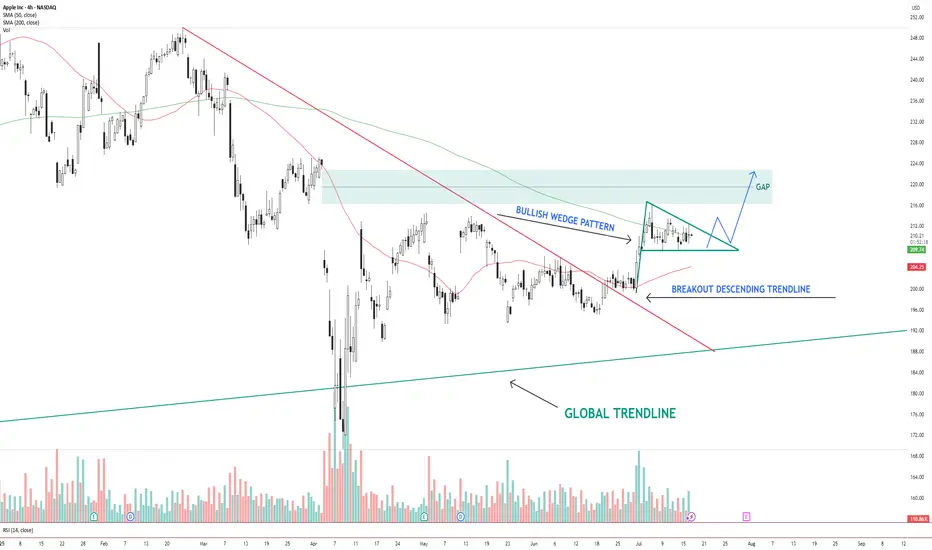
AAPL – Bullish Wedge Breakout Setup Toward Gap FillAAPL NASDAQ:AAPL has broken out of a descending trendline and is now consolidating inside a bullish wedge pattern . Price is holding above the 200 SMA and hovering near the 50 SMA.
The structure suggests a potential breakout above the wedge, with a clear gap area between $216–$224 acting as the next upside target.
Key levels:
Support: $206 (wedge base / 50 SMA)
Resistance: $216–$224 (gap zone)
Trend structure: Bullish consolidation after breakout
A clean breakout from the wedge with volume could trigger a continuation move toward the gap zone.
📌 Watching for confirmation and potential entry on a breakout + retest.
This is not financial advice. Always do your own research.
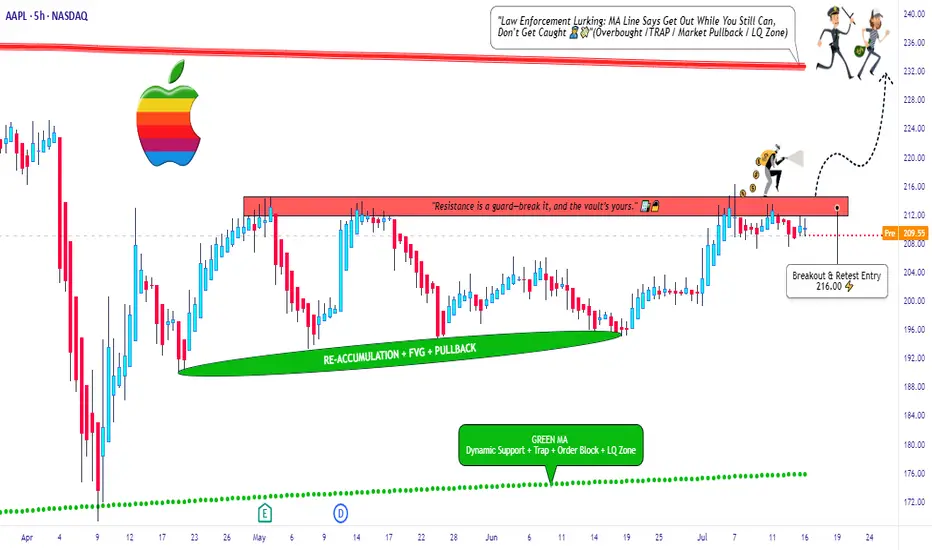
Apple Inc Long Setup – Break, Ride, Exit Like a Pro🕵️♂️💼 “The Apple Heist: Thief Trader's Masterplan for a Clean Escape” 💸🚀
🌟 Hi! Hola! Ola! Bonjour! Hallo! Marhaba! 🌟
Welcome, Money Makers & Market Thieves! 🤑💰💸✈️
This ain’t your average stock analysis — this is a high-level blueprint for the Apple Inc. (AAPL) market heist, built using the Thief Trading Style 🔥📊.
We've scouted the field using a mix of technical patterns, market sentiment, and fundamental fuel, and we’re ready to make our move. The plan is set: go long once the resistance wall cracks, and aim for a clean getaway just before the danger zone hits.
🎯 THE PLAN: INFILTRATE, ESCAPE, PROFIT
Entry Point:
💥 “The vault’s cracking – the breakout begins at 216.00!”
Place Buy Stop orders just above the resistance wall or wait for a pullback to recent swing zones (15M–30M charts work best).
📌 Set your alerts early – you don’t want to miss the opening.
🛑 STOP LOSS - YOUR BACKUP PLAN
🔊 “Listen up, crew: No stop loss until the breakout confirms! Once you’re in, place SL wisely – use the 4H swing low (200.00). Your risk, your rules. Don't get caught slippin’.”
📍 Adjust SL based on lot size, entry volume, and trade size. Protect your stash.
🏁 TARGET ZONE:
🎯 Heist Target = 232.00
(Or bail early if the heat's on – you know the drill.)
⚠️ SCALPERS & SWINGERS
💸 Long side only – don’t fight the wave.
🧲 Scalpers: Get in, grab the cash, trail the stop.
📈 Swing Traders: Hold firm. This setup has legs.
🔎 WHY WE’RE ROBBING THIS CHART:
Apple’s bullish momentum is fueled by:
📌 Strong institutional sentiment
📌 Earnings strength
📌 Index rotation and positioning
📌 COT data & macro tailwinds
Get the full scope: fundamentals, macro outlook, positioning data, sentiment, and intermarket dynamics 🔗📊.
Stay sharp – stay informed.
📰 NEWS ALERTS & POSITION MANAGEMENT
🚨 Avoid new entries during high-impact news releases.
🏃 Use trailing SLs to lock profits and exit clean.
💖 BOOST THE CREW — STRENGTH IN NUMBERS
🚀 Hit that BOOST button if this helped you steal a profitable trade. Your support powers our heist team.
Let’s keep making money the Thief Way – with style, planning, and confidence. 🎉💪🏆
📌 NOTE FROM HQ:
This analysis is for educational purposes. It’s not personalized financial advice. Manage your trades responsibly. Conditions can shift quickly — stay updated and flexible. Stay in the shadows and move smart. 🐱👤
💬 Drop a comment, hit like, share with your gang – the market's a vault, and we’re the codebreakers.
See you on the next heist, Thief Fam. 🤑🔥🕶️💼
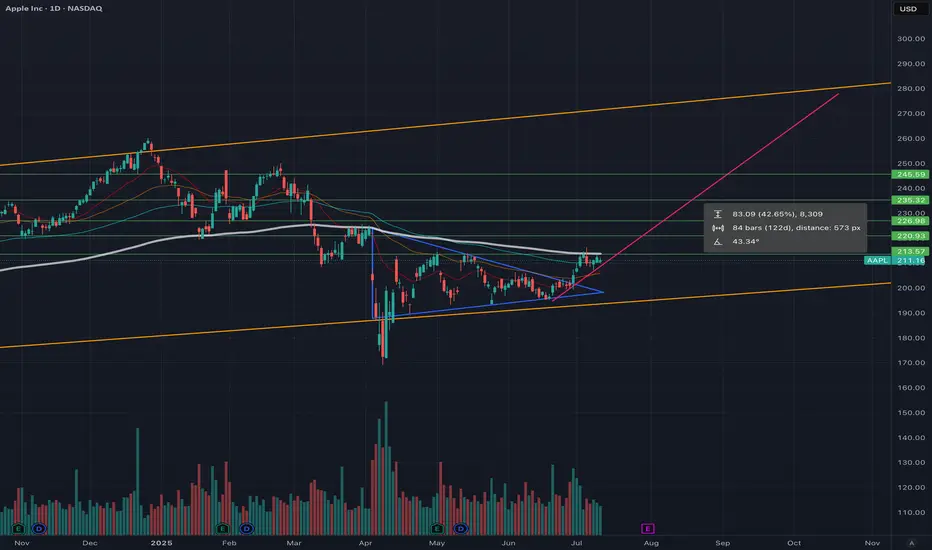
Time to buy? Too much negative press. Buy in Fear- Updated 13/7Apple has faced prolonged downward pressure from bearish investors. Despite its best efforts and some dips, the stock has steadily maintained a baseline price of 200 USD. The flag pattern required some adjustments along its path to break out, primarily due to geopolitical issues and economic variables. Ultimately, Apple broke out to the upside in the week of June 30th, as predicted in my earlier posts. This breakout resulted from end-of-Q2/H1 sell pressure, delivering a 7.56% gain or 15 USD. This is a very bullish sign for Apple, and with the tailwinds forming for September product releases, we can expect further gains as traders return and volume increases.
If Apple follows its historical profit trajectory (see pink line), we could see a new all-time high (ATH) in the region of 270 USD in September. The green resistance and support levels are highlighted, and I may use these to adjust my position, considering whether to short or go long once confirmation is established on the daily timeframe.
Apple has significantly underperformed compared to the other Magnificent 7 stocks, but I don’t believe it’s a company you should bet against in the current climate. With a slow rollout of AI and recent statements from Apple, they may not always be first to market, but they generally execute well. The remarks regarding Sony, Samsung, and Netflix by Apple were very revealing and demonstrate a solid long-term strategy. However, there may be some bumps along the way as they work toward their goals, potentially involving acquisitions.
The fear spread in the media is similar to the FUD (fear, uncertainty, doubt) often associated with Bitcoin, and this is typically a good time to buy. Remember the saying: if retail investors miss the boat, it’s gone, but if institutions miss it, they often bring the boat back.
While this is not financial advice, based on the green weekly candle, it's hard not to pay attention, and Apple may now have a very positive year ahead! Especially with the weakening dollar and reports stating that this will benefit them greatly.
Apple has continued to trend along its predicted trajectory, and with the exception of economic headwinds driving the price down, this trend is expected to continue. Strong support has been observed at 210 USD, with further support at $208.50, providing solid technical support for potential upside while reducing the risk of a downturn below $208. However, a short correction could occur if overall market confidence is shaken due to new policies. Nevertheless, Apple has demonstrated resilience to new tariffs, and its underperformance compared to other tech giants indicates plenty of upside potential. The target price remains set at over $260.
My large long position is still intact, and my target price will depend on how we manage supports and resistances. I am looking to take profits at over 260 USD.
AAPL PREPARING FOR A LARGER MOVEAAPL clearly shows a descending channel pattern, marked by two parallel downward-sloping yellow trendlines. Within that broader structure, the price is currently consolidating in a narrow range between two horizontal yellow lines:
Resistance around $210.98
Support around $207.46
🔍 Current Technical Setup
Consolidation Range
AAPL is moving sideways in a tight range between $207.46 and $210.98. This narrow trading zone within a broader descending channel is typical of compression before a breakout.
Descending Channel Context
The channel suggests a longer-term downtrend bias, but the compression at these levels can lead to a breakout in either direction, especially when volume starts to increase.
Support Zone ($207.46)
This level has been tested and held, making it a key line to watch. A breakdown below this support would likely trigger a sharper selloff toward the lower channel boundary, near $203–$204.
Resistance Zone ($210.98)
This level lines up with the upper boundary of the current consolidation and the midline of the descending channel. A breakout above would invalidate the local downtrend and could send price to test the top of the channel (~$214+).
Volume Clues
Volume is relatively low during this sideways movement, which often precedes a high-volume breakout as indecision resolves.
📈 Scenarios to Watch
Bullish Breakout
Above $210.98 and the descending trendline.
Likely target: $214–$216
Confirmation: Volume spike + strong bullish candle
Bearish Breakdown
Below $207.46 support.
Target: $203 or lower, testing channel support.
Confirmation: Increasing red volume + bearish momentum
🧠 Summary
AAPL is in a compressed state, with a tight horizontal range forming inside a broader downward-sloping channel. This often sets the stage for a powerful directional move. Traders should closely monitor breaks of $210.98 or $207.46 to catch the next leg — either a reversal toward higher levels or continuation of the downtrend.

APPLE Set To Fall! SELL!
My dear friends,
APPLE looks like it will make a good move, and here are the details:
The market is trading on 211.08 pivot level.
Bias - Bearish
Technical Indicators: Supper Trend generates a clear short signal while Pivot Point HL is currently determining the overall Bearish trend of the market.
Goal - 206.69
Recommended Stop Loss - 213.91
About Used Indicators:
Pivot points are a great way to identify areas of support and resistance, but they work best when combined with other kinds of technical analysis
Disclosure: I am part of Trade Nation's Influencer program and receive a monthly fee for using their TradingView charts in my analysis.
———————————
WISH YOU ALL LUCK
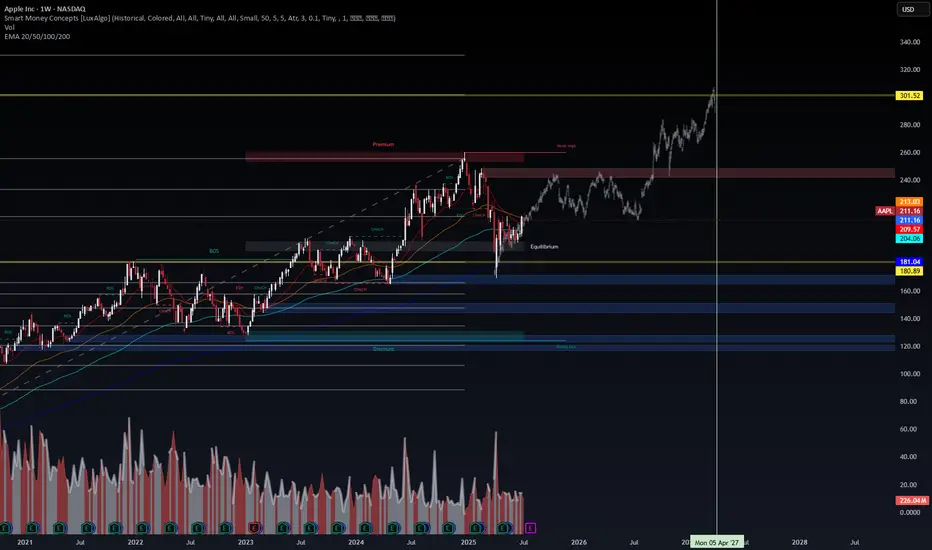
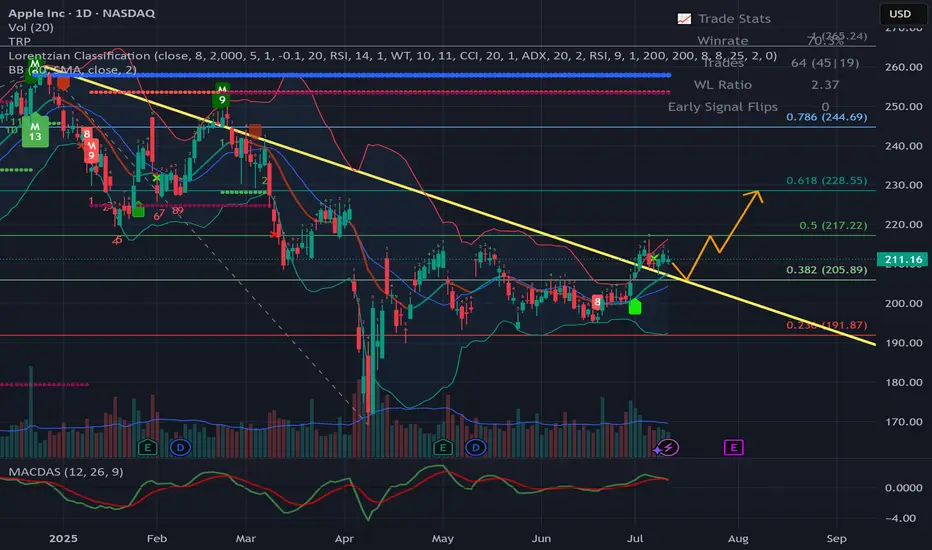
$AAPL | Smart Money Concepts Weekly DSS Update Apple ( NASDAQ:AAPL ) is approaching a critical decision zone on the weekly SMC structure, where liquidity, volume, and macro pressure converge.
🔎 Key Observations (WaverVanir DSS):
🔺 Premium Zone (240–260) acting as a weak high with multiple CHoCH & BOS confirmations
🔻 Major equilibrium level at ~$181 aligns with EMA 200 & potential downside sweep
📈 Projected upside target: $301.52, contingent on reclaiming premium zone
📉 Breakdown watch: If $211 fails, next liquidity pockets sit between $181 and $120
⚙️ Volume Profile shows divergence—price rally on declining volume = possible distribution pattern.
🌐 Catalysts to Monitor:
Q3 earnings (E icon on chart)
China iPhone demand
US macro (Fed policy, CPI, yield curve shifts)
🧠 DSS Probability Bias:
Neutral to Slight Bullish (17/25 score)
→ Expect volatility with directional bias forming post-premium test.
📊 Trade Management:
Wait for confirmation above $260 for continuation
Or short-term bearish setups if price stalls below EMA cluster (~$213)
🧠 Posted by WaverVanir DSS | Quant x Macro x Liquidity Driven
#AAPL #SmartMoney #TradingView #MarketStructure #VolumeProfile #LiquidityZones #QuantAnalysis #WaverVanir #AppleStock #MacroTrading #OptionsFlow #TradingSignals #RiskManagement
Crypto in July 2025: A Financial Reset from Macromics GroupThe world of cryptocurrencies in July 2025 is experiencing more than just another growth cycle — it’s undergoing a fundamental transformation of the global financial system. Amid geopolitical instability, tighter control over digital assets, and growing interest from institutional investors, digital currencies are once again in the spotlight. Macromics Group shares its latest analytical insights on the key events and trends.
A New Bull Run: Ethereum 3.0 and Bitcoin Network Upgrade
Since the start of summer 2025, Ethereum has shown strong growth, largely due to the launch of Ethereum 3.0, which reduced transaction fees and made the network more scalable. Bitcoin, in turn, has undergone another major security upgrade, attracting new institutional investors, including funds from Japan and Saudi Arabia.
CBDCs and Regulation: Governments Shift Approach
Central banks are actively rolling out central bank digital currencies (CBDCs). China, India, Brazil, and the EU have expanded pilot programs for their national digital currencies. This has led to increased interest in stablecoins backed by fiat currencies and greater demands for transparency on DeFi platforms.
Macromics Group helps clients navigate these new dynamics, offering up-to-date analytical resources and capital protection strategies across both regulated and unregulated sectors of the crypto market.
NFTs Make a Comeback — In the Corporate World
A new wave of interest in NFTs is emerging, not from artists, but from the corporate sector. Companies are using tokens for intellectual property, document verification, and digital rights management. Macromics Group is investing in startups building infrastructure for business-focused NFTs — a clear sign of the technology’s long-term potential.
AI + Blockchain: A Union of Future Technologies
In 2025, two mega-trends are converging: artificial intelligence and blockchain. AI-powered protocols are automating trading, cybersecurity, and even smart contract audits. Macromics Group is already implementing these technologies into its analytical tools and services.
What’s Next? Macromics Group Forecast
According to our data, the crypto market has entered a phase of "conscious growth" — where technology, regulation, and real-world utility are evolving in harmony. In the coming months, we anticipate increased attention toward:
DePIN projects (decentralized physical infrastructure)
Tokenized real-world assets (real estate, gold)
ESG-focused cryptocurrencies
Conclusion: Don’t Just Invest — Understand
Macromics Group urges investors to go beyond participation — to become informed decision-makers. We provide deep analytics, access to unique tools, and expert support at every stage of crypto investing. July 2025 is the perfect time to rethink your strategy and take a step into the future.
Macromics Group — your expert in the world of digital assets.
AAPL - Another Possible BreakoutsHello Everyone,
Apple AAPL is the another possible breakouts in my list.
Good entry point could be 205-206 , Re-test point.
228-230 is target price for me , which is approx %10 above from 205-206.
I tried to draw possible price action on Graphs.
Same as I mentioned in GOOG , Apple is Apple and you can get it in every price point for long term.
But short term you can watch the these price points that i mentioned to get some gain.
This is just my thinking and it is not invesment suggestion , please do not make any decision with my anaylsis.
Have a lovely Sunday and good start a Week
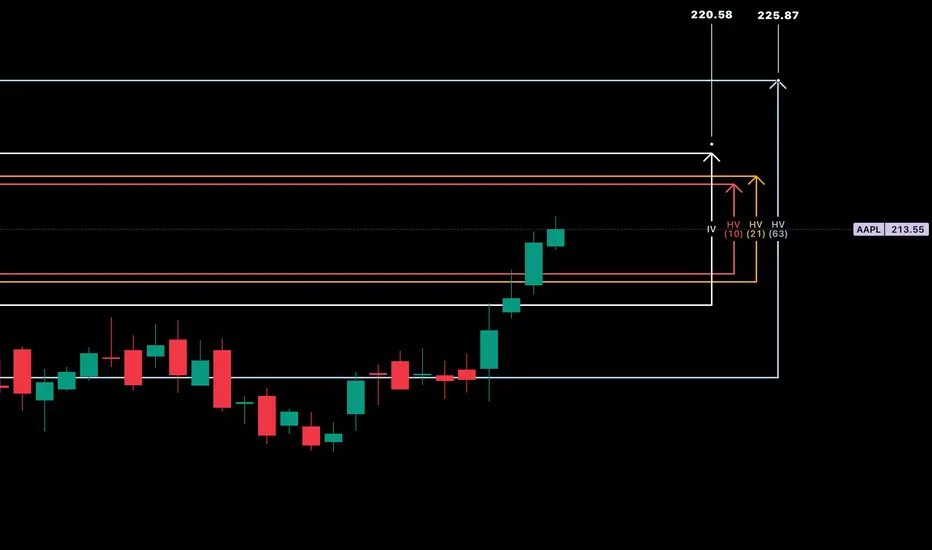
AAPL - Weekly HV/IV PerspectiveGood evening —
I wanted to do one more write up with that being on NASDAQ:AAPL as we enter the week with futures just opening.
HV10 (16.58%) is trending -11.56% below IV (28.14%) showing a weekly price gap differential of -$2.89 on the stated implied move to what trending markets are doing. This current IV value entering the week sits 69% within the sliding year spectrum.
Now, with Apple consolidating in range for almost eight weeks after selling off when it reached its 4T milestone in December of 2024, has now begun advancing back upwards in price. The strength here is obvious and the quality of company is well, Apple.
My price targets on the week is first the upper band of stated IV ($220.58) then moving on towards the upper implied range of HV63 ($225.87). I believe the markets are going to push apple higher while balancing the indices out selling off in other areas. This would start to accelerate HV10, as it is now 91.23% coiled to its yearly lows and needs to unwind. Hopefully with a few short-term trending days increasing we find our regression.
Please come back next week and see how our position and volatility progressed forward.
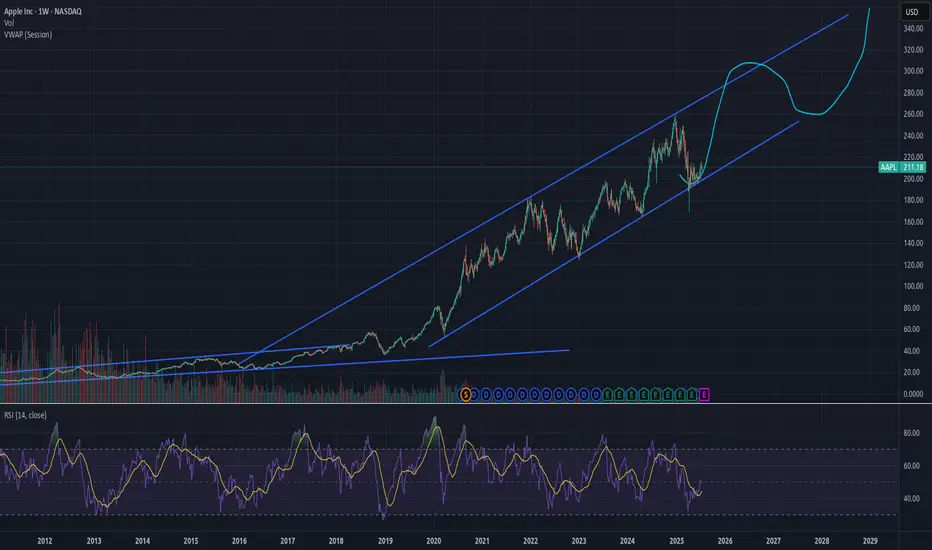
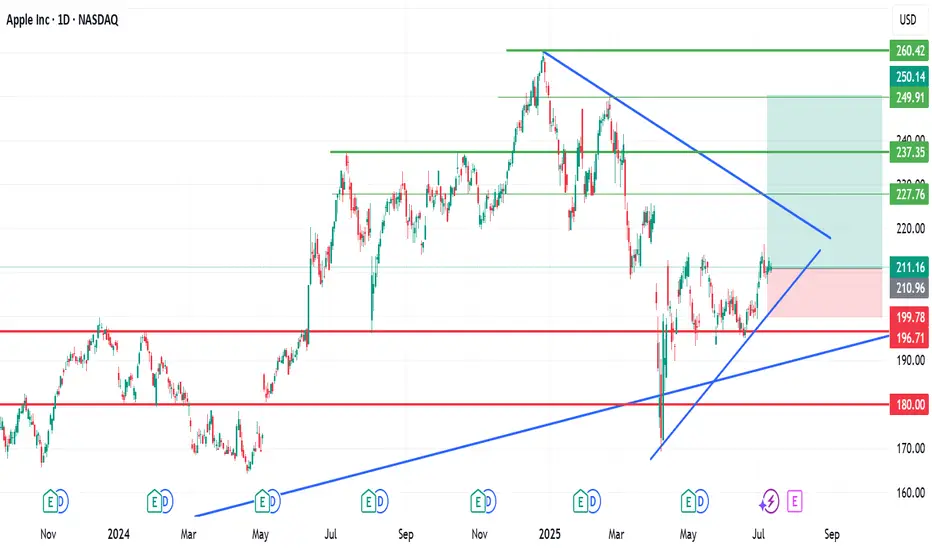
I am bullish on Apple (AAPL)I am bullish on Apple (AAPL)
Looking at my cahrt, you will seen my thoughts.
$237, $237 and $260 are my medium and long-term buy targets.
Trade with care as pullbacks are possible along the journey nortward.
Like, follow, share and comment
$AAPL: Breaking Down Broader Cycle via FibsPublishing separately a specific interconnection type mentioned in idea below:
Testing this particular way of mapping the multi-scale cycles:

Ethereum Empowers Its Future Zero-Knowledge TechnologyThe Ethereum $2,969 Foundation has unveiled a new roadmap that aims to expand zero-knowledge (ZK) technologies across the network shortly after the ETH price surpassed the $3,000 threshold. This announcement aims to enhance scalability while concurrently reducing transaction fees and bolstering both security and privacy. The foundation has emphasized integrating ZK-based solutions into the primary layer to accelerate the user experience. This development marks a critical period that may prompt Layer 2 projects and entrepreneurs within the ecosystem to reconsider their competitive strategies.
Key Objectives of the Announced Zero-Knowledge Roadmap
Today, the Ethereum Foundation announced through its official channels that the primary goal is to institutionalize the “ZK-based verification” model at every network point. The plan envisions directing energy from intensive smart contracts towards more efficient cryptographic proofs to reduce transaction congestion. This approach aims to make the network accessible to larger audiences with lower-cost and faster approval processes.
The second focal point is to deepen the security layer. A foundation executive stated, “By integrating ZK technology into our network, we are not only enhancing privacy and security but also achieving significant improvements in transaction efficiency.” The objective is to establish a privacy standard rather than just performance. Within this framework, new technical collaborations and developer grants will be highlighted, with the priority being to develop toolsets and training programs that accelerate integration.
Potential Impacts of the Roadmap on the Layer-2 Ecosystem
The new roadmap closely concerns Layer 2 projects, which have long provided scalability with ZK Rollup solutions. Experts emphasize that local ZK integration could narrow the competition advantage of these projects but also lay the groundwork for stronger collaborations. Initiatives may need to update their architectural plans to reinforce compatibility with the main network.
As relevant actors seek different models to cover compliance costs, an environment is emerging that will open doors to new partnerships and grants. This process, paralleling Ethereum’s scalability goal, may direct the developer community within the network towards ZK-centered innovation. On the market side, the interest in ETH seems to be supported by expectations of increased security and privacy.

AAPL: The Rally Might Not Be OverWhile many tech giants have already reached new all-time highs, Apple is still lagging behind — NASDAQ:AAPL hasn’t yet broken out. This may represent both a risk and an opportunity for latecomers.
Investor caution remains due to potential tariffs on Apple products from China, with the decision now postponed until August.
This uncertainty may be holding the price back, but could also lead to a strong accumulation phase if no negative headlines emerge in the near term.
Technicals:
• A breakout above $215 could open the way toward $249 (previous high).
• Support at $197 remains strong.
• Stochastic is in overbought, but MACD confirms bullish momentum.
NASDAQ:AAPL may start catching up with the broader market — especially if tariff fears subside. Watch closely for a confirmed breakout above $215.

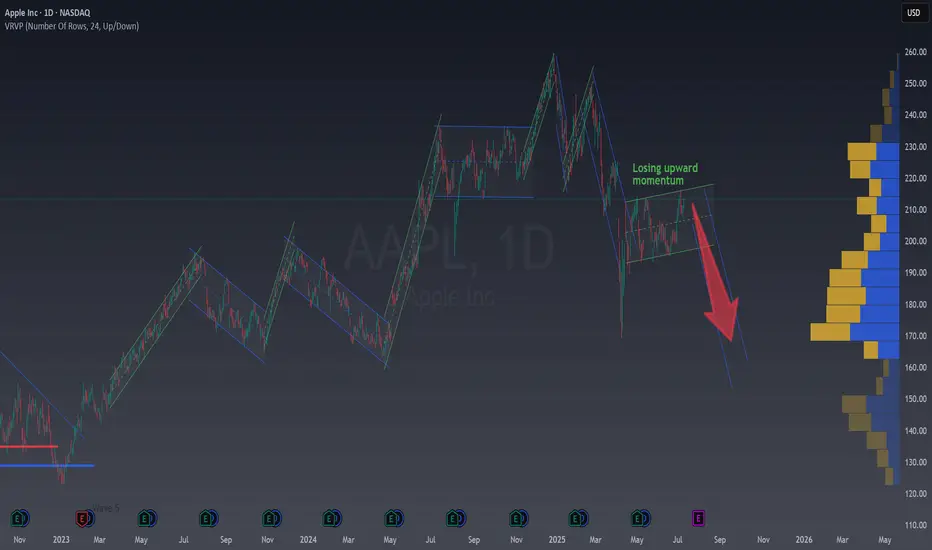
Apple in 2025: Why the Bulls Are Losing SteamApple’s stock has clearly lost its bullish momentum this year, and the chart you shared sums it up perfectly.
Let’s break down what’s happening and why investors are shifting focus to companies like Nvidia and Microsoft.
Chart Says :
Weak Rebounds (green), Bearish Pressure (blue channels are now more agresive)
Downtrend Channels: The chart shows Apple forming lower highs and lower lows, bouncing inside downward channels (not real channels, but are very ilustrative of how the price is moving trendy or not in each direction).
Each recovery (green) is weaker than the last, and the most recent upward move is still capped by resistance.
Bearish Patterns : The price action is dominated by failed breakouts and new descending channels, signaling that sellers are in control.
Volume & Participation: There’s no strong buying volume to support a real reversal. This makes any rally fragile and prone to quick pullbacks.
Why Is the Market Doubting Apple?
Slowing Growth : Apple’s revenue growth has stalled, especially in China, where sales dropped 13% year-over-year. The latest iPhone launch was underwhelming, and services aren't growing fast enough to offset weak hardware sales.
Falling Behind in AI: While Nvidia and Microsoft are leading the AI revolution, Apple is seen as late to the party. Their recent AI announcements disappointed investors looking for bold innovation.
External Pressures: New tariffs and global tensions are hitting Apple harder than its peers, since more than 60% of its sales are international.
Analyst Downgrades: Several analysts have lowered their price targets and ratings, reflecting concerns about Apple’s future growth. We've recently seen someanalyst showing prices under $200.
Key Takeaway
Apple is struggling to regain its former strength. The chart shows persistent bearishness, and the fundamentals back it up: slow growth, weak innovation, and external risks. Meanwhile, Nvidia and Microsoft are capturing investor attention with explosive growth and leadership in AI.
Until Apple delivers a real catalyst, the path of least resistance remains down or sideways, not up.
Do you think apple can surprise with some new AI innovation unexpected for all of us?