Monthly Chart:
In the monthly chart, the barrier at 161.15 is below the first support area (210-220).
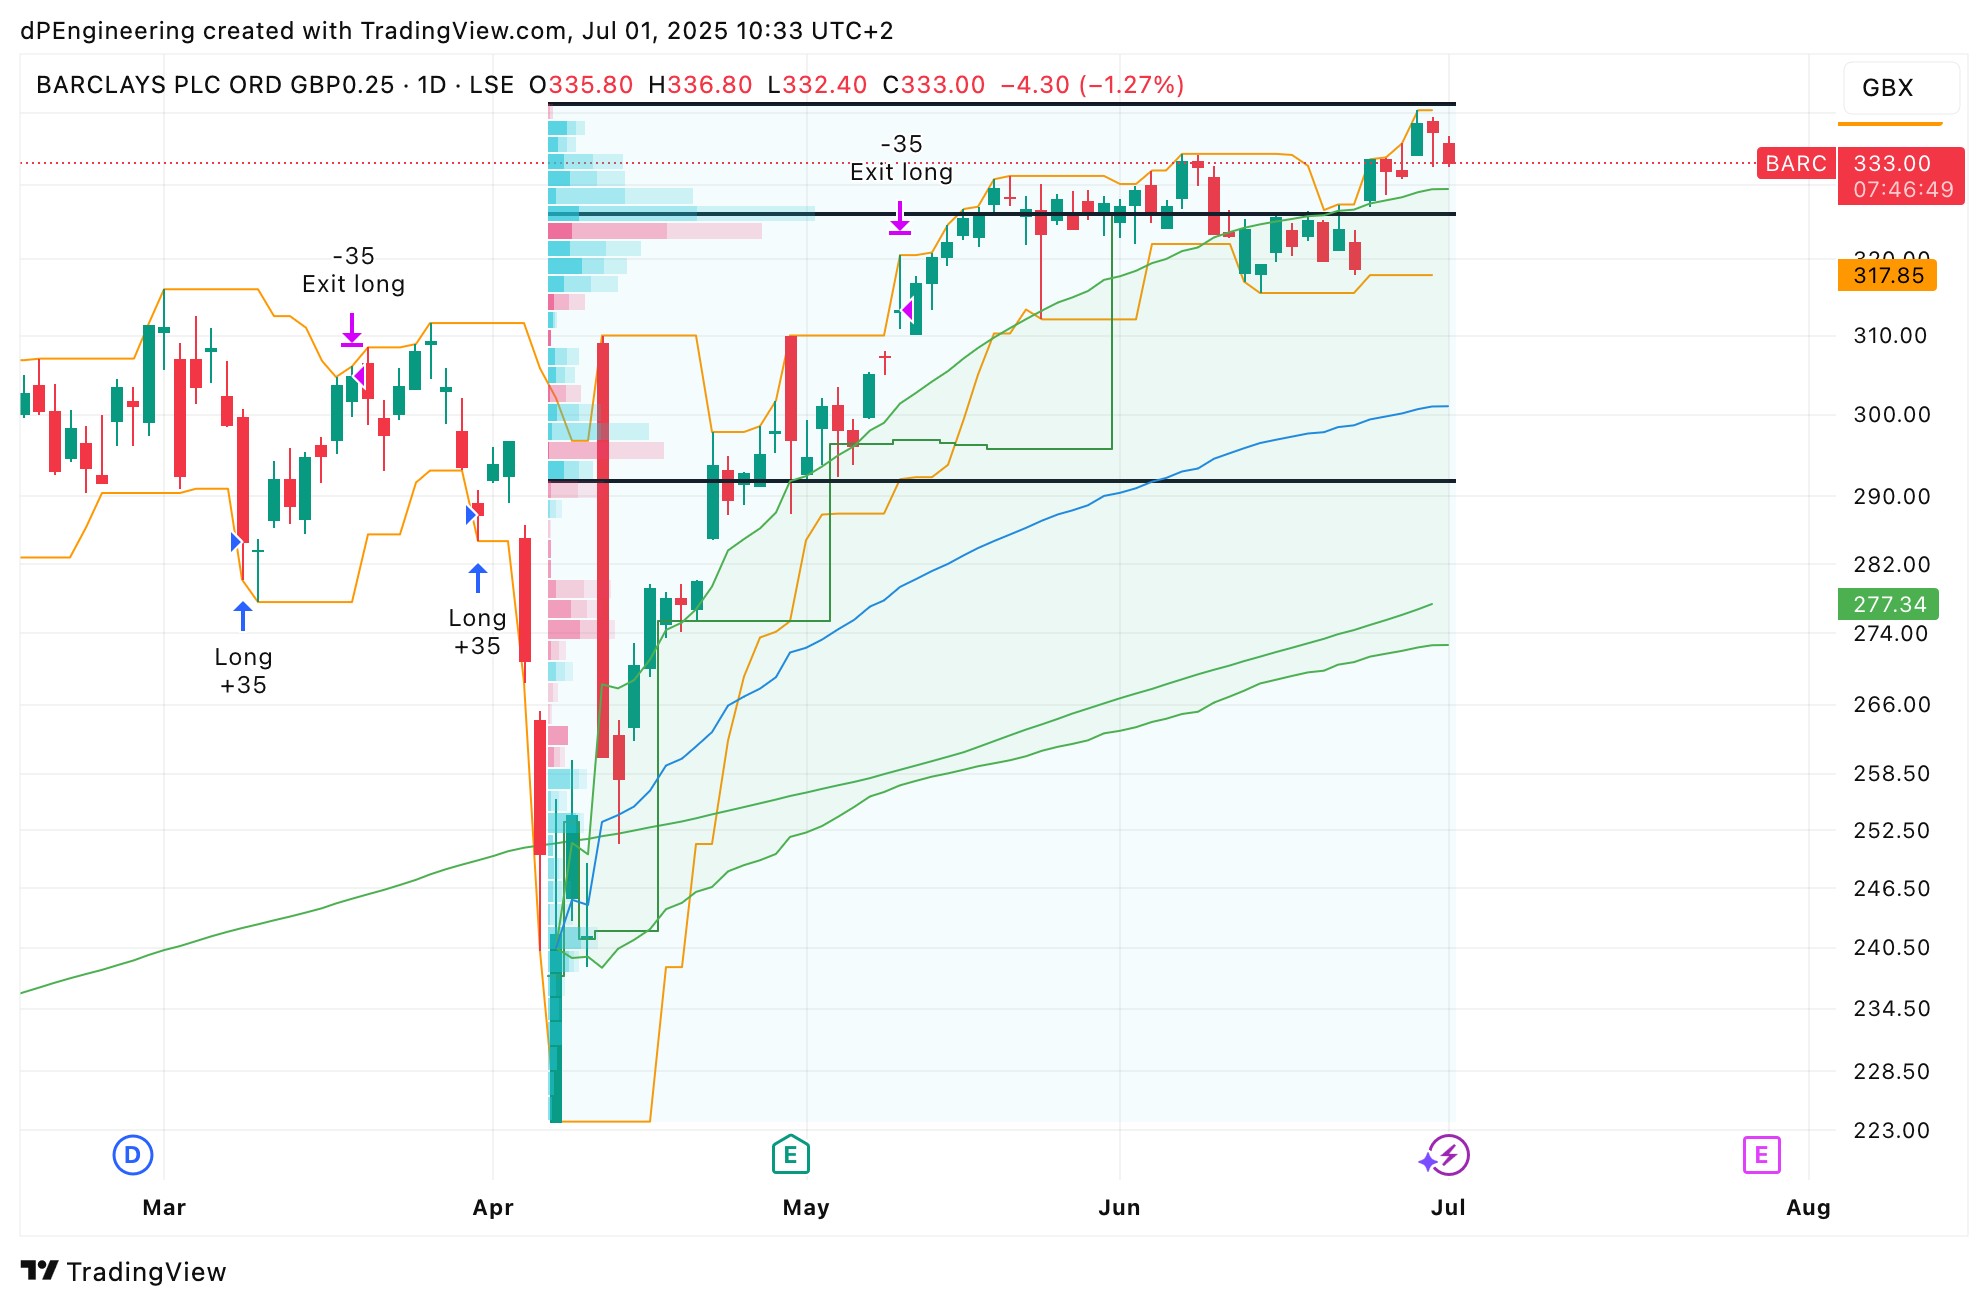
Daily Chart:
The WAP is anchored on the last low (April 2025). The price is located in the upper part of the WAP, approximately at one time the standard deviation. Throughout the "anchoring" period, the price has been between one and two times the standard deviation.
The nearest resistance is at 341.