NVDA Nvidia Among My Top 10 Picks for 2025 | Price TargetIf you haven`t bought the recent dip on NVDA:
My price target for NVDA in 2025 is $170, driven by the following fundamental factors:
Dominance in AI and Data Center Markets:
NVIDIA is a leader in the artificial intelligence (AI) and data center sectors, which are expected to experience exponential growth. The company's GPUs are critical for AI applications, and its data center revenue has surged dramatically, reaching $14.51 billion in Q3 2023—a threefold increase year-over-year. Analysts predict that NVIDIA's revenue could reach approximately $111.3 billion in 2025, driven by the relentless demand for AI technologies and the expansion of data center capabilities.
Innovative Product Pipeline:
The upcoming introduction of NVIDIA's Blackwell architecture is set to enhance its competitive edge further. This new line of chips is designed to deliver unprecedented performance levels for AI applications, solidifying NVIDIA's leadership in the sector. The anticipated demand for these advanced products is expected to bolster revenue and profitability significantly. Additionally, NVIDIA's continuous investment in research and development ensures that it remains at the forefront of technological advancements.
Strong Financial Performance and Market Sentiment:
NVIDIA has demonstrated robust financial health, with gross margins consistently above 70% and earnings per share (EPS) forecasts reflecting strong growth. The company has also engaged in substantial share repurchase programs, returning value to shareholders while signaling confidence in its future performance. Market sentiment remains overwhelmingly positive, with analysts frequently upgrading their price targets based on NVIDIA's strong fundamentals and growth trajectory.
NVD trade ideas

NVDANVDA is likely to undergo a long term retracement after showing signs of momentum shift in the weekly chart.
Its likely to di 60%, potential forming a shark harmonic pastern.
It currently has a strong RSI bearish divergence.

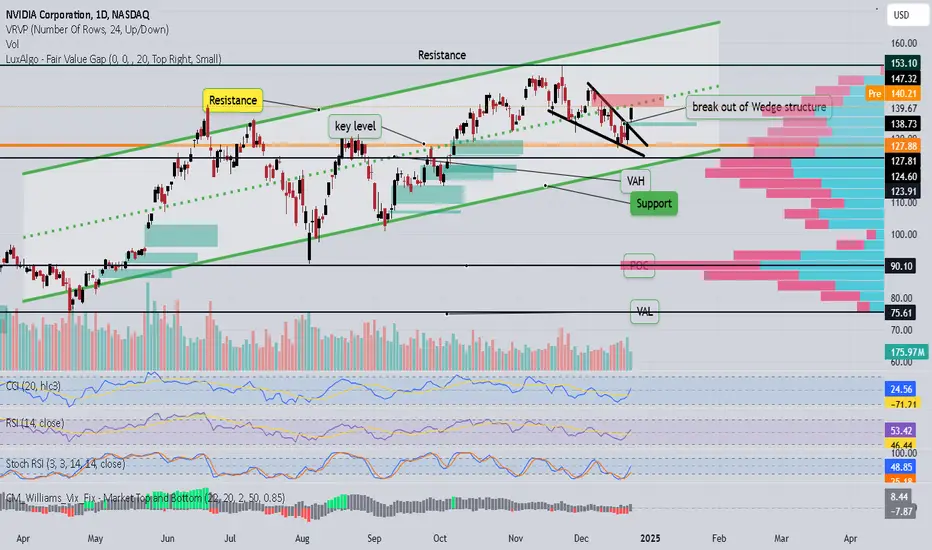
Is the break out enough?The asset has appeared to break out of the Wedge like structure with two bullish Heiken Ashi candles. Will this be enough to carry it to the 150.00$ price range, I do not know? but kindly comment below

NVDA 2027 130C LeapsGave yall these leaps step by step now up 20% already!
I plan to HOLD long term Fibonacci Targets 150 160
DROP a like for more of my setups!

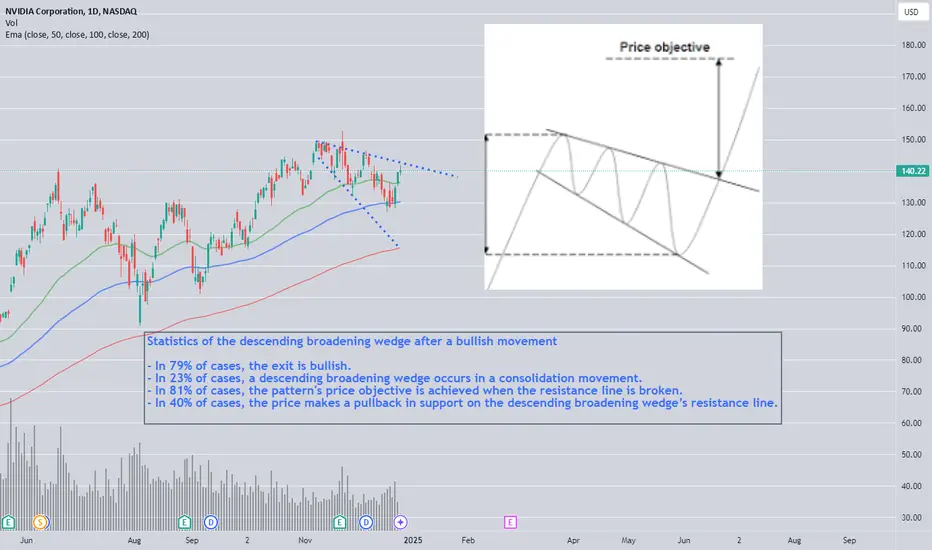
Bullish pattern on NVDAThe stocks is placing a bullish pattern
Descending broadening wedge
CASE 1: formation of a descending broadening wedge after a trough
This type of pattern appears on the troughs, it is a bullish reversal pattern.
The break in the resistance line definitively validates the pattern.
The price objective is determined by the highest point at which the descending broadening wedge was formed.
NB: often, the steeper the descending broadening wedge’s trend lines, the faster the price objective is reached.
Statistics of the descending broadening wedge after a bullish movement
In 80% of cases, the exit is bullish.
In 75% of cases, a descending broadening wedge is a reversal pattern.
In 60% of cases, a descending broadening wedge’s price objective is achieved when the resistance line is broken.
In 21% of cases, the price makes a pullback in support on the descending broadening wedge’s resistance line.
I Was Wrong...Here Is The 3 Reasons For This Mistake.1->This price is above the 50 EMA
.2->This price is above the 200 EMA
.3->This price has gapped up
--
1->This price is above the 50 EMA:
When you look at this chart you can see
that the price
has just crossed above the 50 EMA
this means the stock NASDAQ:NVDA
Has been trending above its moving average
for the past month and a half.
--
2->This price is above the 200 EMA
Again this means it's currently trading
on a yearly new high. This means
if you bought this
stock when the 50 EMA crossed
above the 200 EMA
you would be in a profitable position
--
3->This price has gapped up
This last step is speaking to the price action
that may be "too good to be true"
its so easy because this is the final step to really pin point
wether to enter the trade or not.
-
Remember the key is to follow this strategy
-
Rocket boost this content to learn more.
Disclaimer:Trading is risky
do not use more than x4 margin.
Because you will lose money
wether you like it or not.
So learn risk management
and profit taking strategies.

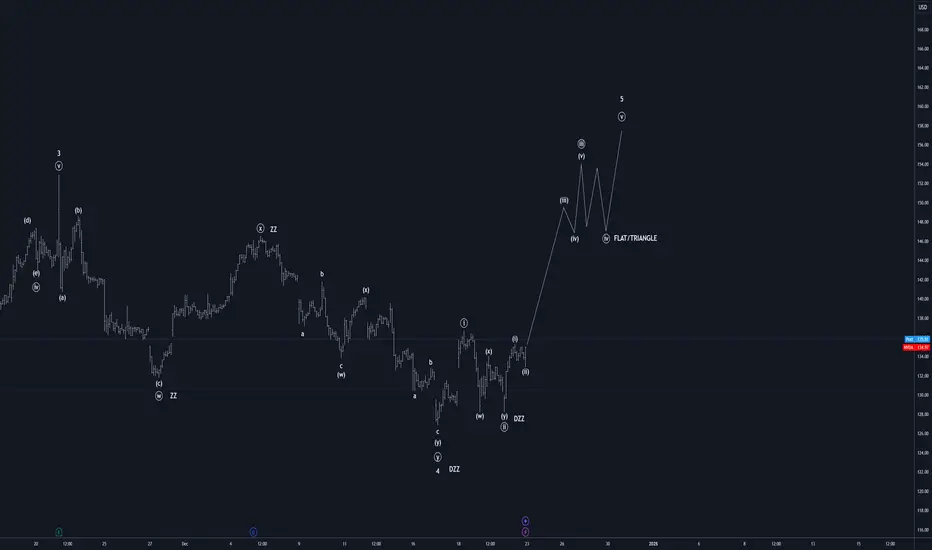
NVDA PUMP NEXT WEEKNVDA's Final 5th Wave Rally: A Short-Term Opportunity
I believe NVIDIA (NVDA) is setting up for its final 5th wave rally in the current Elliott Wave sequence. The corrective structure leading into this rally appears to have completed a WXY pattern, where the W wave took the form of a Zigzag, the X wave also formed a Zigzag, and the Y wave was a Double Zigzag. The correction ended on Tuesday, precisely at the 0.382 retracement level—a typical target for a 4th wave correction.
This technical setup suggests that the 5th wave is now underway. Based on this analysis, I project that NVDA could reach $150 or higher by this upcoming Friday, 12/27. For traders looking for high-risk, high-reward opportunities, the 145 strike call options expiring on 12/27 may offer substantial upside, potentially yielding 2,000% or more if the stock moves as anticipated.
As a trader specializing in risky, out-of-the-money options, I believe the probability of success for this trade is above 50%. However, this is NOT FINANCIAL ADVICE, and this setup involves significant risk. Make sure to assess whether this trade fits within your risk tolerance and trading strategy before acting.
$NVDA to Continue Slow RiseNASDAQ:NVDA - Post split NASDAQ:NVDA is continuing to adhere to the rising pressure.
More than anything with their continued market share success and the hotness of A.I., NASDAQ:NVDA

NVDA at supportNVDA is at a major support level. NVDA hit an intraday low of 127 today. Based on multiple technical indicators, NVDA is a buy around the 125 price zone.
VWMA20 = 140
VWMA50 = 140
VWMA100 = 125
TTCATR S3 = 123
Trade idea:
Long = 127
Stop = 123
Profit = 155
1) buy 100 shares
2) buy 125 call
3) long call spread
sell 155 call
buy 125 call
4) short put spread
buy 125 put
sell 155 put
Options data:
12/20/24 expiry
Put Volume Total 318,966
Call Volume Total 380,956
Put/Call Volume Ratio 0.84
Put Open Interest Total 2,304,003
Call Open Interest Total 3,040,469
Put/Call Open Interest Ratio 0.76
1/17/25 expiry
Put Volume Total 41,472
Call Volume Total 97,747
Put/Call Volume Ratio 0.42
Put Open Interest Total 4,177,795
Call Open Interest Total 3,391,793
Put/Call Open Interest Ratio 1.23
2/21/25 expiry
Put Volume Total 24,905
Call Volume Total 46,275
Put/Call Volume Ratio 0.54
Put Open Interest Total 1,009,356
Call Open Interest Total 1,217,139
Put/Call Open Interest Ratio 0.83

possible upward activity.NVDA has appeared to break out of its wedge-shaped consolidation, in an upward parallel channel. Stochastic RSI and RSI levels are healthy. Please observe levels of interest on the chart FVGs are in green and red blocks. The upward parallel channel boundaries are the main support and resistance estimates. Be careful and watch out for liquidation. Please if this was helpful be so kind to like and boost post. Please share kind and constructive criticism below.
NVIDIA. Buying opportunitiesHey traders and investors!
NVIDIA Daily Timeframe Analysis
A sideways trend (range) was formed on the daily time frame in October 2024 (point 4 was formed). The lower boundary is 128.74, and the upper boundary is 152.89. The seller's vector 11-12 interacted with the lower boundary of the range, where key volumes of the vector passed ("rKC" on the chart). The buyer absorbed these volumes on December 23, meaning they defended the lower boundary of the range.
The current buyer's vector is 12-13, with a potential target of 146.54 (152.89). The obstacle for the buyer is the test level of the seller's zone at 142.82 (the seller's zone is the red rectangle on the chart).
It makes sense to look for buying opportunities (buy patterns) as part of the idea of realizing the buyer's vector 12-13.
I wish you profitable trades.

NICE SUPPORT, HOLD UNTIL 194. PREVIOUSLY GIVE PROFIT ALREADYThis Weekly FORECAST
Opportunity for NVDA. This setup is my trading idea/plan, if you want to follow: trade at your own risk (TAYOR).
Risk Factors:
1. Market conditions, unexpected news, or external events could impact the trade.
2. Always use risk management strategies to protect your capital.

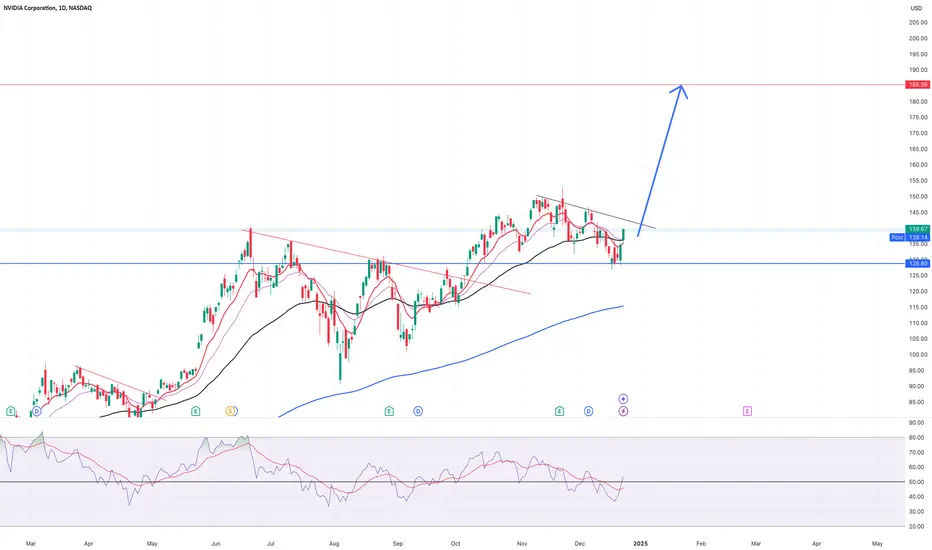
NVDA Still in uptrend (Strong)It’s going up till 185 then falling down for a while around -9%,-11% (but price keep it strong)
The stock market is highly volatile. Please be very careful with your investments.
What to do with NVDA right now?NIVDA has been on a run all year. Started to tank about 30 days ago bigtime. I just jumped in today tell me what you would do at this point.

NVDA - head and shoulders short positionHead and shoulders formation after a trend upwards and with AI boom slowing down. I an playing a correction

Regression Break inside consolidationNVDA has maintain the consolidation with price moving above the regression channel and putting in a higher low.
