TESLA: Patience Is KeyAdmittedly: The news surrounding Tesla is not particularly exciting at the moment. Nevertheless, it is unlikely that the share price of the e-mobility pioneer will plummet. Rather, it is now important to wait for an ideal entry point.
The share has currently recovered significantly from its recent lows and a long entry would offer a suboptimal RRR. Instead, we assume that the price will move sideways to negative in the coming weeks and months, in line with the rather bearish annual seasonality, which usually lasts until September or October. The entry point shown at around USD 260 would then provide an ideal RRR for a long trade that would take us to the ATH area and possibly beyond.
TL0 trade ideas
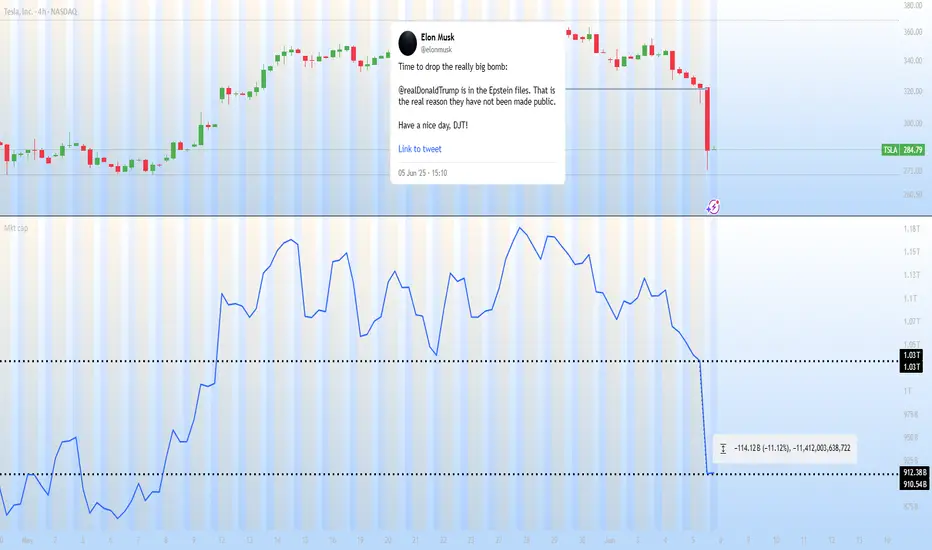
Elon Musk vs Trump: Who you betting on?Elon Musk and Donald Trump have recently had a public falling-out, with their feud playing out on social media and in political circles.
The dispute seems to have started over Trump's new budget bill, which Musk has criticized for increasing the national debt. Trump, in turn, accused Musk of being upset because the bill removes electric vehicle subsidies that benefit Tesla.
The tension escalated when Trump suggested that Musk had known about the bill beforehand and had no issue with it until after leaving his government role. Musk denied this, claiming he was never shown the bill and that it was passed too quickly for proper review. Trump then took things further by threatening to cut Musk’s government contracts and subsidies, which amount to billions of dollars. Musk responded defiantly on social media, calling Trump "ungrateful" and claiming that without his financial support, Trump would have lost the election.
TSLA violated key levels and will be looking for a sharp technical bounce off the $260-$257 zone

Everything we know about the Trump - Musk divorce (so far)
Elon Musk publicly criticised Trump’s “One Big Beautiful Bill” as a “disgusting abomination” that would explode the U.S. deficit and “bankrupt America.” The bill is projected to add $2.5 trillion to the U.S. deficit over 10 years.
Musk claimed Trump wouldn’t have won the 2024 election without his support, calling the backlash “such ingratitude.”
Musk then alleged on X that Trump appears in the Epstein files. This marks a serious escalation (but we all thought this before Musk confirmed it right?)
Trump followed up on Truth Social by calling Musk “crazy” and hinting at cancelling federal contracts with his companies. Trump wrote that cancelling subsidies for Musk’s companies “could save billions,”.
Tesla has wiped out ~$100 billion in market value. Tesla now politically exposed?
Musk floated the idea of creating a new centrist political party, criticising both Democrats and MAGA Republicans. “We need a party that actually represents the interests of the people. Not lobbyists. Not legacy donors. Not extremists.”
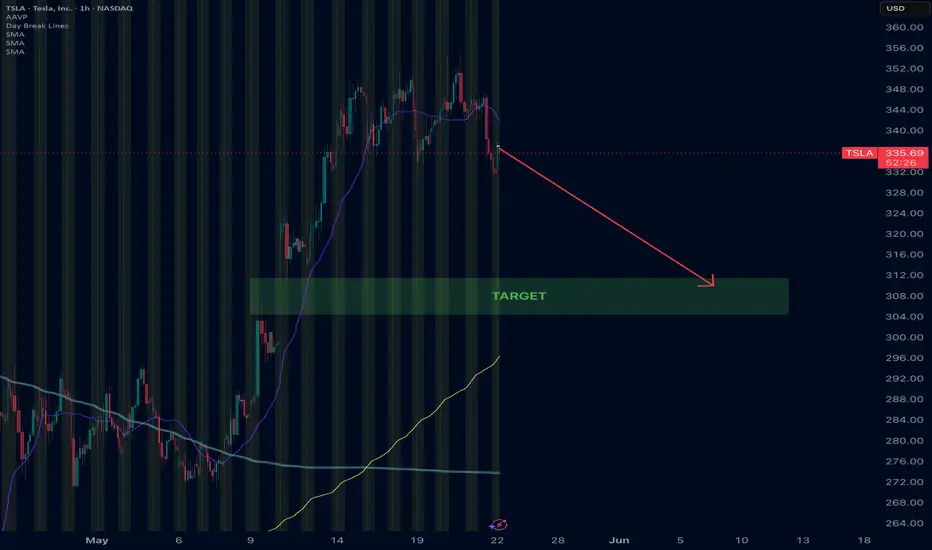
TSLA cooling offI know Tesla lovers hate to see a short post on the stock. Okay... it's cooling off... lol.
*another news report states he's leaving gov't; trump holding on tight... we shall see
*alleged new growth story incoming... check news and see what you see
*TA (technical analysis) look like a pullback in order... 330-325
Do you see what I see? Or you are feeling like it's a straight moon shot?
Have a great weekend.

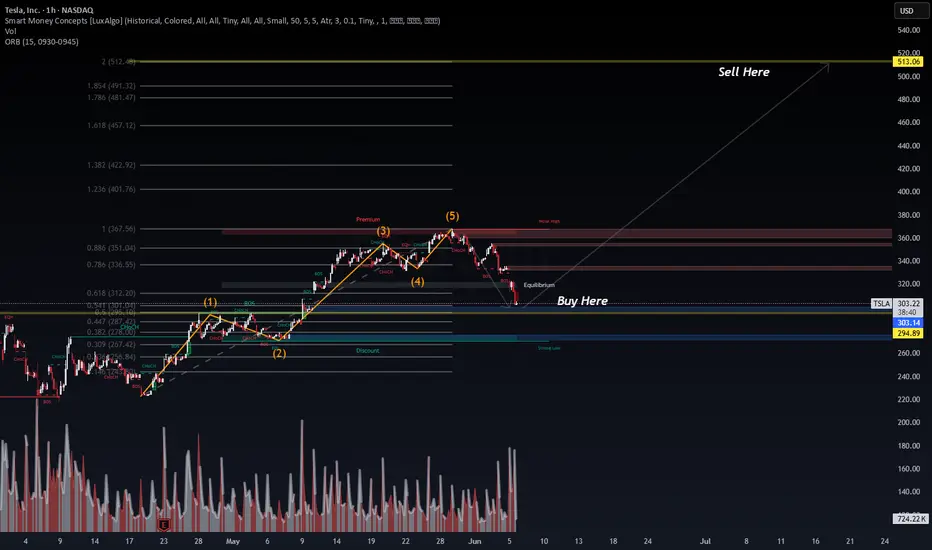
Tesla (TSLA) – SMC Buy Zone Identified🕒 1H Chart | Wave Structure + Liquidity Sweep | Vol: 680K+
🔍 Context:
TSLA appears to have completed a textbook 5-wave impulse, peaking near $385. Price has now retraced into the discount zone, testing a prior equilibrium and FVG (Fair Value Gap)—ideal for reaccumulation.
🧠 Technical Breakdown:
✅ Wave Count Complete: Elliott Wave (1–5) structure suggests a cycle top was formed.
📉 Current Retracement: Price is approaching the 0.5–0.618 Fibonacci retracement and strong OB zone around $294–$303, aligning with Smart Money’s typical entry zones.
📦 Choch → BOS Confirmation: Bullish structure shift suggests a potential reversal zone.
💰 Buy Zone: $294.89 (key low) to $303.17 (equilibrium).
🎯 Target: $513.06 (Fibonacci extension + liquidity cluster).
🧮 Probability Outlook:
📈 Bullish Probability: 70% — Favoring upward continuation post-retrace.
📉 Bearish Breakdown: 30% — If $294 fails, expect deeper retracement toward $267 support.
📊 Strategy Suggestion:
Wait for a bullish confirmation candle near $294–303 zone. Add size above break of minor BOS. Target premium levels with trailing stop logic.
#TSLA #SmartMoneyConcepts #Fibonacci #ElliottWave #VolumeProfile #TradingStrategy #WaverVanirInternational
Momentum Still HighDid not expect this deep fall today. But as the momentum is still high I don't think that the decline is over already. There are some fine targets waiting to be reached lower.
The mood is bearish anyway.
$TSLA That’s why you never mix politics with entrepreneurship
It clouds judgment, delays action, and places key info out of order.
Business needs clarity, not chaos.
Stick to the strategy, not the drama. 💼🚫🎭
#Entrepreneurship #Focus #Discipline #GamePlan

TSLA wait for buying signal at 250s or 210sTesla (TSLA) has been a hot topic among investors. Analysts at TD Cowen recently maintained a "Buy" rating with a price target of $330, citing Tesla's advancements in autonomous vehicle technology as a key factor. Elon Musk has also stated that Tesla has already "turned around," with the stock price climbing back toward last year's highs2. However, Tesla's recent earnings report showed a 71% drop in net profit year-over-year, and vehicle sales fell 13% in the first quarter.
The stock is currently trading above $360, which is 184 times trailing earnings, making it significantly more expensive than legacy automakers. Some investors remain bullish due to Tesla's focus on robotaxis and AI-driven innovations, while others are cautious about its valuation and declining automotive profits.
If you're considering investing, it might be worth reviewing Tesla's latest earnings, growth strategy, and broader market conditions. You can check out more details here and here. Let me know if you want a deeper dive into any specific aspect!

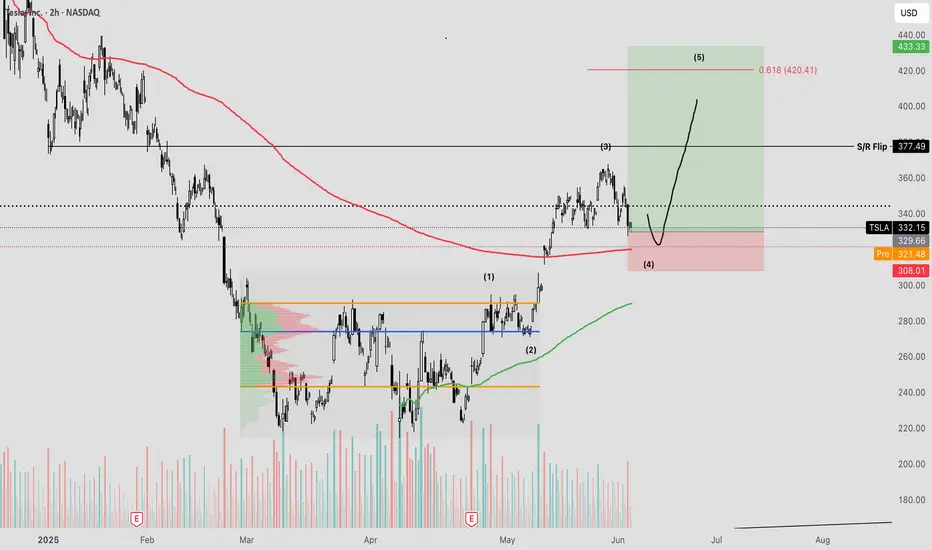
Tesla POP off the lowsTesla is currently experiencing a 5 wave impulsive move from the lows of the tarriff turmoil zone, and seeing increasing strength as it climbs and consolidates.
Generally, whenever you have strong bounces such as this one, you can look for a 5 wave impulse move and utilize fibonacci extensions which innately use mathematics to correlate the momentum relationship between each wave.
At present, we have already seen the first 2 waves, which are quite clearly defined, and now pulling back wave 4 for the last 5 wave blow off.
Using the trend based fib extension from the bottom of wave 1, to wave 3/4 to measure the expected move to the 0.618 extension. Meaning, the last wave is generally approx. 61% the size of the first initial wave.
This is a nice 30% move , and can be quite profitable should it materialize. Stoploss is below $312 on a daily close.
Good luck!
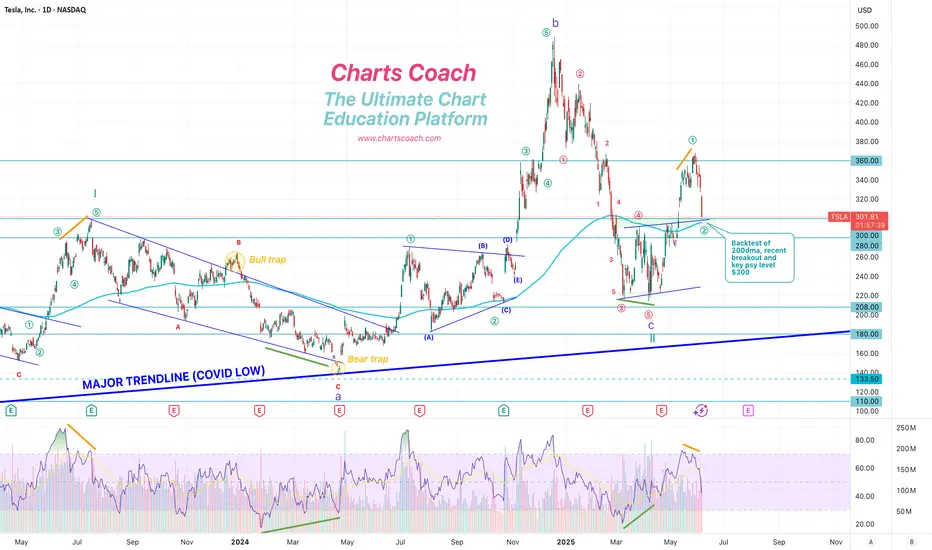
Possible Head & Shoulders Forming Possible head and shoulders forming on the weekly chart could signal more downside ahead.
This plays into a large corrective wave that started in November 2021, which still needs to form a wave-C of comparable size.
A new high above the wave-B top would negate this count.

TSLA Backtest: A robo-taxi launchpad? TBD ... 𝗧𝗲𝘀𝗹𝗮 𝗕𝗮𝗰𝗸𝘁𝗲𝘀𝘁: A robo-taxi launchpad? 🤖🚗
After a 20%+ breakout, NASDAQ:TSLA is retesting its 200dma with $295–300 now key support. Hold that — and bulls have room to run to $400+.
𝘉𝘶𝘭𝘭𝘪𝘴𝘩 𝘴𝘦𝘵𝘶𝘱 𝘸𝘪𝘵𝘩 𝘢 𝘥𝘢𝘵𝘦: June 12 robo-taxi reveal in Austin could mark Tesla’s first real step toward autonomous ride-hailing at scale.
𝘏𝘪𝘨𝘩 𝘱𝘳𝘪𝘤𝘦, 𝘩𝘪𝘨𝘩 𝘩𝘰𝘱𝘦𝘴: Tesla's valuation has always priced in the future. This time, the future might show up in a self-driving Model Y.
$NQ_F NASDAQ:NDX NASDAQ:QQQ NASDAQ:NVDA NASDAQ:AAPL AMEX:SPY NASDAQ:SOX CBOE:ARKK #Tesla #Robotaxi #FSD #ElonMusk #Stocks
SHORT Tesla, Bearish Chart SetupGood morning my fellow Cryptocurrency trader, I hope you are having a wonderful day. If you decide to call me a genius or whatever... The choice is yours to make.
Here, the TSLA stock (Tesla) is showing some weakness signals. Weakness that can translate into a drop.
Would you like me to point those out?
Ok, we can go through a few of them real-quick.
1) A rising wedge pattern. Always bearish.
2) Decreasing volume. Always bearish.
3) Resistance being confirmed at the 19-February peak.
4) Bearish bat.
These are just a few of the chart signals but it is not only about the signals, there is something in the air... I smell... Huh, what to call it? A flash crash? A market shakeout? A flush? A surprise? Or simply, a retrace?
I don't know... All I know is one thing, TSLA doesn't look bullish anymore.
The chart is saying down.
Let's see what kind of event shows up to match the chart.
Namaste.

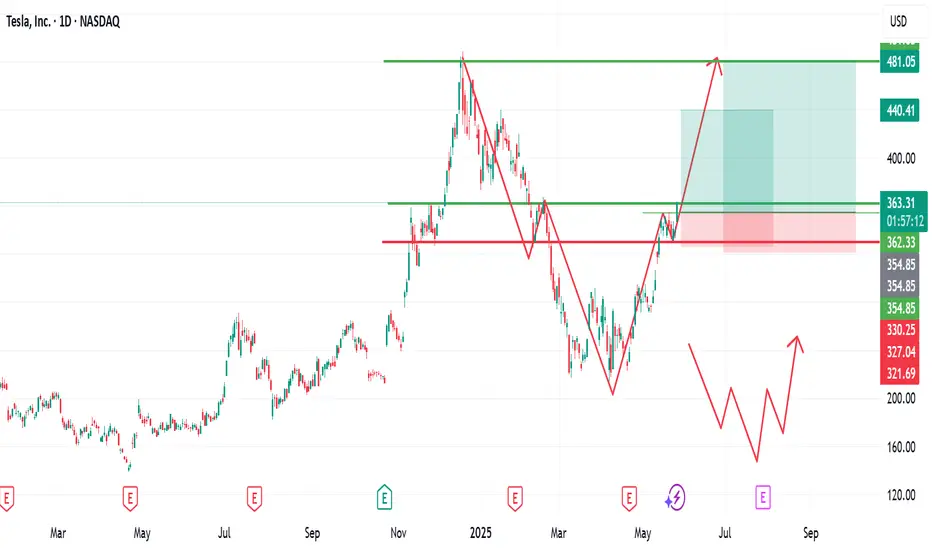
Tesla Inc. (TSLA) Technical Analysis and ForecastTSLA has demonstrated strong upward momentum since the market opened today, reaching a resistance level around the $362 zone.
From a technical perspective, there is potential for a short-term pullback to the $354 area, which aligns with the top of the support zone, also known as the "right shoulder" of the prevailing pattern.
Should this support level hold, we may anticipate a continued upward move, targeting higher price levels.
Key Levels to Watch:
Support Levels:
Primary Support: $354 zone
Secondary Support: $321 zone (as a deeper stop loss level)
Resistance/Take Profit Levels:
Target 1 (Take Profit): $440
Target 2 (Take Profit): $480 (previous all-time high)
Traders should approach this setup with caution, as always, adhering to sound risk management principles.
Market conditions can shift rapidly, and price action around these levels should be monitored closely.
If you find this analysis helpful, please consider supporting the channel by liking, commenting, and sharing this post.
Stay disciplined and trade with care.
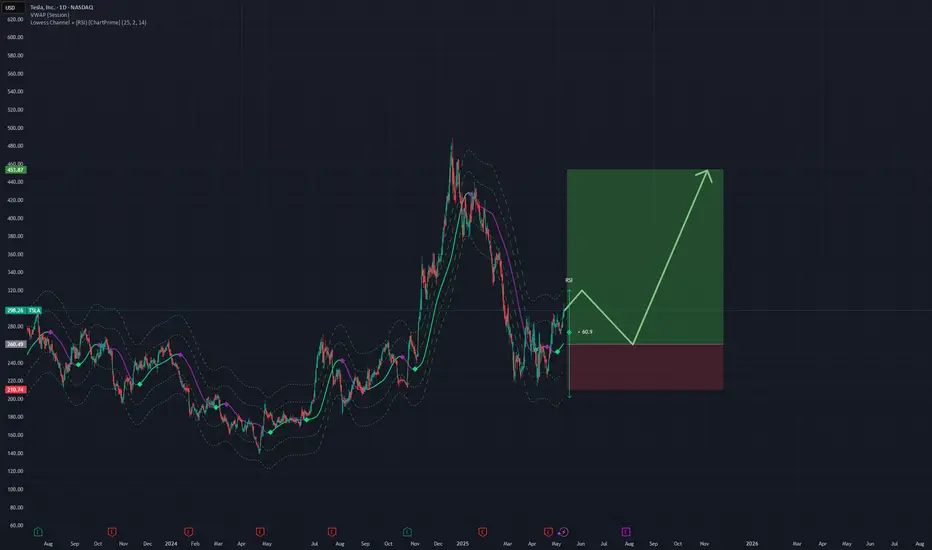
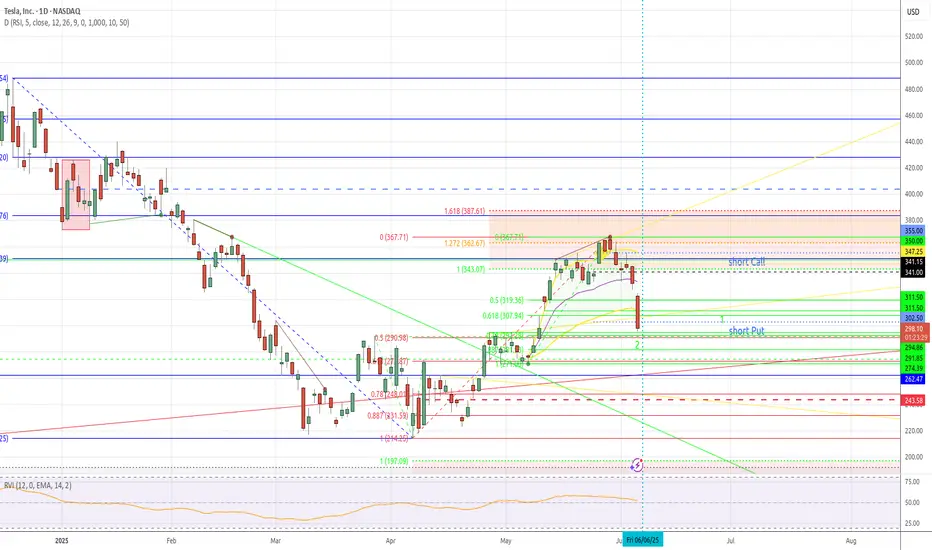
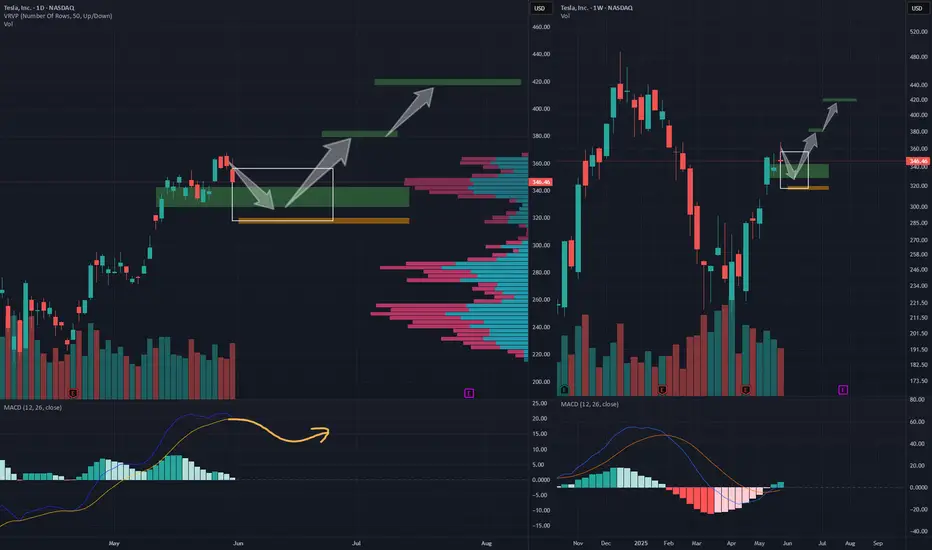
TSLA looking for a rally setupPrediction:
TSLA will likely pull back to the green range (328–342), and in extreme cases, it may dip to the 318–320 area before starting a rally toward ~380 in June or July.
Eventually, it may aim for the ~420 range as the full target, though I’m not very confident about that at this point.
On the daily chart, the overall setup is forming a bull flag pattern, with the MACD showing a potential pullback reversal in the high-range.
The gap between 307 and 311 likely won’t be filled in the near future.
Action:
I plan to accumulate long positions around ~335 and will add more if it drops to 320, or if it breaks above the 10 SMA after breaking below the 20 MA without hitting 320.
Stop loss will be at filling the gap or breaking down 60 SMA.
Potential-loss ratio is 2:1 to 3:1, which is not ideal for TSLA or TSLL. So I will be looking for calls or BCS.
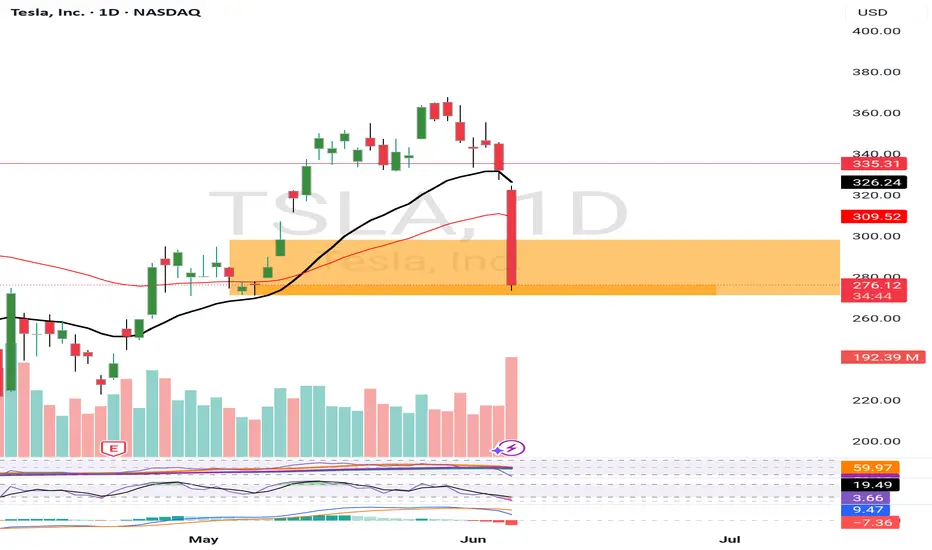
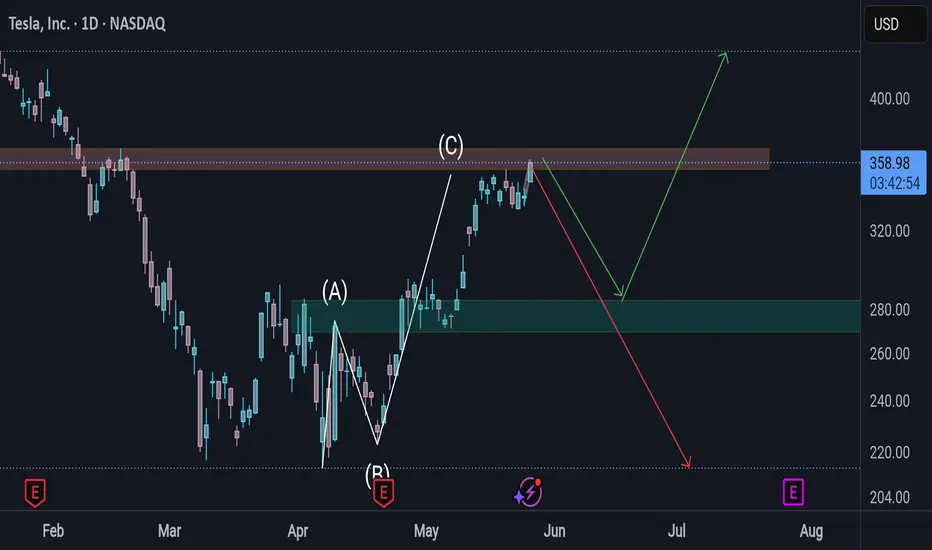
Tesla - retrace is expected before any possible upside.Tesla upside movement so far is a corrective structure ABC. Further upside is possible even if its a corrective structure. For now, a retrace can soon start to Green box. The retrace will also fill gaps.
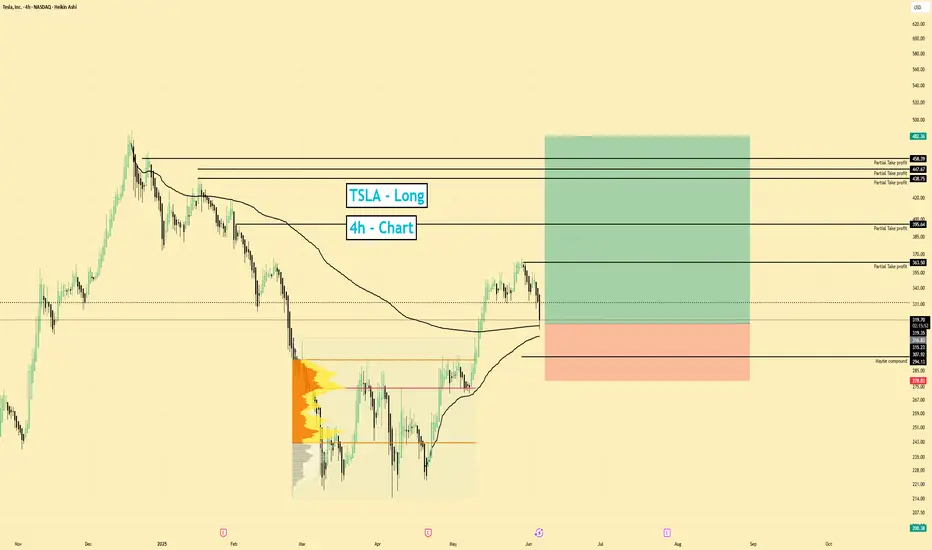
TSLA | Long Bias | Double VWAP + ABC Setup | (June 5, 2025)TSLA | Long Bias | Double VWAP + ABC Setup | (June 5, 2025)
1️⃣ Insight Summary:
Tesla is pulling back just as we anticipated, but strong technical support from a double VWAP level and a developing ABC correction is hinting at a potential bullish reversal. Momentum could build soon — this is a key area to watch!
2️⃣ Trade Parameters:
Bias: Long
Entry Zone: Current VWAP support near $230 (adjust per actual chart level)
Stop Loss: Below VWAP + liquidity zone (~$225 suggested)
TP1: $363
TP2: $395
Partial Exits: Consider profit-taking along the way; over 50% of the position to be closed around the $363–$395 range.
3️⃣ Key Notes:
✅ Support Factors: We're holding the double VWAP level and near the left-side value area high (around $294), with ABC corrective structure playing out.
✅ Money Flow: On the 4H chart, money is flowing out, but on the 30min it's stabilizing near 0 — watch for a potential turn.
❌ Risk Zone: We might see a short liquidity grab under the VWAP before the real move starts. Be patient with entries.
📰 Sentiment & Fundamentals: Tesla dropped due to new tariffs, but the news around Robotaxi services could spark a sharp rebound. Wall Street is watching closely as EPS continues to underperform forecasts.
⚠️ Valuation Caution: Despite a sky-high P/E ratio (189), Tesla remains outside normal valuation rules, like Nvidia. Keep that in mind when thinking long-term.
4️⃣ Follow-Up:
I’ll be monitoring this setup closely — especially how price reacts around VWAP and whether money flow turns green. Updates to come if conditions change!
Please LIKE 👍, FOLLOW ✅, SHARE 🙌 and COMMENT ✍ if you enjoy this idea! Also share your ideas and charts in the comments section below! This is best way to keep it relevant, support us, keep the content here free and allow the idea to reach as many people as possible.
Disclaimer: This is not financial advice. Always conduct your own research. This content may include enhancements made using AI.
TESLA GOES READY FOR ITS NEW LEG DOWN. HERE'S WHAT WE KNOW ABOUTTesla stock declined after Elon Musk’s departure from the Trump administration due to a combination of reputational, operational, and market factors:
Political Backlash and Brand Damage. Musk’s close association with the Trump administration and his leadership of the Department of Government Efficiency (DOGE) generated widespread protests and alienated many of Tesla’s traditional, progressive customer base. This political controversy led to a decline in consumer interest and unsettled investors who were concerned about the brand’s long-term appeal.
Sales and Profit Declines. Tesla faced falling sales and profits, with deliveries dropping in key markets like China and Europe, partly due to intensifying competition and partly due to the backlash against Musk’s political activities. The company reported a 13% year-over-year decline in deliveries, and operating profits fell as well.
Investor Concerns Over Leadership Focus. Investors grew worried that Musk’s political involvement was distracting him from Tesla’s core business at a critical time. There was a perception that the company was losing its competitive edge and that Musk’s attention was divided, which amplified concerns about Tesla’s future growth.
Market Correction After “Trump Bump”. Tesla’s stock had surged after Trump’s election, buoyed by expectations of favorable policies. However, as Musk’s political involvement became a liability and operational challenges mounted, the post-election gains evaporated, and the stock corrected sharply downward.
In summary, Musk’s controversial political role, combined with operational headwinds and shifting investor sentiment, triggered a significant decline in Tesla’s stock after his exit from the Trump administration.
--
Best wishes
@PandorraResearch Team
6/4/25 :: VROCKSTAR :: $TSLA6/4/25 :: VROCKSTAR :: NASDAQ:TSLA
Legging in slowly... again
- valuation is not for this post, i've put it out there last time
- after riding in many teslas in LVN (obviously not my first time) i was AMAZED at how many ubers were using FSD at my request and talking about how it's improved light years since the few versions ahead
- this is now a humanoid-focused company, i'm entirely convinced it will happen and of the three companies out there, only one is public
- and they're coming. given progress in AI (I'm so close to this)... we'll probably see them commercially in kitchens, old ppl homes etc. in a matter of years, at most. I'd guess we see a few out in the wild in two years...
- so while it's hard to wrap my head around the "valuation" in a car context... a trillion bucks for a company in the process of disrupting the entire global services industry, is too cheap.
- send it lower.
- i'm starting my LT position here and want it it lower.
V

TESLA (TSLA) SHORTSHORT IT...
No fundamentals, no technical analysis (because it is there as a trap for new traders).
It is something else...
Tesla (TSLA) Share Price Falls by 3.5%Tesla (TSLA) Share Price Falls by 3.5%
Yesterday, the share price of Tesla (TSLA) dropped by 3.5%, placing it among the five worst-performing stocks of the day in the S&P 500 index (US SPX 500 mini on FXOpen). Since the peak on 29 May, the decline now totals nearly 10%.
Why Tesla (TSLA) Shares Are Falling
Among the bearish factors are:
→ A drop in car sales in Europe. Sales in Germany fell by 36% year-on-year in May.
→ Growing competition from China. May deliveries from Tesla’s Chinese factory were down 15% year-on-year.
→ Elon Musk’s criticism of the US President’s proposed government spending bill.
Media reports also suggest that Musk took offence at staffing decisions at NASA, while Trump is reportedly losing patience with Musk over his attacks on the spending bill.
A potential rift between Musk and Trump could have far-reaching consequences — including for TSLA shares.
Technical Analysis of TSLA Stock Chart
Six days ago, we:
→ Drew an ascending channel (shown in blue), noting that the upper boundary could pose a challenge to further gains;
→ Highlighted the $355–$375 zone (shown in purple) as a possible resistance area;
→ Suggested a correction scenario following a roughly 27% surge in TSLA’s stock price during May.
Since then, the price has dropped towards the median line of the ascending channel. If this fails to offer sufficient support, the correction may continue towards the lower boundary of the channel, which is reinforced by support around the psychological $300 level and former resistance at $290.
News related to the planned rollout of Tesla’s robotaxi trials could significantly impact TSLA’s price movements in June.
This article represents the opinion of the Companies operating under the FXOpen brand only. It is not to be construed as an offer, solicitation, or recommendation with respect to products and services provided by the Companies operating under the FXOpen brand, nor is it to be considered financial advice.

TESLA'S WORST CASE SCENARIO + Some Investing WisdomIn this video I go over what NASDAQ:TSLA worst case scenario would look like, and why it's not actually as bad as you think. Then I drop some wisdom that you might one day teach ya kids & ya baby momma

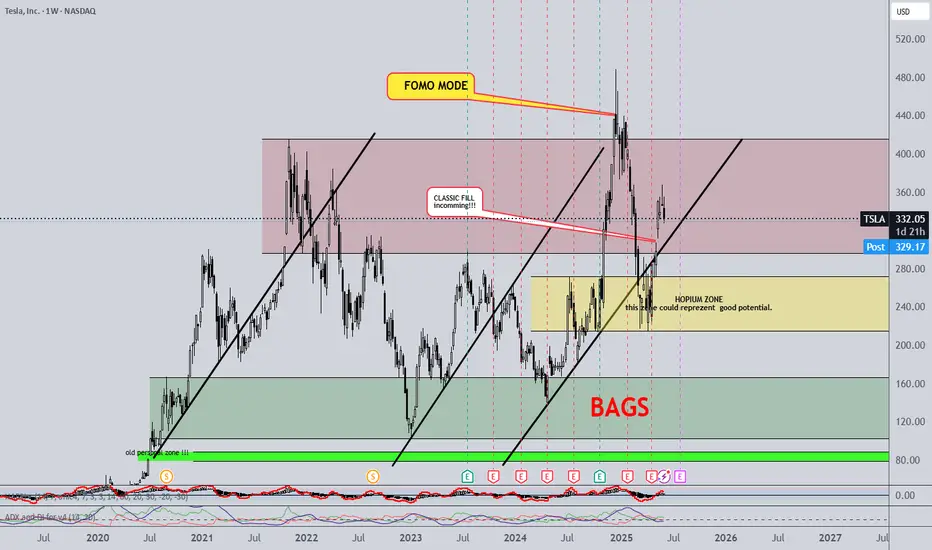
WILL IT HOLD THE LINE this time ?Hello ,
one of big boy players .
And my 30000 overview .
Yes I like to look far away to see whats is the haos about ........
Many many many !!!! learned that you dont play that one down ;) .... However charting can be helpfulll .
You in it ? You know why .....
Am I ?
NO .
Is there potential to Fly .. YES.....
What you see here is very simple aproach to charting using the most old simple aproach .
Can I make this complicated and get your head spin ? YES.
some fundamentals dont change .......
SUPPLY / DEMAND is one of them .
Here you can see how this price reponded to market conditions ,
Yes im talking about price at this poin only . (why) ( other metricks are out )
Deeper rabbit O >>>
ONLY one way is simply put this on Play mode and that would be the only one way to watch this develop .
This can deserve deeper brake down eventualy.
But I belive that this mode its great for the company volatility .
cheers !.
Any OPINIONS ?