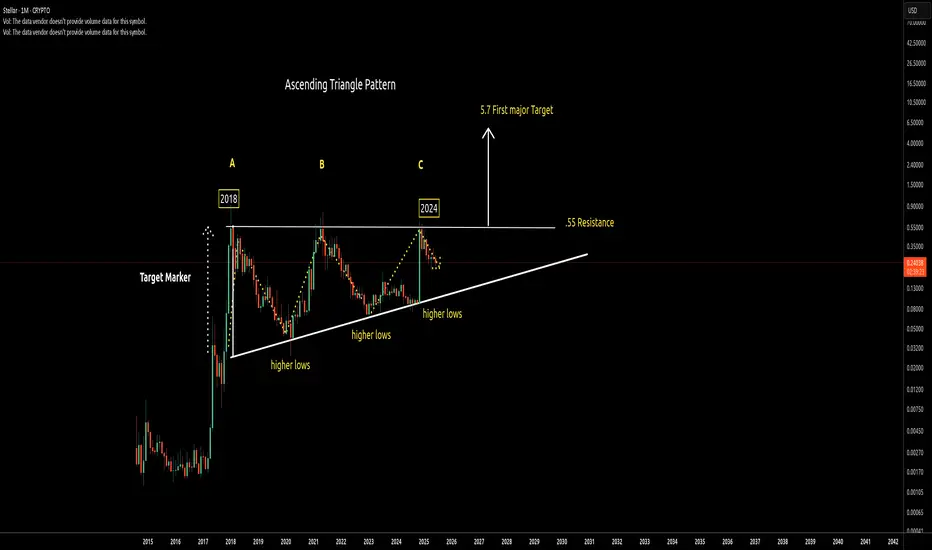
XLMUSD : Long Term Bullish Ascending triangle. Target $5.7
On the Monthly chart XLM is forming a long-term bullish ascending triangle pattern with a first major target of $5.70.
The chart shows the ascending pattern has been forming since 2018, which makes this a long-term play for patient traders.
The ascending triangle pattern is a bullish formation id
Key stats
About Stellar Lumens
Stellar launched in 2015 as a new and quirky alternative to storing and moving money. The protocol links people, banks, and other financial institutions with the intention of reducing transaction costs and time lags between transfers. Its native token Lumens (XLM) is used as an intermediary between different fiat currencies. For example, the protocol can convert deposits into XLM, then convert XLM into the requested currency. As with many other crypto projects, Stellar also seeks to bring its technology to developing communities that either feel the burden of traditional banking or are unable to access it at all.
Related pairs
XLM USDT on the weekly line chart... Flat roof resistanceThe chart speaks for itself... if this monster breaks from the smaller Daily pattern bullflag, it will catapult us into the larger ascending triangle formation that has been forming for 7 years...
This could be the final buy of the decade for XLM! DO NOT SLEEP ON THIS!
600% bullflag on XLM, massive wave part 2?Based on the LOG scale of XLM we see something very interesting happening, with a flat roof on the weekly and a clear W formation we can expect a possible nuclear upside.
This chart is set on the daily watching the channel with high accuracy S/R levels, we can also see the yellow line that was test
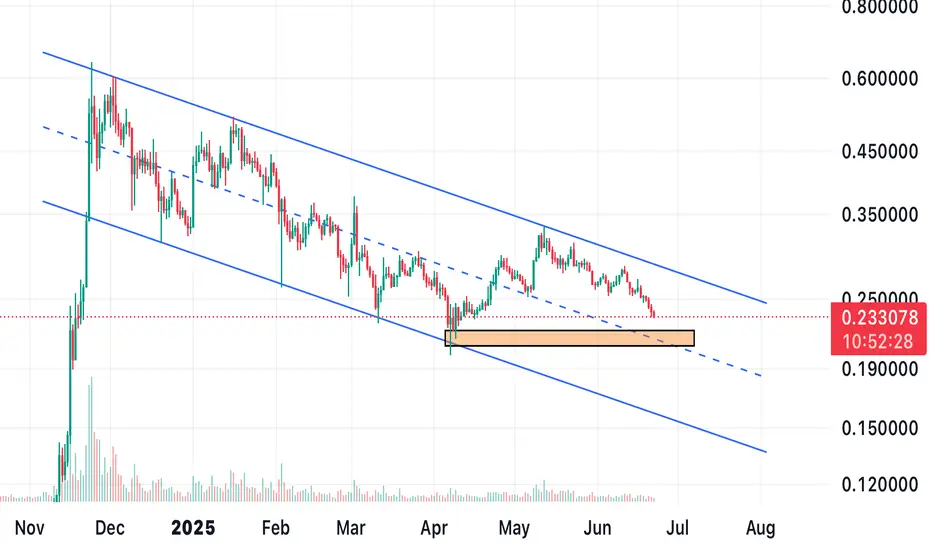
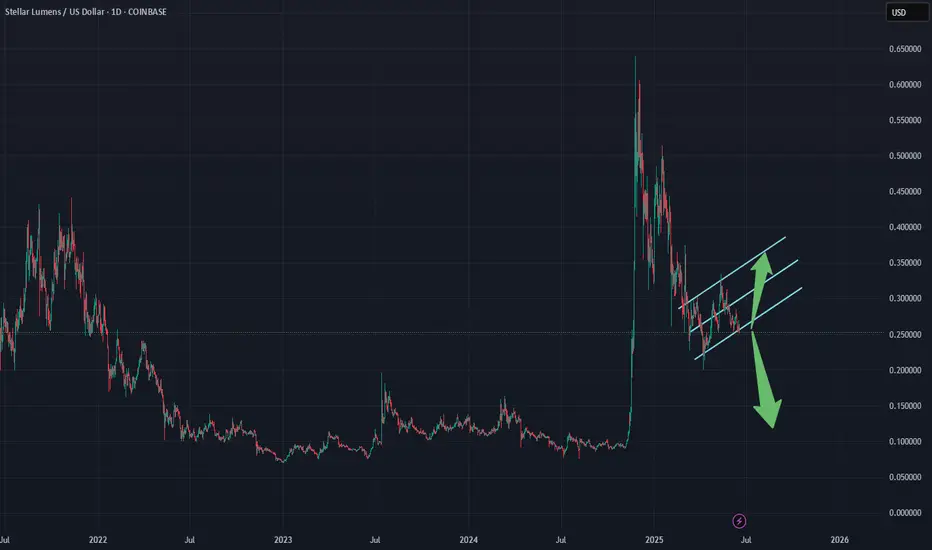
Descending ChannelXLM has been stuck in a descending channel since December 2024 (7 months now). For XLM to form a reversal it needs to hold onto orange support level. If XLM loses this support, then the next level of support will be at the bottom of the descending channel, which is around 15-17 cents. If XLM manages
DECISION TIMEXLM had a beautiful falling wedge
pattern that actually broke up and
out of the wedge however it failed
to hold the back test of support.
What does this mean? Well...in
layman terms...we are headed for
lower price action. You see....ladies
and gentlemen...it's quite clear to
me the BTC maxi's
XLM first a shortWell, looks like we had an impulsive wave up for the wave 1. Now correctiong, Looking to short for a nice 23%. The take position for the bigger and sickest wave 3.
XLM Stock Chart Fibonacci Analysis 062325Trading Idea
1) Find a FIBO slingshot
2) Check FIBO 61.80% level
3) Entry Point > 0.24/61.80%
Chart time frame:C
A) 15 min(1W-3M)
B) 1 hr(3M-6M)
C) 4 hr(6M-1year)
D) 1 day(1-3years)
Stock progress:A
A) Keep rising over 61.80% resistance
B) 61.80% resistance
C) 61.80% support
D) Hit the bottom
E
XLM Stellar (XLM) Strategic Partnerships
Stellar boasts a strong network of partnerships with major financial and technology institutions, strengthening its position in cross-border payments and decentralized finance. Here are the most prominent of these partnerships and their impact:
1. Partnerships w
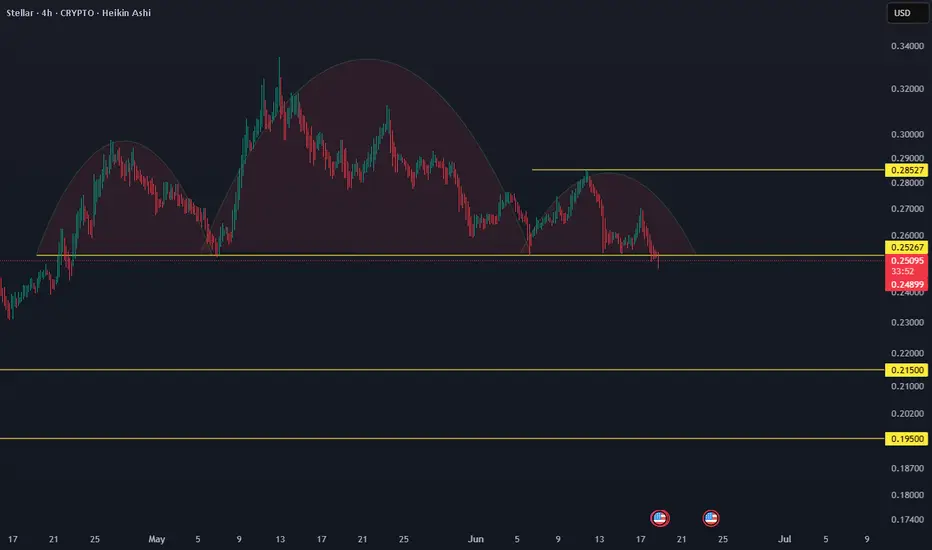
XLMUSDT bearish 4hr time frameBTC is still in an uptrend but in a consolidation phase. However, many altcoins appear to be outliers and are significantly weaker when BTC is in a pullback phase. One of them is XLM/USDT, which is trading below the 100 and 200 MA on the daily timeframe.
A close below 0.25267 on the 4-hour timefram
BE VIGILANT HEREWith the unrest in the Middle East
we are testing the lower support
band on XLM. My worry here is we
break the lower line of confluence
and it becomes resistance. If so,
I would plan on taking a HUGE long
margin trade on XLM around .1203
I have my BUY limit 20x orders set
@ 12 cents. Not financ
See all ideas
Displays a symbol's price movements over previous years to identify recurring trends.
Curated watchlists where XLMUSD is featured.

Alt forks: The path less traveled. But still pretty profitable
12 No. of Symbols
Decentralized Exchange Tokens: Risky business?
22 No. of Symbols

Eco-friendly crypto tokens: Green cryptocurrencies
14 No. of Symbols

Gen 1 crypto: from little acorns grow
15 No. of Symbols

Smart contracts: Make the smart decision
36 No. of Symbols

Top altcoins: Choose your alternatives carefully
28 No. of Symbols
See all sparks
Frequently Asked Questions
Stellar Lumens (XLM) reached its highest price on May 16, 2021 — it amounted to 0.7985 USD. Find more insights on the XLM price chart.
See the list of crypto gainers and choose what best fits your strategy.
See the list of crypto gainers and choose what best fits your strategy.
Stellar Lumens (XLM) reached the lowest price of 0.0260 USD on Mar 13, 2020. View more Stellar Lumens dynamics on the price chart.
See the list of crypto losers to find unexpected opportunities.
See the list of crypto losers to find unexpected opportunities.
The safest choice when buying XLM is to go to a well-known crypto exchange. Some of the popular names are Binance, Coinbase, Kraken. But you'll have to find a reliable broker and create an account first. You can trade XLM right from TradingView charts — just choose a broker and connect to your account.
You can discuss Stellar Lumens (XLM) with other users in our public chats, Minds or in the comments to Ideas.