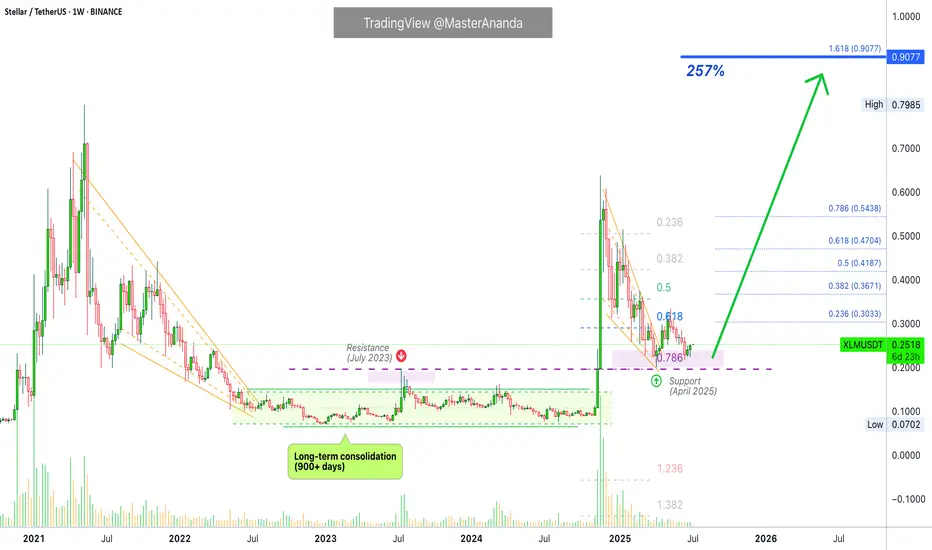
Stellar 2025 Bull Market, ATH Targets, Price Action & MoreA very interesting chart. What is interesting here is how obvious it is that the correction is over. Stellar produced a massive bullish breakout in November 2024, more than 700% growth. After a strong move, there is always a correction. After the correction ends, we get the resumption of the initial
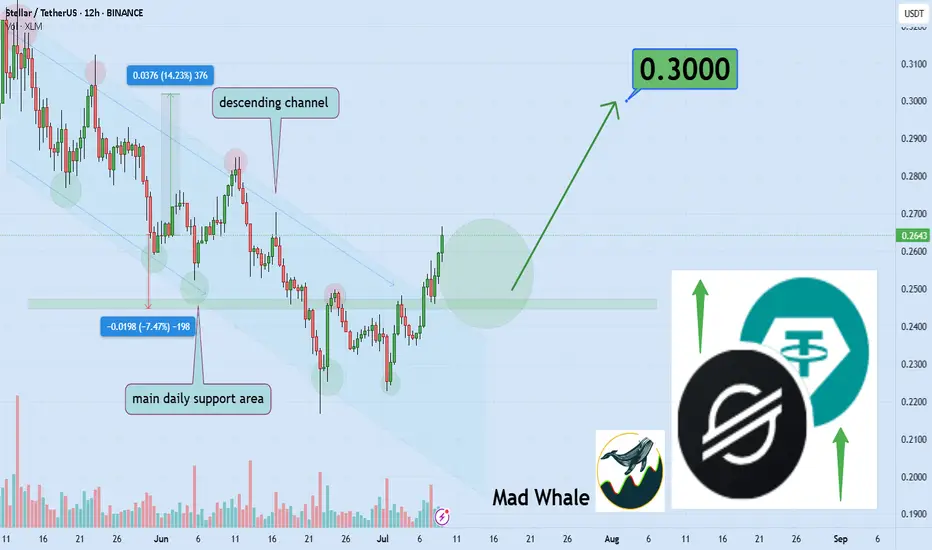
Stellar Eyes 14% Upside, Targeting 0.30$Hello✌
All previous targets were nailed ✅! Now, let’s dive into a full analysis of the upcoming price potential for Stellar 📈.
BINANCE:XLMUSDT has convincingly broken above its daily descending channel resistance 📈 and is holding near a strong support level. This setup suggests a potential ups
Stellar XLM price analysisToday, the price of CRYPTOCAP:XLM rose quite dramatically, doing so at a critically important moment, but trading volumes are slightly insufficient for final confirmation.
Now let's look at what we wrote for the OKX:XLMUSDT chart four months ago: “It would be ‘right’ to test $0.19-0.20 before t
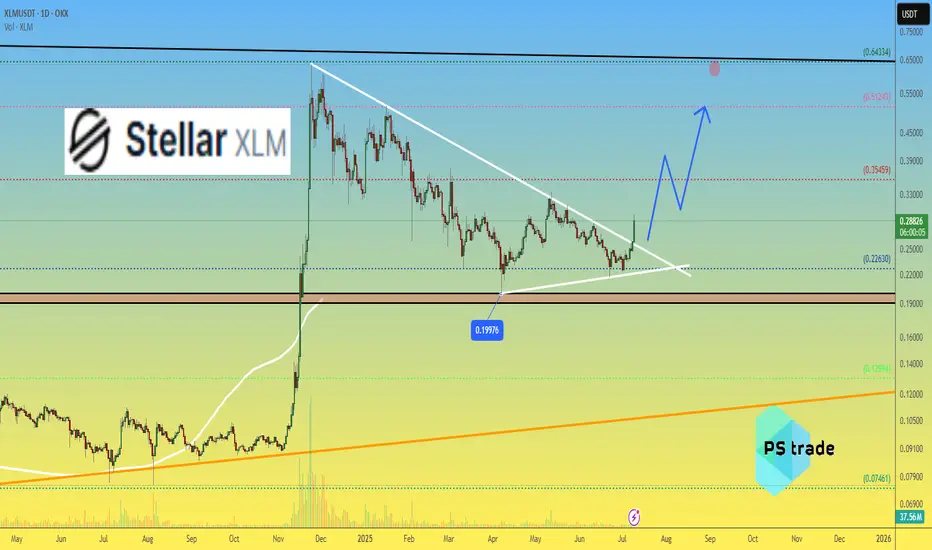
$XLM/USDT Breakout Alert: 80% Move on the Table?CRYPTOCAP:XLM just broke out of its downtrend after months of being stuck in a falling channel.
The breakout came with a strong 12% pump, and price is now holding above both the trendline and the 40MA, a solid bullish sign.
If this move holds, we could see XLM push toward the $0.4540 zone (that
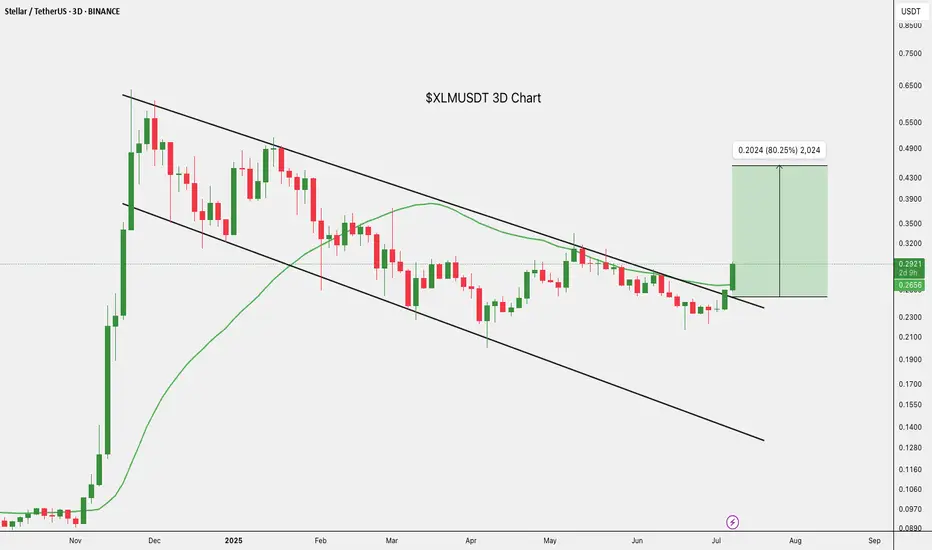
xlmusdt trading opportunityXLMUSDT has exhibited a breakout from a falling wedge formation, the price is anticipated to perpetuate its antecedent bullish trajectory.
We have demarcated a specific zone on the chart that we refer to as the 'bull important zone.' This region is earmarked for its potential as an accumulation zon

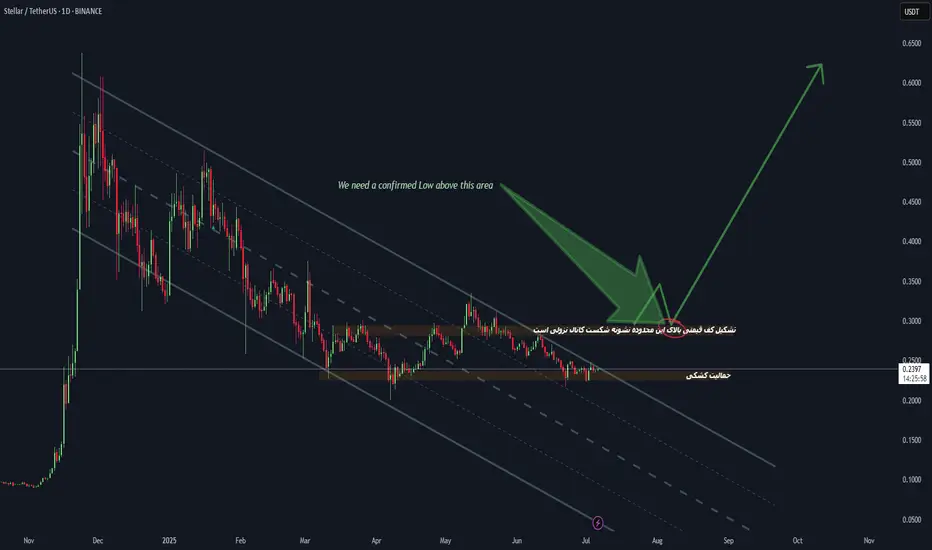
Stellar (XLM) Price Analysis - Potential Breakout ScenarioThis chart provides a technical analysis of Stellar (XLM) against Tether (USDT) on a daily timeframe, highlighting a potential breakout scenario. The price has been trending downward, approaching a key support area. The green arrow indicates a possible upward movement if a confirmed low is establish
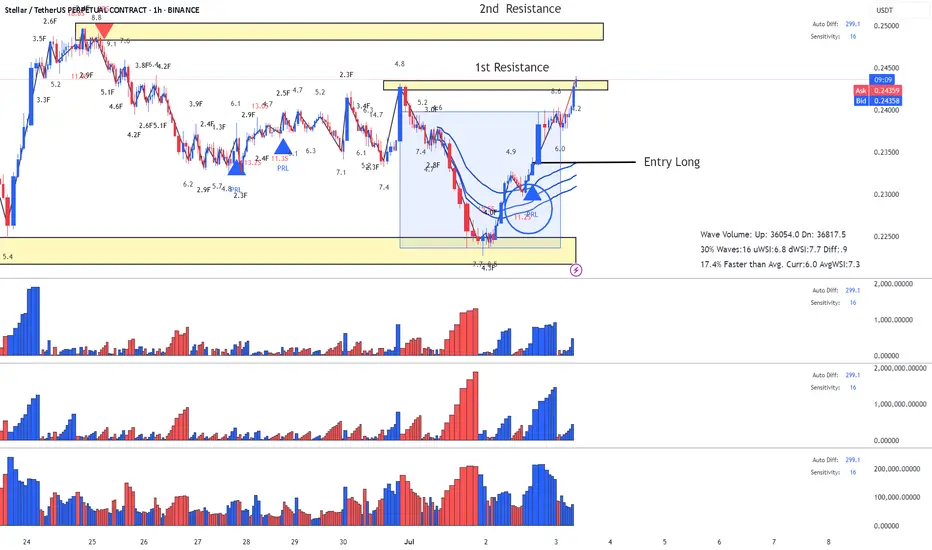
XLM Stellar - Classic Lesson 15 said Long Lesson 15 methodology (annotations in sync with the chart):
1. Support (this where buyers can come in)
2. Largest dn volume wave after a while - Look left - buyers came in previously at the same location.
3. Placed AVWAP and waited for price to cross upwards and pullback again on AVWAP
4. Entry sig

XLM Stellar Long Closed on 2nd ResistanceBased on previous entry explanation posts
Trade was closed with nice profit on second resistance which happen to touch it right on US non Farm news.
Enjoy!
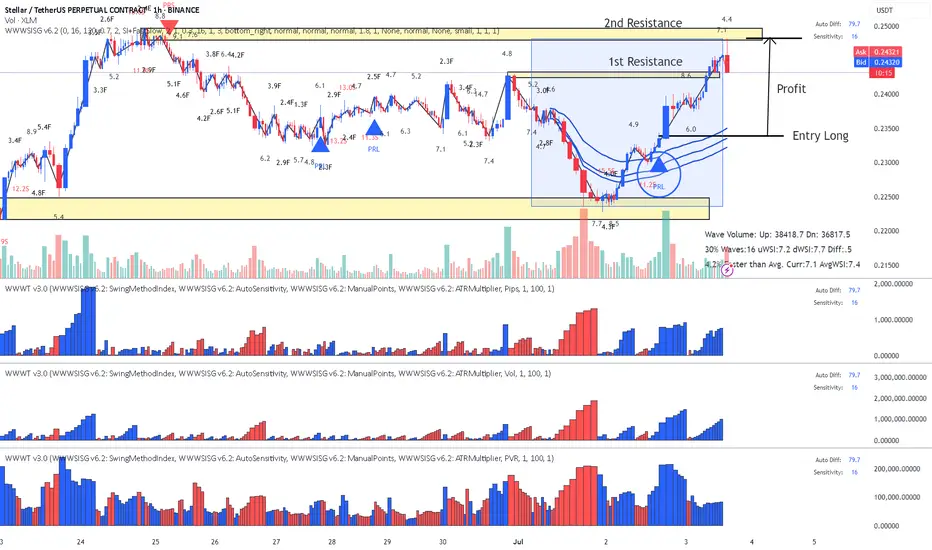
XLM Stellar - Lesson 15 did the jobBased on previous idea explaining the entry Long.
I have moved stop to profit and we have two Resistance levels to surpass or not. According to the details on this levels I will close or let it run.
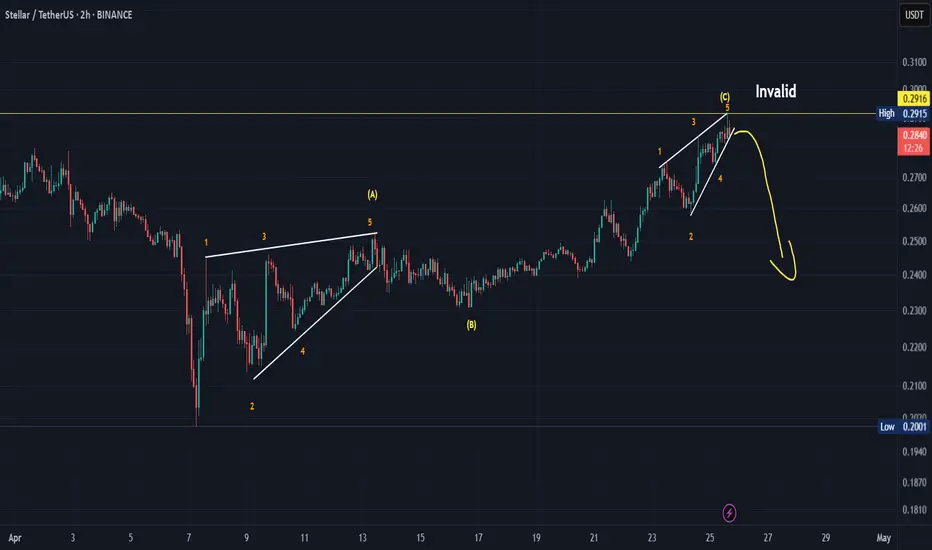
Coming down!I see three corrective waves in front of me that have been completed and concluded with an ending diagonal pattern. Please be careful of the possible upcoming decline.
*In principle, I am not a supporter of any direction, but I am only giving my point of view, which may be right or wrong. If the ana
See all ideas
Summarizing what the indicators are suggesting.
Oscillators
Neutral
SellBuy
Strong sellStrong buy
Strong sellSellNeutralBuyStrong buy
Oscillators
Neutral
SellBuy
Strong sellStrong buy
Strong sellSellNeutralBuyStrong buy
Summary
Neutral
SellBuy
Strong sellStrong buy
Strong sellSellNeutralBuyStrong buy
Summary
Neutral
SellBuy
Strong sellStrong buy
Strong sellSellNeutralBuyStrong buy
Summary
Neutral
SellBuy
Strong sellStrong buy
Strong sellSellNeutralBuyStrong buy
Moving Averages
Neutral
SellBuy
Strong sellStrong buy
Strong sellSellNeutralBuyStrong buy
Moving Averages
Neutral
SellBuy
Strong sellStrong buy
Strong sellSellNeutralBuyStrong buy
Displays a symbol's price movements over previous years to identify recurring trends.