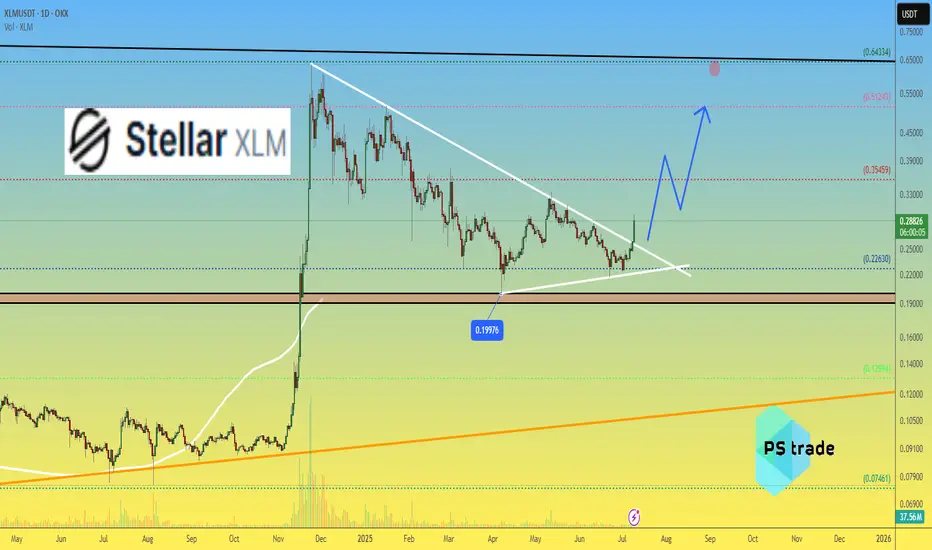
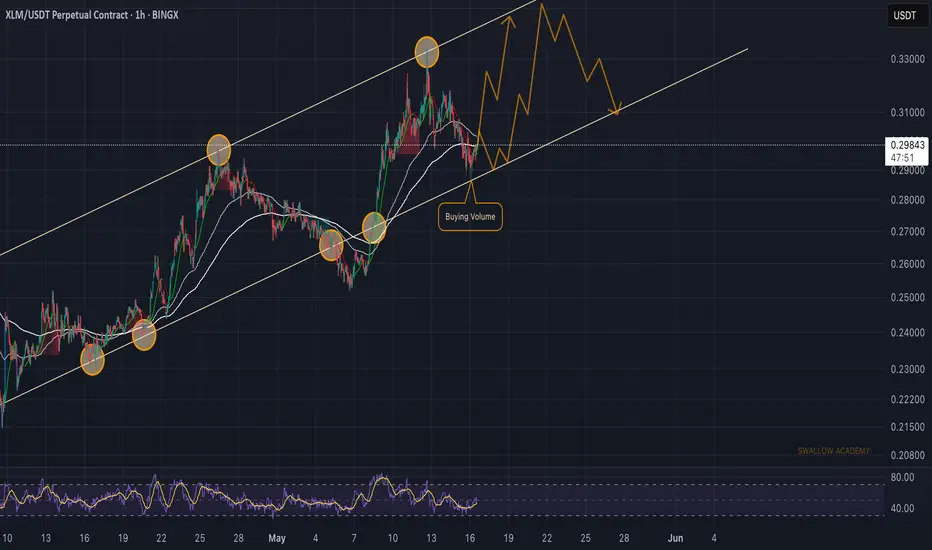
Stellar (XLM): Looking For Breakout | Breakout + Re-TestStellar is going to a breakout, a breakout which will give us a good opportunity for a long position. Now, we might see some smaller rejection and correction from current area, but we still will be witing for breakout, not going to enter earlier into trade here.
Better safe then sorry yea?
Swallow Academy
XLMUSDT trade ideas
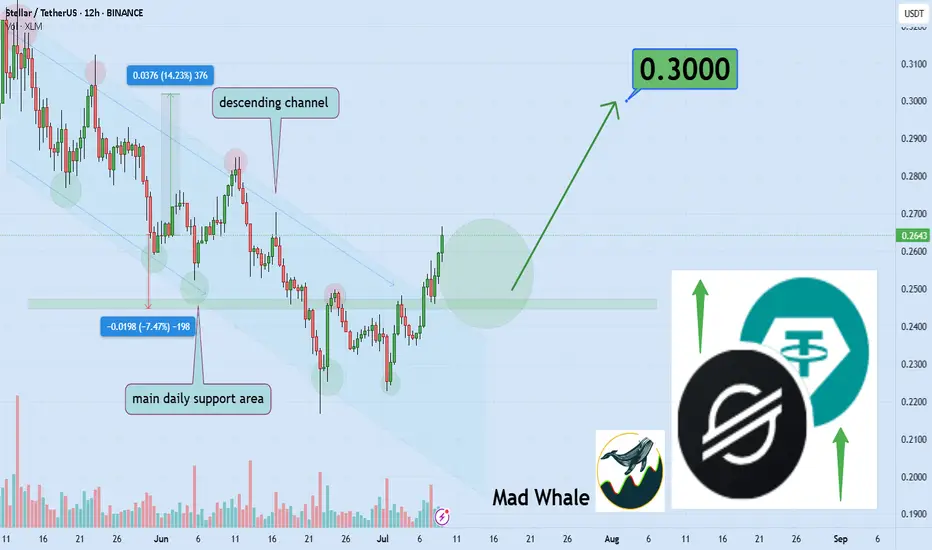
Stellar Eyes 14% Upside, Targeting 0.30$Hello✌
All previous targets were nailed ✅! Now, let’s dive into a full analysis of the upcoming price potential for Stellar 📈.
BINANCE:XLMUSDT has convincingly broken above its daily descending channel resistance 📈 and is holding near a strong support level. This setup suggests a potential upside of at least 14%, aiming for a target price of $0.30 🚀.
✨ Need a little love!
We pour love into every post your support keeps us inspired! 💛 Don’t be shy, we’d love to hear from you on comments. Big thanks , Mad Whale 🐋
Stellar XLM price analysisToday, the price of CRYPTOCAP:XLM rose quite dramatically, doing so at a critically important moment, but trading volumes are slightly insufficient for final confirmation.
Now let's look at what we wrote for the OKX:XLMUSDT chart four months ago: “It would be ‘right’ to test $0.19-0.20 before the start of strong growth.”
👆
The minimum was $0.19976 — do we "check" and "done" that?
📈 If so, then the price of #XLM should not fall below $0.226 anymore.
And ahead lies only growth in the price of the #Stellar token to at least $0.50, or even $0.60.
🏆 Well, and about the global goal for #XLMUSD we wrote in the previous idea — read, analyze, and turn information into profit!
_____________________
Did you like our analysis? Leave a comment, like, and follow to get more
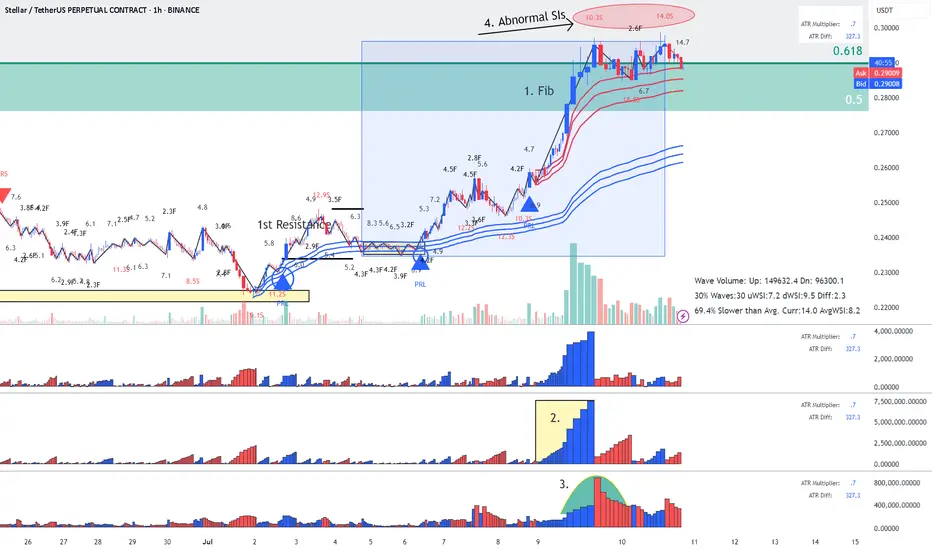
XLM - Stellar - Possible Short coming up - This is Why?Reading the chart (annotations in sync with chart):
1. Location: Fib over-shoot - possible sellers
2. Largest up volume - possible sellers in there
3. Mountain shape PVR - increasing volume as wave progress
4. Abnormal SIs at top (could be closing positions but it also could be sellers absorbing buy orders.
Risky Entry but with better RR enter now. stop above tops, target blue AVWAP
Conservative Entry with worse RR: wait for the break downwards of red AVWAP, target blue AVWAP.
Enjoy, wave and speed index reading!
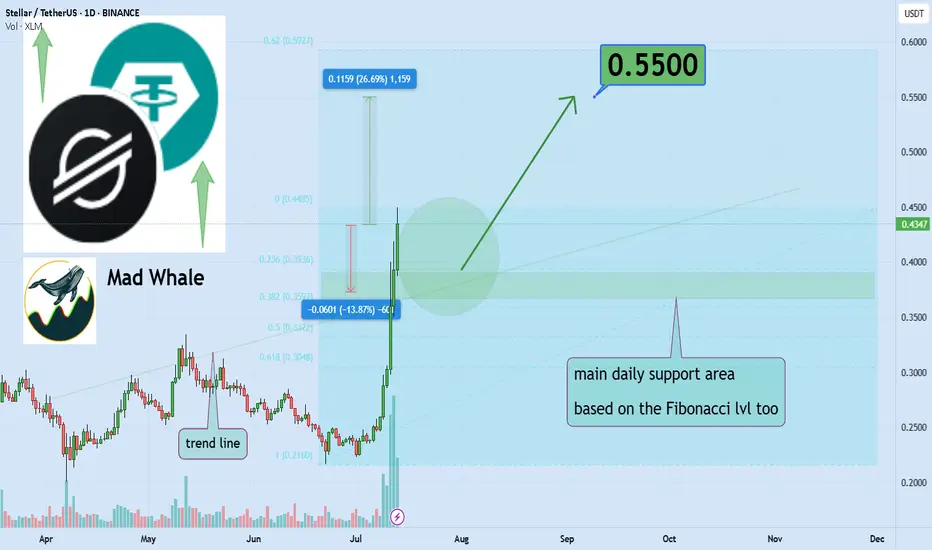
Is Stellar ready to rally 26% toward 0.55 target?Hello✌
let’s dive into a full analysis of the upcoming price potential for Stellar 📈.
BINANCE:XLMUSDT has surged through multiple daily resistance levels this past week, resembling a powerful breakout 🚀. It is now approaching a key daily support that aligns with the 0.26 Fibonacci retracement level. If this support holds, there is potential for a 26% gain, with a target price of 0.55 📈.
✨ Need a little love!
We pour love into every post your support keeps us inspired! 💛 Don’t be shy, we’d love to hear from you on comments. Big thanks , Mad Whale 🐋
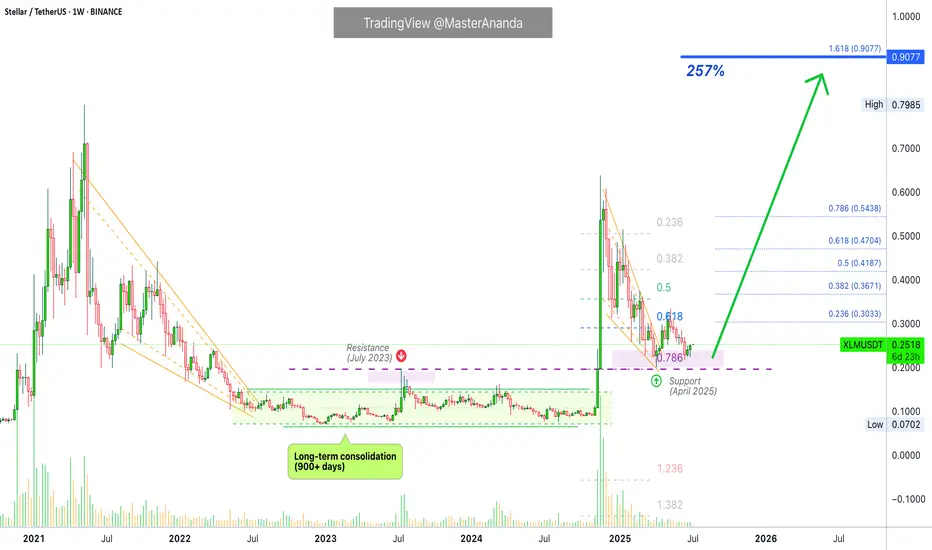
Stellar 2025 Bull Market, ATH Targets, Price Action & MoreA very interesting chart. What is interesting here is how obvious it is that the correction is over. Stellar produced a massive bullish breakout in November 2024, more than 700% growth. After a strong move, there is always a correction. After the correction ends, we get the resumption of the initial move, in this case a bullish wave.
The 0.786 Fib. retracement level worked as support. 7-April. There is an interesting dynamic around this level. Back in July 2023 as XLMUSDT was rising resistance was found around 0.2000. Very close to this level. We then had the late 2024 bullish wave and the correction that ended in early April this year. Support was found exactly at the 0.786 Fib retracement level and this level matches 0.2000. This is the purple line on the chart. Resistance turned support.
After this support zone was hit and confirmed Stellar moved to produce an initial breakout and on the 16-June week, 22-June, we get a higher low. This higher low signals the start of the next bullish wave with a target around 0.9100. This is the next target for the current move but not necessarily where the bull market cycle will end. Can be but not necessarily, the action can move higher.
Growth potential from current price to our target goes to 257%. Coming from the August 2024 low, this same target would give a total of 1,099%. Seeing how strong the first jump was, it is likely that Stellar will go higher in this 2025 bull market.
We have another target between $1.25 and $1.35.
Let's focus on the market and the bigger picture.
Stellar has already proven that it will be a top performer in this cycle. Back in late 2024 XLM outperformed many projects, we can expect the same pattern to repeat in this bullish continuation.
The fact that there are no new lows also signals strength. We saw many pairs hitting new all-time lows in April and June, this is not the case here. And this is also good.
This is a proven project so it is easy to go in big.
Last time the meat of the move unraveled in just two weeks. Something also to keep in mind. Something similar would allow us to profit from the entire XLM wave and then browse the market for new opportunities.
Remember, the market is set to grow for 6 months in the least or it can extend and grow for years. While some pairs go down, others will be going up. When some pairs stop going up, others being down will recover and grow. The market will cycle between this and that, here and there; in the end, everything grows; that's the definition of a bull market. A rising wave lifts all boats.
Notice the long-term consolidation phase, it lasted more than 900 days and then we had a very strong bullish breakout. The longer the consolidation phase, the stronger the move that follows. This is only the beginning, there will be more.
Thank you for reading and for your continued support.
Namaste.
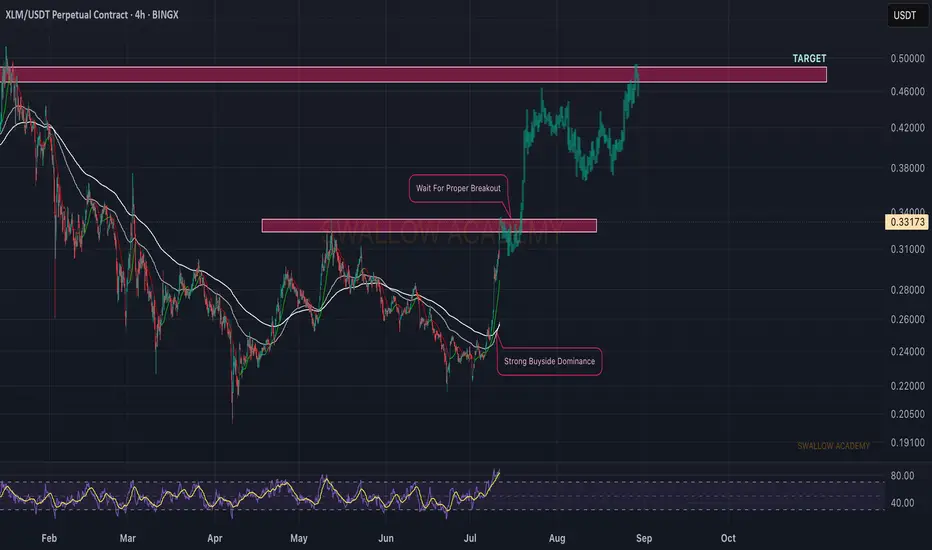
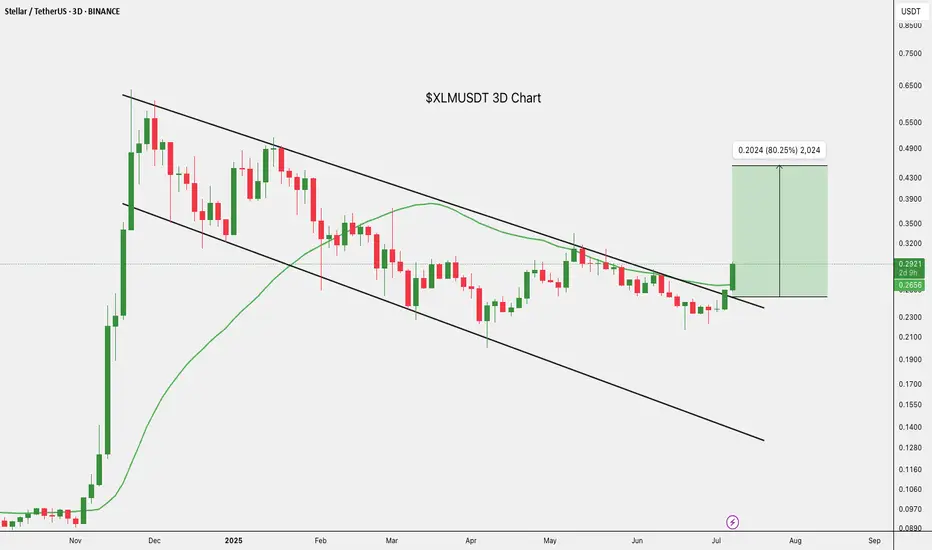
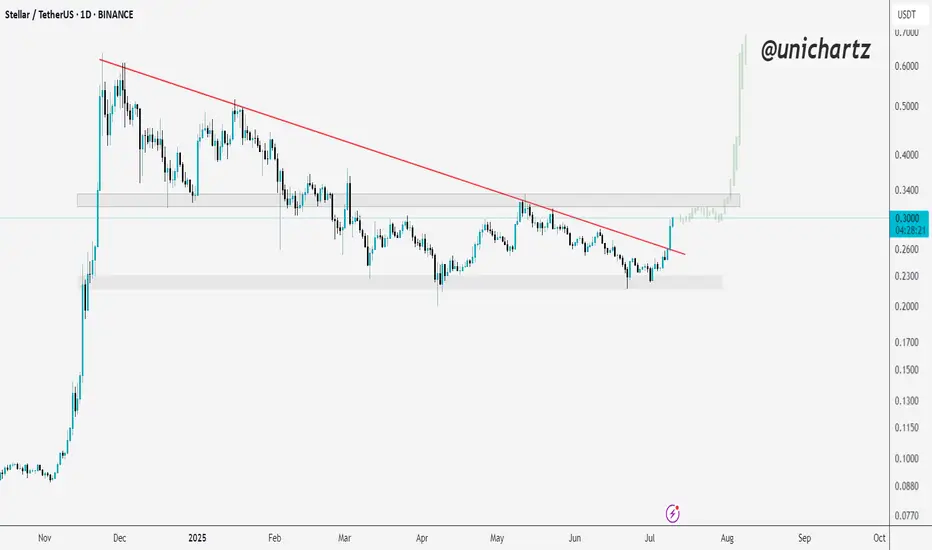
$XLM/USDT Breakout Alert: 80% Move on the Table?CRYPTOCAP:XLM just broke out of its downtrend after months of being stuck in a falling channel.
The breakout came with a strong 12% pump, and price is now holding above both the trendline and the 40MA, a solid bullish sign.
If this move holds, we could see XLM push toward the $0.4540 zone (that’s nearly 80% up).
A quick retest around $0.2646 might be the next best entry.
xlmusdt trading opportunityXLMUSDT has exhibited a breakout from a falling wedge formation, the price is anticipated to perpetuate its antecedent bullish trajectory.
We have demarcated a specific zone on the chart that we refer to as the 'bull important zone.' This region is earmarked for its potential as an accumulation zone. The rationale behind selecting this area is grounded in its historical significance where the price has found robust support, thus offering an attractive risk-reward ratio for long entries.
Risk management protocols dictate that a stop loss be judiciously placed below the recent all-time low (ATL) at approximately $0.0703 to safeguard against unforeseen bearish reversals and to preserve capital.
The proximate objective for this trading setup is delineated as the 'immediate setup target' on our chart.
We greatly value your active participation and feedback on our analysis. Your likes are the motivation that sustains our commitment to providing insightful market analysis.
Thank you for your engagement and support.

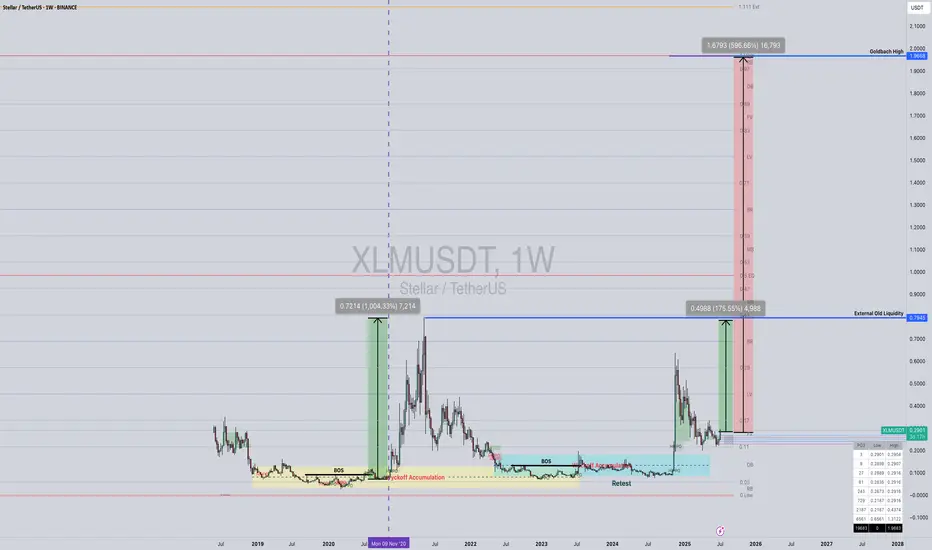
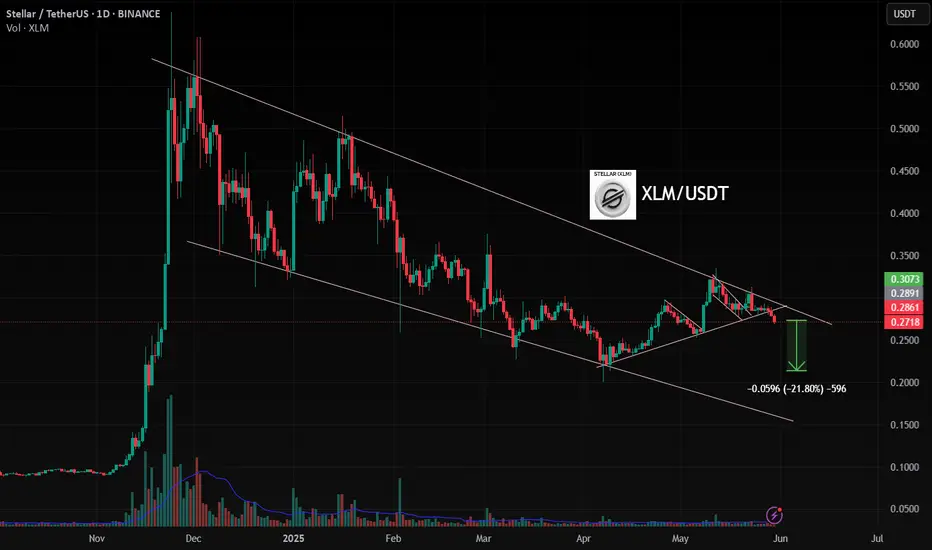
XLMUSDT SPOT PLAY – LORD MEDZ JOURNAL UPDATEFramework: SMC x Goldbach | Chart TF: 1W | Asset: Stellar (XLM)
📆 Update Date: July 2025
📌 Disclaimer: This is for journaling purposes only. Not financial advice. DYOR.
🔍 Observing the Macro: The Wyckoff Legacy Lives On
Looking left on the weekly chart, Stellar (XLM) executed a textbook Wyckoff Accumulation structure back in November 2020, forming a solid base at the lows. That structure didn’t just sit there — it sponsored a 1,004% rally, breaking key structure and running external liquidity with clean aggression.
What makes this setup particularly compelling in 2025 is the retest narrative. Price has gradually retraced back into the original demand zone, revisiting that same accumulation origin — not with panic, but with controlled compression and absorption.
Following this retest, XLM has already begun an impressive move away from the zone, signaling potential for continuation.
📈 Current Playbook Setup
✅ Demand Revisit: Price has returned to the very zone that birthed the 2020 pump — a validated origin of strength.
✅ Break of Structure (BOS) occurred earlier this cycle, confirming accumulation completion.
✅ Retest of Accumulation Range happened cleanly, just before this fresh impulse.
From an SMC and Goldbach lens, this is a premium long-term opportunity for spot holders, not futures traders. The structure, timing, and liquidity align for a macro bullish leg.
🎯 Targets of Interest
🟦 External Old Liquidity at $0.79 – First major target, where past wicks were left unchallenged.
🔺 Goldbach Projected High at $1.96 – Ultimate macro target, representing a potential +596% move from current levels.
This aligns with the Goldbach model’s high-probability expansion zones and historical confluence levels, not just speculation.
🧠 Conclusion & Outlook
We’re now in a phase where smart money has loaded, the latecomers haven’t arrived yet, and the chart is whispering re-accumulation. This is shaping up to be the second great leg of the XLM cycle, potentially echoing the 2020–2021 explosion.
The move away from demand has begun. The targets are mapped.
As always: no leverage, no noise — just spot and time.
📓 Lord MEDZ Signing Off
✍️ This post is part of my private trading journal and is not financial advice. Always do your own research (DYOR).
🔒 This setup is for SPOT HOLDING — not futures trading.
XLM/USDT;FREE SIGNALHello friends🙌
Given the good price growth, you can see that the price has entered a channel, which has caused the price to form a flag...
Now, with a strong channel breakdown by buyers and their entry, you can enter the trade with risk and capital management and move with it to the specified targets.
🔥Join us for more signals🔥
*Trade safely with us*
From Resistance to Support: XLM Sets the StageXLM had been consolidating under a descending trendline since early 2025. But today, we saw a strong breakout backed by solid momentum.
What’s even better?
It flipped a key resistance zone into support — classic breakout, retest setup.
If bulls hold this level, the next leg up could be explosive.
DYOR, NFA
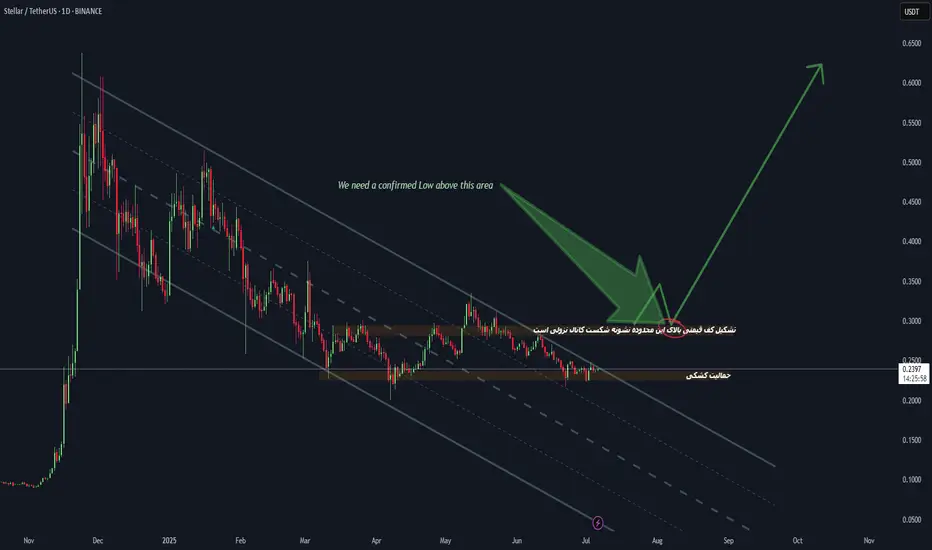
Stellar (XLM) Price Analysis - Potential Breakout ScenarioThis chart provides a technical analysis of Stellar (XLM) against Tether (USDT) on a daily timeframe, highlighting a potential breakout scenario. The price has been trending downward, approaching a key support area. The green arrow indicates a possible upward movement if a confirmed low is established below the highlighted zone. Key levels to watch include the support at around 0.2396 and the resistance trendline. Analysis conducted on TradingView as of July 06, 2025, 10:33 AM BST.
XLM ,1DAs BTC is Falling And BTC is given Breakout of Pattern in 4Hr , then Remaining coins will also fall drastically .
in 1D pattern of XLMUSDT , it is Breaking Down as BTC is also given Break Down of Pattern
Follow for More Ideas like This
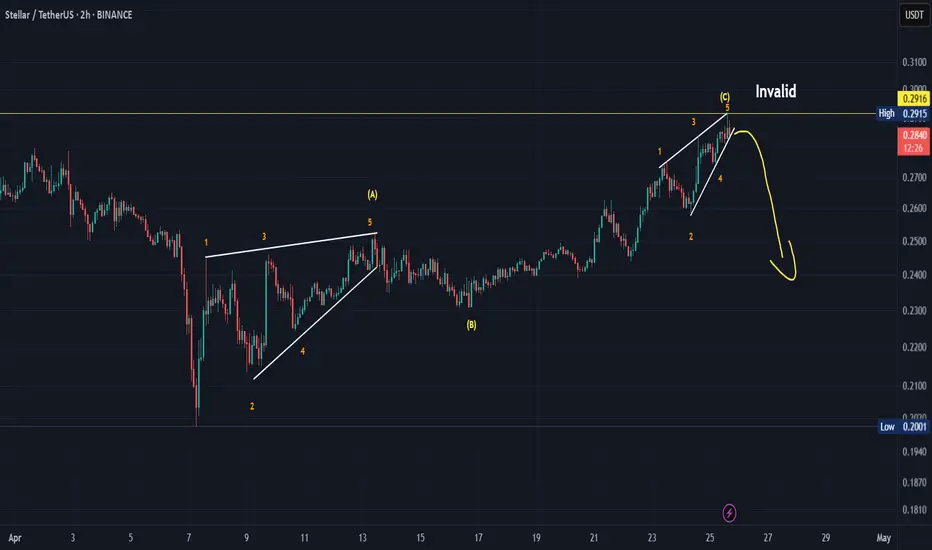
Coming down!I see three corrective waves in front of me that have been completed and concluded with an ending diagonal pattern. Please be careful of the possible upcoming decline.
*In principle, I am not a supporter of any direction, but I am only giving my point of view, which may be right or wrong. If the analysis helps you, then this is for you. If you do not like this analysis, there is no problem. Just ignore it. My goal is to spread the benefit. I am not one of the founders of the currency.
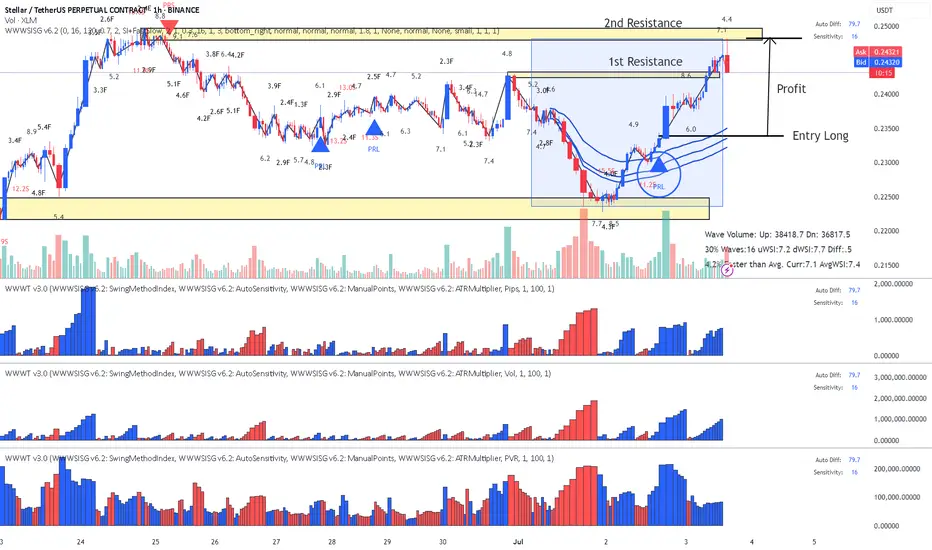
XLM Stellar Long Closed on 2nd ResistanceBased on previous entry explanation posts
Trade was closed with nice profit on second resistance which happen to touch it right on US non Farm news.
Enjoy!
XLM Stellar - Lesson 15 did the jobBased on previous idea explaining the entry Long.
I have moved stop to profit and we have two Resistance levels to surpass or not. According to the details on this levels I will close or let it run.
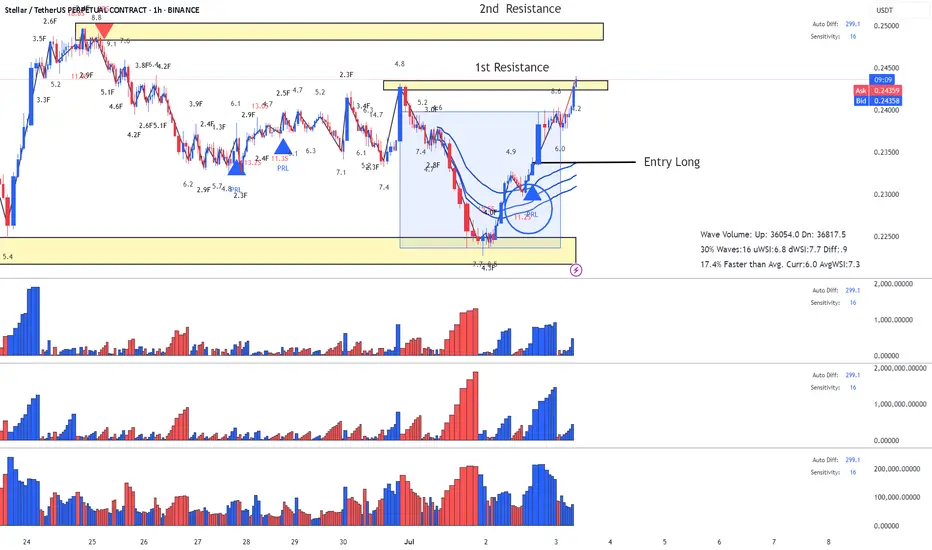
XLM Stellar - Classic Lesson 15 said Long Lesson 15 methodology (annotations in sync with the chart):
1. Support (this where buyers can come in)
2. Largest dn volume wave after a while - Look left - buyers came in previously at the same location.
3. Placed AVWAP and waited for price to cross upwards and pullback again on AVWAP
4. Entry signal PRL with abnormal SI 11.2 (price has a hard time to move down - absorption) after the pullback and that's our entry.
Enjoy!

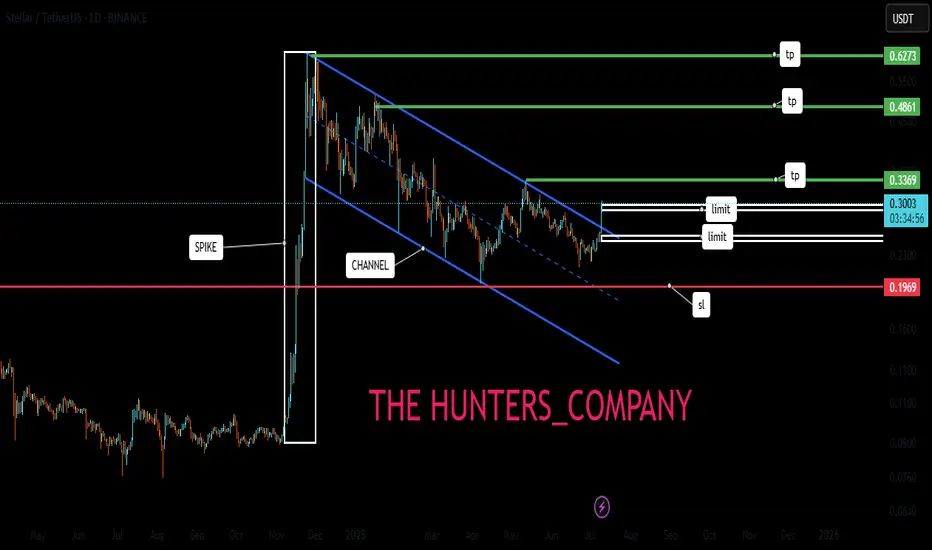
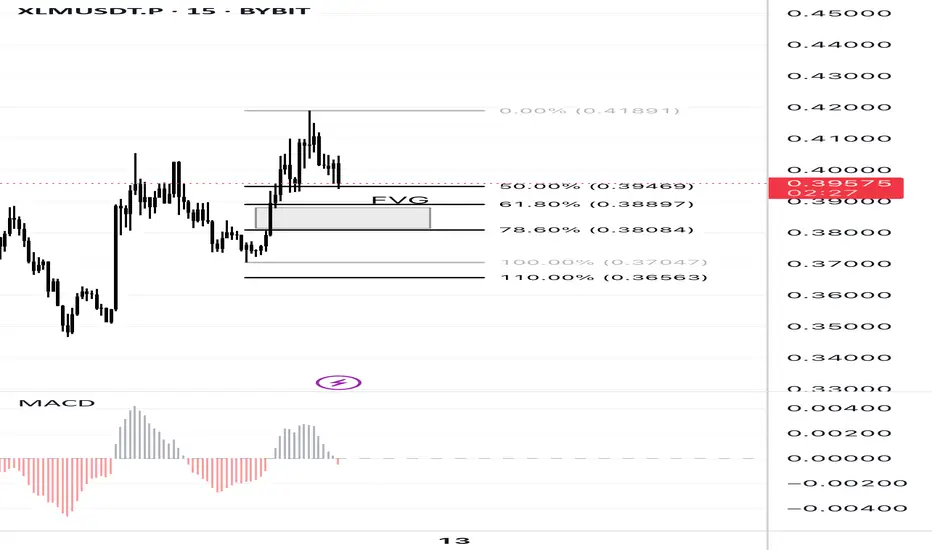
XLMUSDT.P – Fibonacci Buy Zone & Fair Value Gap Alignment (KT FuKT Digital Asset Hedge Fund Strategy Setup – 15m Chart
This idea shows a potential long opportunity using the KT Fund’s intraday Fibonacci trend entry system, which aligns confluence zones with strict SL/TP rules:
XLM wait for entryXLM tends to show strong volatility and often moves ahead of the broader market during BTC rallies.
We're monitoring for a retracement and a potential rebound from a significant support level.
Disclaimer:
This analysis is based on my personnal views and is not a financial advice. Risk is under your control.
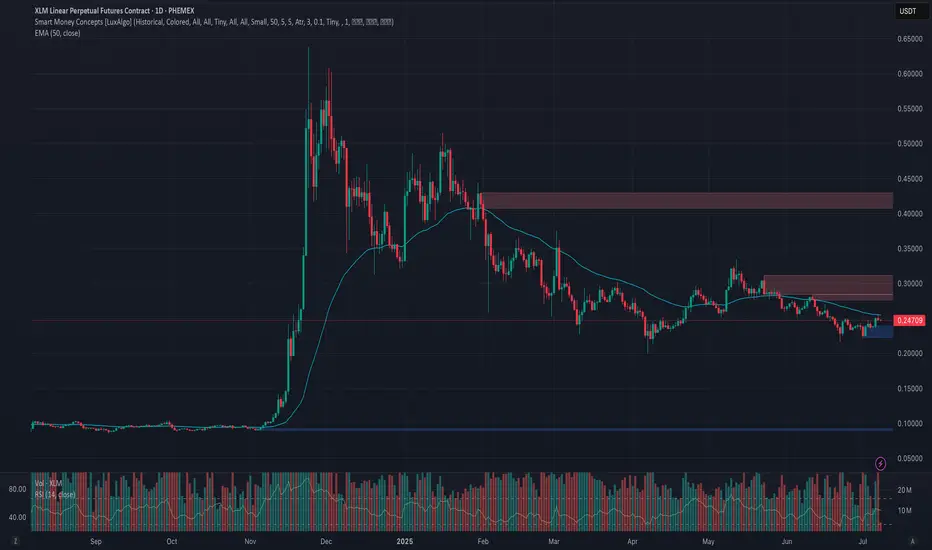
Phemex Analysis #95: Pro Tips for Trading Stellar (XLM)Stellar ( PHEMEX:XLMUSDT.P ) is an open-source, decentralized blockchain platform specializing in fast, affordable cross-border transactions aimed at enhancing global financial inclusion. Its native cryptocurrency, Lumens (XLM), serves as a bridge for currency exchanges and is used to pay transaction fees on the network. Founded in 2014 by Jed McCaleb, Stellar connects banks, payment systems, and individuals worldwide, providing seamless and cost-effective financial interactions.
Recently, Stellar has shown positive market momentum, including a notable 5% price surge coupled with increased transaction volumes. A key catalyst for this optimism is PayPal’s upcoming integration of its stablecoin PYUSD onto the Stellar blockchain, significantly expanding Stellar's real-world use case and accessibility across more than 170 countries.
Given these promising developments, let’s explore several possible trading scenarios to help traders strategically approach XLM.
Possible Scenarios
1. Breakout Rise to $0.28 and Above (Bullish Scenario)
On the daily chart, XLM recently formed a clear "cup and handle" pattern, with the handle emerging around June 22. This classic bullish indicator signals accumulation of buying momentum. If XLM decisively breaks out above the critical resistance level at $0.257, particularly with strong trading volume, it could confirm a bullish continuation, potentially targeting resistance zones around $0.28, $0.312, and even the significant resistance at $0.43.
Pro Tips:
Entry Point: Consider entering positions after confirming the breakout above $0.257, ideally with significant volume confirmation.
Profit-Taking Levels: Aim to take partial profits at key resistance levels: $0.28, $0.312, and $0.43.
2. Rejection by Key Resistance Levels (Neutral Scenario)
While the immediate resistance at $0.28 is relatively weak and likely to be overcome easily, subsequent resistance at $0.312 and particularly at $0.43 could present strong selling pressure, potentially rejecting XLM’s first attempt.
If rejection occurs, the price will likely retrace to retest support zones, such as around $0.25, consolidating before attempting another bullish move.
Pro Tips:
Cautious Entries: If initial rejections occur at higher resistance zones ($0.312 or $0.43), consider waiting for price stabilization around lower support areas ($0.25) before re-entering.
Volume Check: Closely monitor trading volumes during retracements—declining volume often indicates a healthy pullback rather than a significant reversal.
3. All Things Go South (Bearish Scenario)
If broader market sentiment suddenly turns sharply negative—particularly driven by a significant decline in Bitcoin—XLM could face substantial selling pressure. A sharp drop below key support at $0.216 with high volume, accompanied by broader market downturns, would signal serious bearish momentum.
Pro Tips:
Market Observation: Stay cautious and consider stepping aside until clear stabilization occurs at lower support levels.
Accumulation Opportunities: Long-term holders should watch closely for stabilization at critical historical supports, including $0.20, $0.18, $0.12, and $0.09, which could offer attractive entry points for gradual accumulation.
Conclusion
Stellar (XLM) currently stands at a pivotal juncture driven by significant fundamental catalysts and compelling technical signals. By closely monitoring the outlined bullish, neutral, and bearish scenarios, traders can strategically position themselves for profitable trades while effectively managing risks. Always remain alert, employ disciplined risk management strategies, and stay informed on broader market movements to successfully navigate XLM’s market dynamics.
🔥 Tips:
Armed Your Trading Arsenal with advanced tools like multiple watchlists, basket orders, and real-time strategy adjustments at Phemex. Our USDT-based scaled orders give you precise control over your risk, while iceberg orders provide stealthy execution.
Disclaimer: This is NOT financial or investment advice. Please conduct your own research (DYOR). Phemex is not responsible, directly or indirectly, for any damage or loss incurred or claimed to be caused by or in association with the use of or reliance on any content, goods, or services mentioned in this article.
Stellar (XLM): Possible Buying Opportunity | Price Near SupportStellar coin has been forming some sort of bullish trend, where price has reached the lower side of that trend where buyers took over the area.
Now we are looking for that same momentum to continue and break the EMAs, which would then lead the price towards the upper side of the bullish trend.
Swallow Academy
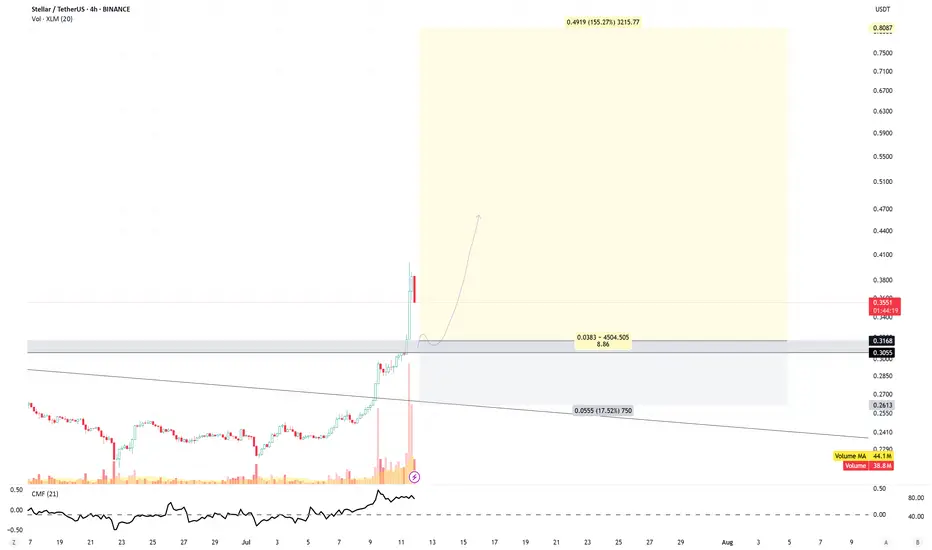
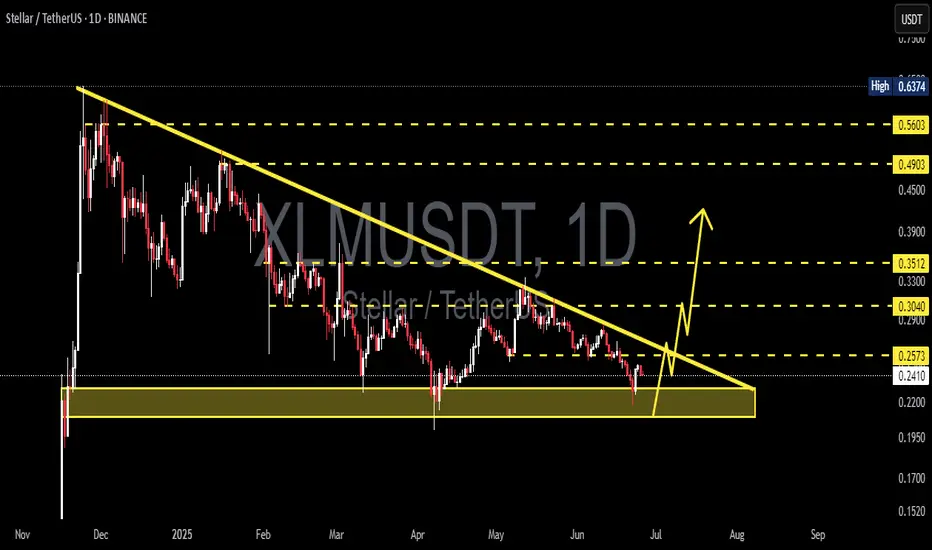
XLM Breakout Alert – Hidden Gem About to Explode?XLM/USDT is showing signs of a potential breakout from a long-term descending trendline that has been in play since November 2024. Price recently rebounded from a key demand zone (highlighted in yellow), suggesting strong buying interest at lower levels.
📉 Descending Trendline Resistance
The pair has consistently respected a strong downward trendline, rejecting all breakout attempts—until now. Price action is tightening near the apex, increasing the probability of an upward breakout.
🟨 Key Demand Zone
The $0.2150 - $0.2410 area has proven to be a strong accumulation zone, providing a solid foundation for a potential reversal. Price has shown multiple bullish reactions from this area.
📈 Upside Targets Upon Breakout Confirmation: If a confirmed breakout occurs, the following resistance levels can serve as potential profit-taking targets:
$0.2573 (breakout confirmation zone)
$0.3040
$0.3512
$0.4903
$0.5603
📌 Ideal Scenario:
Potential long entry after a confirmed breakout and retest of the trendline (~$0.25 - $0.26)
Stop loss below the demand zone (~$0.2150)
Attractive risk-to-reward setup with minimum 30% upside potential.
⚠️ Note: Wait for confirmation before entering the trade. Be cautious of false breakouts, especially under high market volatility conditions.
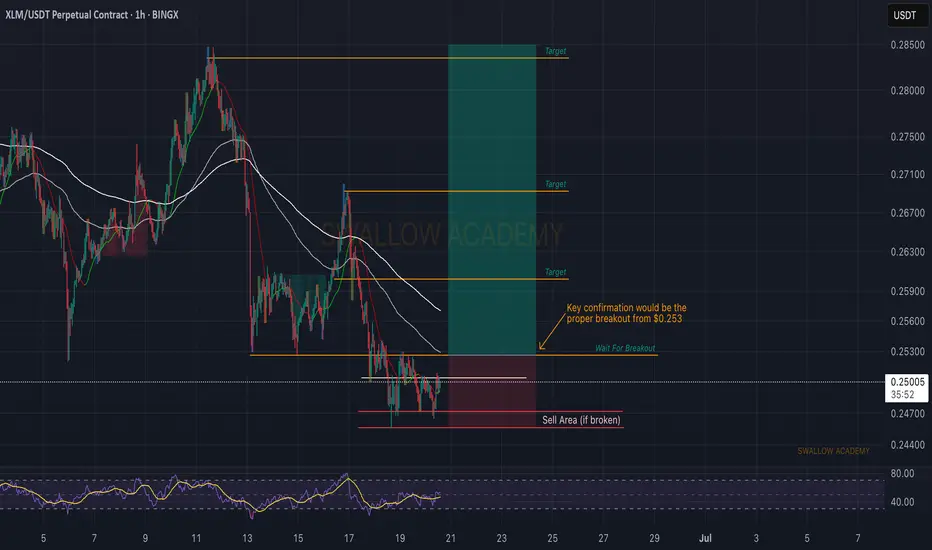
Stellar (XLM): Waiting For Breakout | Good Risk:RewardStellar coin is in an early stage for potential good upward movement from here. We see some kind of buyside volume forming here, which could give us a proper breakout, which we are waiting for.
As soon as we get it, we will be longing for $0.253.
Swallow Academy