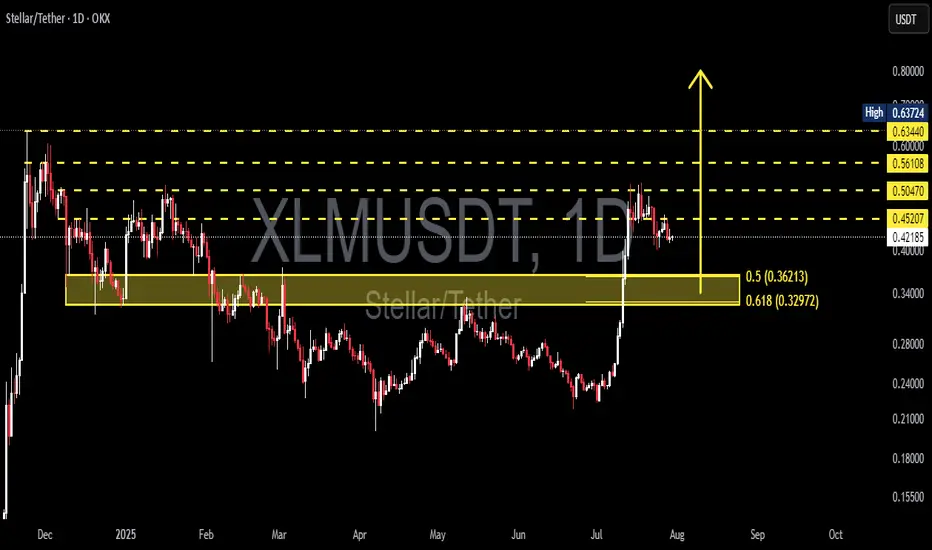
"Stellar XLM will definitely reach 0.6389."" Stellar (XLM) is expected to begin its upward move from the price zones of 0.3375, 0.3153, and 0.2822, heading toward the confirmed targets of 0.5215 and then 0.6389.
While the exact starting point may vary slightly, the targets at 0.5215 and 0.6389 are considered certain." BINANCE:XRPUSDT
Related pairs

Long XLMBTC is bouncing from a strong support.
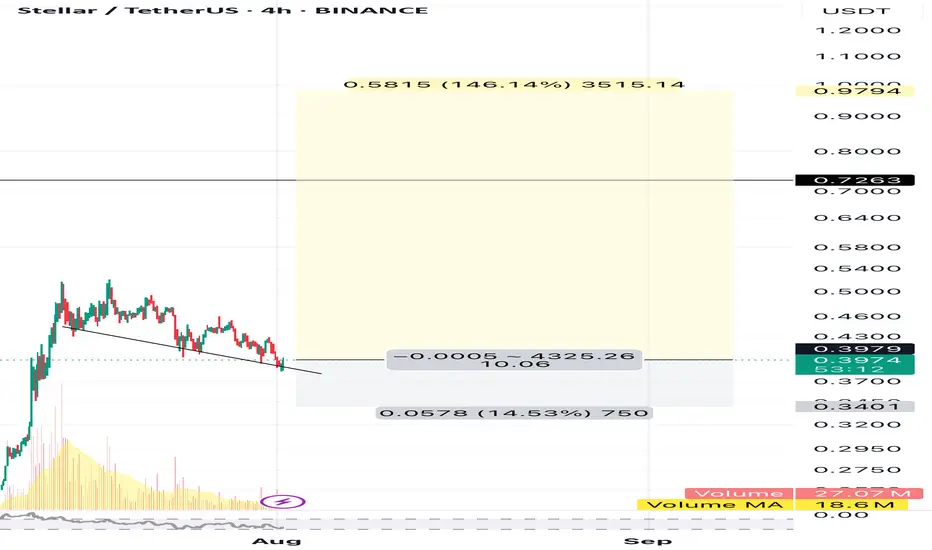
XLM would have another leg up from the local support trendline.
Trade setup is as in chart.
XLMUSDT – Accumulation Phase or the Start of a Major Breakout?🔍 Market Overview:
Stellar (XLM) against USDT is showing a technically significant structure. After breaking above a long-standing consolidation zone, price is now in a mild corrective phase, retesting previous resistance as new support. This setup suggests a critical decision point — will XLM conf
XLMUSDTXLMUSDT From the specified range (of course, now) it should reach the price of 0.5169, in the middle of the way it will correct at the price of 0.3755 and then it will rise towards the target, this is certain
Market geometry is right
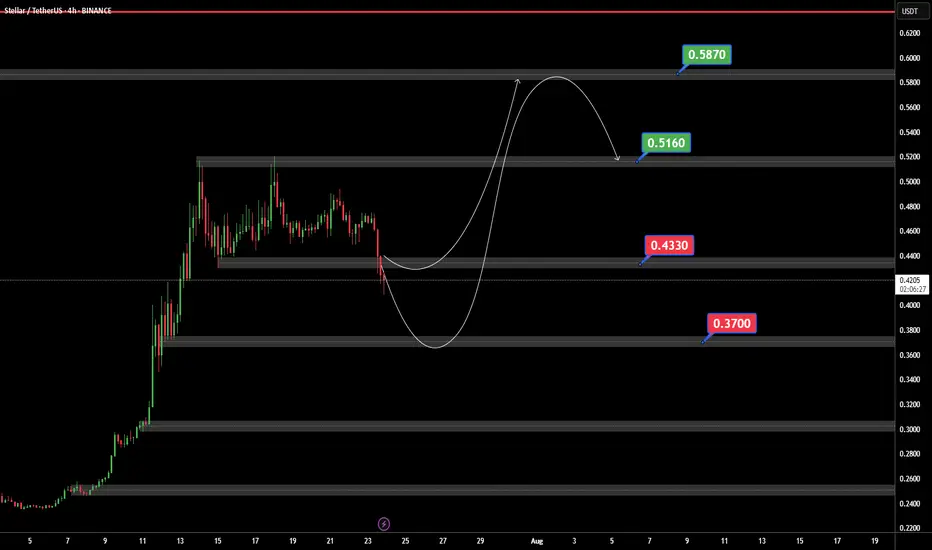
XLMUSDTIf BINANCE:XLMUSDT can support 0.4430 $ ready for jump to 0.5160 and best target in 0.5873 $.
But if XLM can price breaked 0.4330$ support we ready for a bear trend.
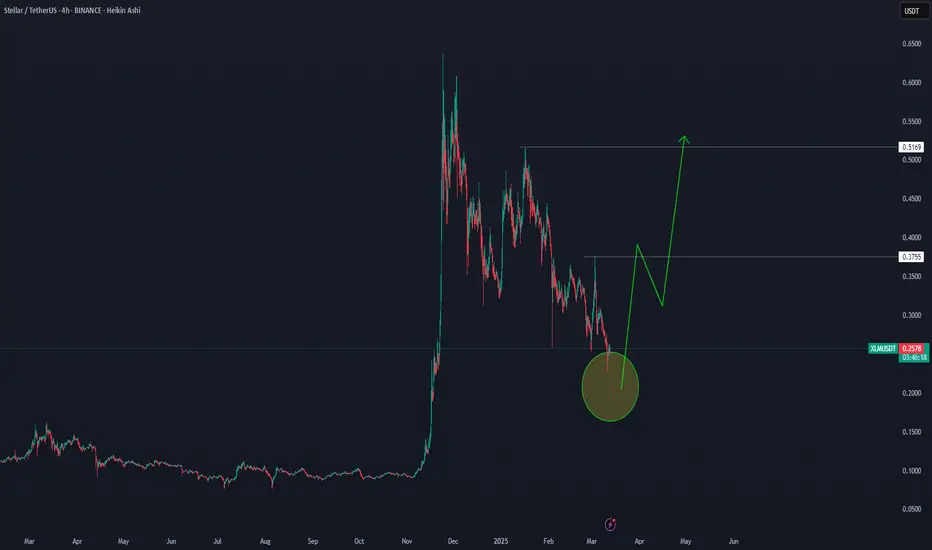
XLMUSD LongWe´ve completed a 5wave corrective structure and just started another bullish 5wave structure.
I expect a correction on lower timeframe to confirm the end of the 1st wave and will enter Long trade at the breakout

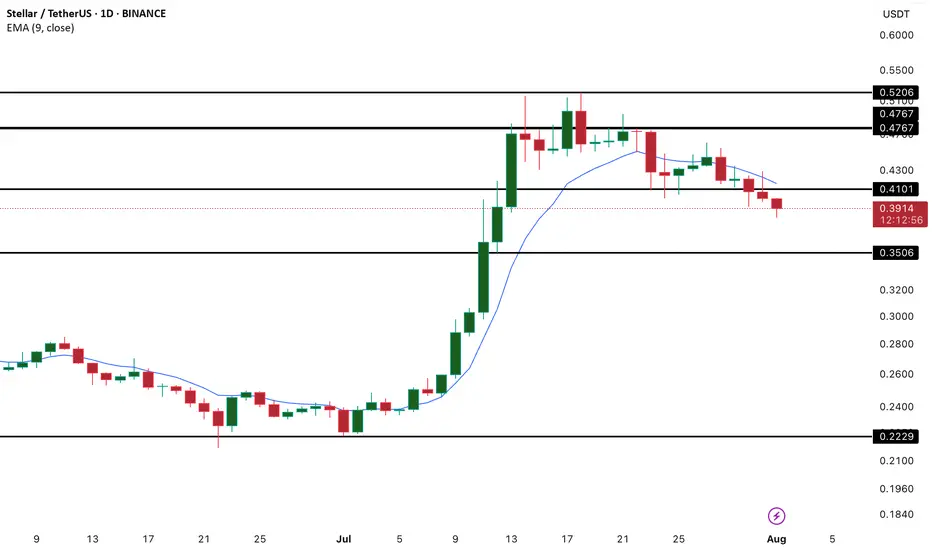
XLM/USD Analysis – Bearish Momentum Builds Below 20-Day EMA
XLM has taken a notable hit, with recent price action showing a sharp drop that has dragged the token below its 20-day Exponential Moving Average (EMA). Currently sitting at $0.40, the 20-day EMA now acts as a dynamic resistance level, capping potential upside in the short term.
This development s

STELLAR LUMENS - DOLLAR COST AVERAGE FOR LONG TERM GAINSSTELLAR LUMENS (XLM) has taken off late 2024 from under .10 cents and now trading at .40 cents for a 400% Gain in 6 months so far, and there is much more upside to come potentially. It hit all time highs around .50 cents and now the token seems to want to test those highs in the near term 2025, we c

XLMUSDT 1H Market OutlookBINANCE:XLMUSDT
Trade Setup:
Target 1: 0.4513
Target 2: 0.4872
Target 3: 0.5231
Target 4: 0.1808
Stop Loss: 0.3795
Pattern: The chart indicates a "CHOCH" (Change of Character) pattern, suggesting a potential trend reversal or continuation depending on context.
Trend: Recent price acti

See all ideas
Summarizing what the indicators are suggesting.
Oscillators
Neutral
SellBuy
Strong sellStrong buy
Strong sellSellNeutralBuyStrong buy
Oscillators
Neutral
SellBuy
Strong sellStrong buy
Strong sellSellNeutralBuyStrong buy
Summary
Neutral
SellBuy
Strong sellStrong buy
Strong sellSellNeutralBuyStrong buy
Summary
Neutral
SellBuy
Strong sellStrong buy
Strong sellSellNeutralBuyStrong buy
Summary
Neutral
SellBuy
Strong sellStrong buy
Strong sellSellNeutralBuyStrong buy
Moving Averages
Neutral
SellBuy
Strong sellStrong buy
Strong sellSellNeutralBuyStrong buy
Moving Averages
Neutral
SellBuy
Strong sellStrong buy
Strong sellSellNeutralBuyStrong buy
Displays a symbol's price movements over previous years to identify recurring trends.
Frequently Asked Questions
The current price of XLM / UST (XLM) is 0.39509000 USDT — it has fallen −2.52% in the past 24 hours. Try placing this info into the context by checking out what coins are also gaining and losing at the moment and seeing XLM price chart.
XLM / UST price has fallen by −3.46% over the last week, its month performance shows a 69.72% increase, and as for the last year, XLM / UST has increased by 347.36%. See more dynamics on XLM price chart.
Keep track of coins' changes with our Crypto Coins Heatmap.
Keep track of coins' changes with our Crypto Coins Heatmap.
XLM / UST (XLM) reached its highest price on May 16, 2021 — it amounted to 0.79729000 USDT. Find more insights on the XLM price chart.
See the list of crypto gainers and choose what best fits your strategy.
See the list of crypto gainers and choose what best fits your strategy.
XLM / UST (XLM) reached the lowest price of 0.07022500 USDT on Dec 29, 2022. View more XLM / UST dynamics on the price chart.
See the list of crypto losers to find unexpected opportunities.
See the list of crypto losers to find unexpected opportunities.
The safest choice when buying XLM is to go to a well-known crypto exchange. Some of the popular names are Binance, Coinbase, Kraken. But you'll have to find a reliable broker and create an account first. You can trade XLM right from TradingView charts — just choose a broker and connect to your account.
Crypto markets are famous for their volatility, so one should study all the available stats before adding crypto assets to their portfolio. Very often it's technical analysis that comes in handy. We prepared technical ratings for XLM / UST (XLM): today its technical analysis shows the neutral signal, and according to the 1 week rating XLM shows the buy signal. And you'd better dig deeper and study 1 month rating too — it's strong buy. Find inspiration in XLM / UST trading ideas and keep track of what's moving crypto markets with our crypto news feed.
XLM / UST (XLM) is just as reliable as any other crypto asset — this corner of the world market is highly volatile. Today, for instance, XLM / UST is estimated as 5.29% volatile. The only thing it means is that you must prepare and examine all available information before making a decision. And if you're not sure about XLM / UST, you can find more inspiration in our curated watchlists.
You can discuss XLM / UST (XLM) with other users in our public chats, Minds or in the comments to Ideas.