XLM is about to leave the triangle.XLM is struggling to maintain the $ 0.24 level. We approach the exit of the triangle, we should observe the direction in which we leave the designated zone. Another support at $ 0.20. in the case of a downward move. If the XLM begins to gain strength, it may attack the price of $ 0.275.
XLMUST trade ideas

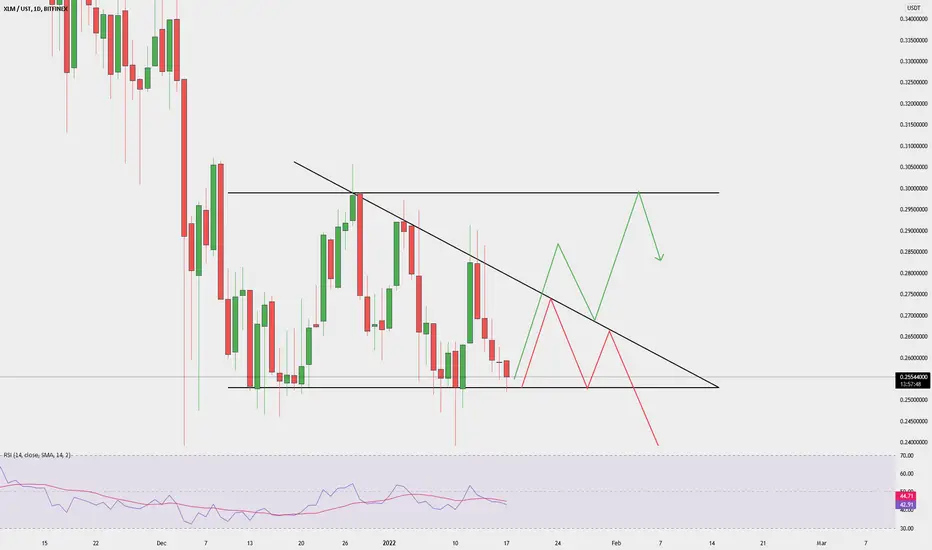
STELLAR - Final Short Or Breakout?? 🚨Stellar is approaching a very interesting level where we may see a breakout or we may reject for the final time to reach our ideal buy area of 0.20.
SHORT Trade idea:
- Watch for lower timeframe trendline break
- Enter with stops above recent high
- target the 0.20
Breakout Trade Idea:
- Watch for a break of the descending black trendline
- Wait for a pullback and then enter with stops below the most recent rejection
- Targets: 0.43, 0.80
Goodluck!

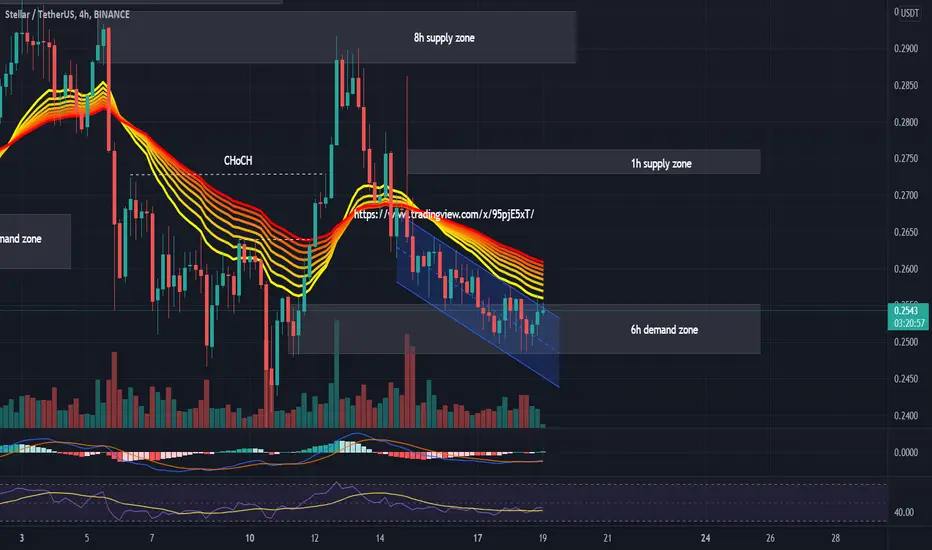
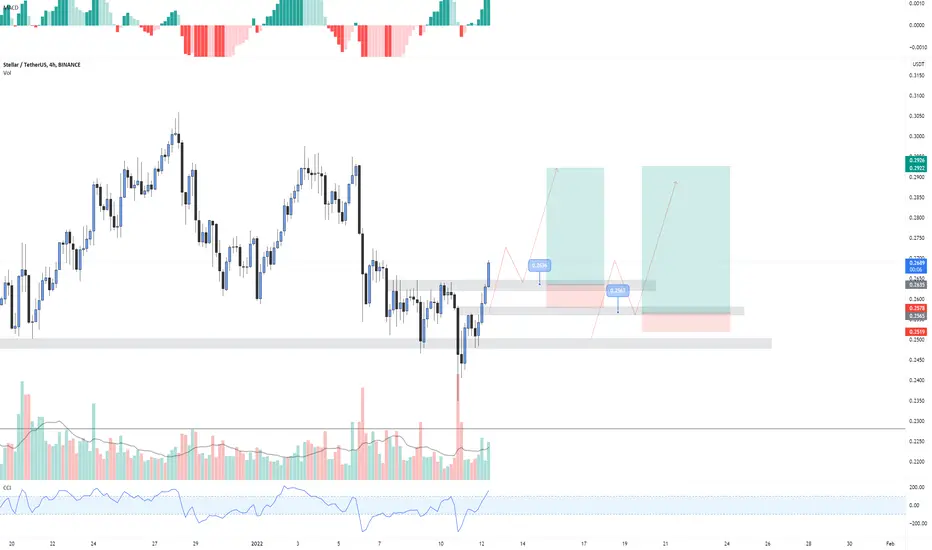
#XLMUSDT 4H ChartPrice is still ranging inside the descending channel however it is inside a major demand zone. MACD is not clear, RSI is below 50% and EMAs are bearish. Price should break out the resistance line and move upwards from here aiming for the 1h supply zone as a short term target.
xlmusdtlol this scail just cant stop dropping, i tink this is the bottom for this thing but myight consider putting some scalp orders at 0.20 incase a flash crash, otherwise looks ok to bounce off at here
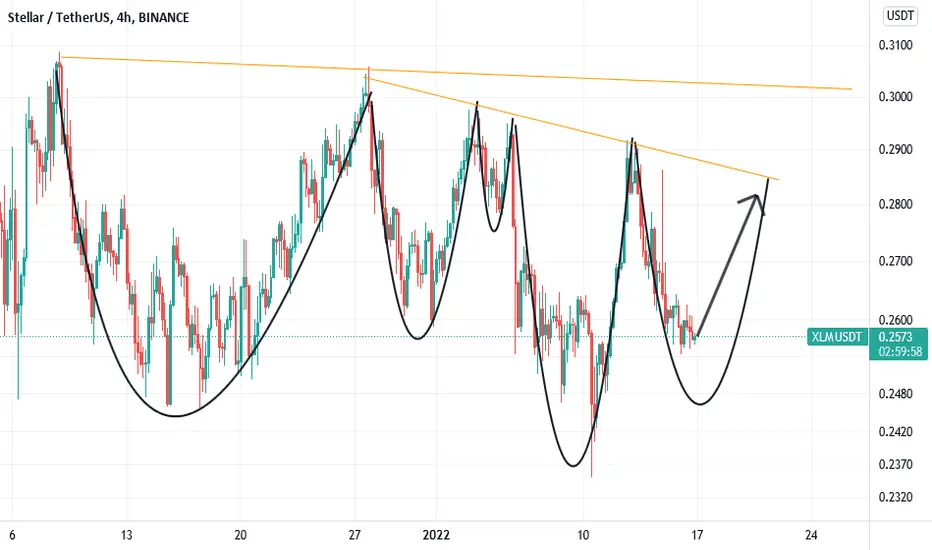
XLM is going up in days aheadThis pattern has happened in the past repeatedly and is expected to happen again this time
XLM - 4HR TF BIASQuick Review on XLM possible play.
Breaking structure on .2636 price and potential retracement on our key level support.
TAYOR.
XLMUSDT ideaMy thoughts on XLMUSDT.
For the moment :
- Momentum: nothing bullish on a daily basis.
- Structure: nothing confirmed on a daily basis
- Location: we are in a long term buy zone, but too high according to my criteria.
The reload zone 1 was used as an accumulation zone in December and early January. We may go back there, because for the moment the momentum is not good.
If we want to go higher, we need to break above 0.3050 with a daily candle close. Ideally with a conclusive retest.
If we break 0.2265 expect to visit the reload zone 2 which is an excellent entry. You can place orders now in this area to eat up liquidity in case of a crash.
Note : there is a hole in the volume profile between 0.26 and 0.19, it may attract the price like a magnet. It could be in a few days or in a month or more. But we'll get back to it.
TP : a bit early to say, but between 0.6485 and 0.5695 seems to be a logical area.

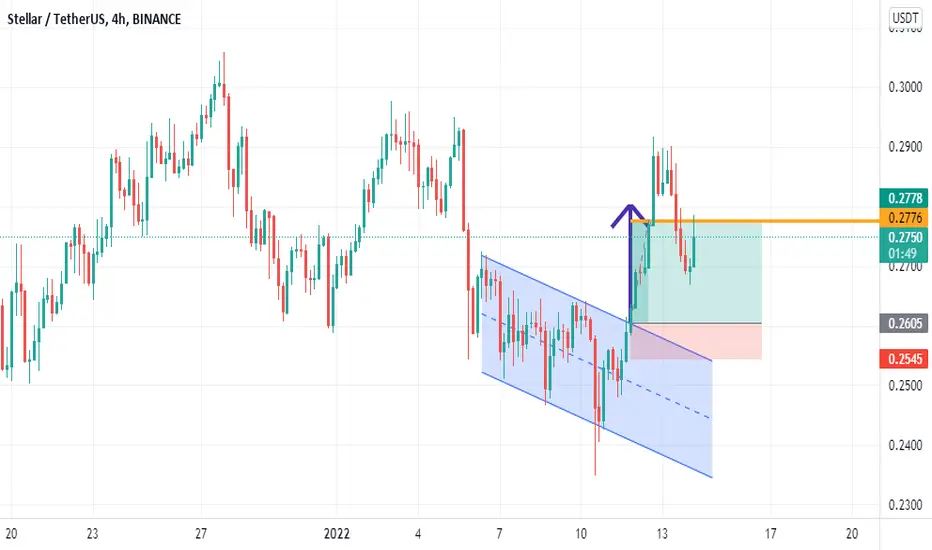
XLM----USDTDue to the breaking of the downward channel upwards, you are expected to increase the price as much as the height of the channel
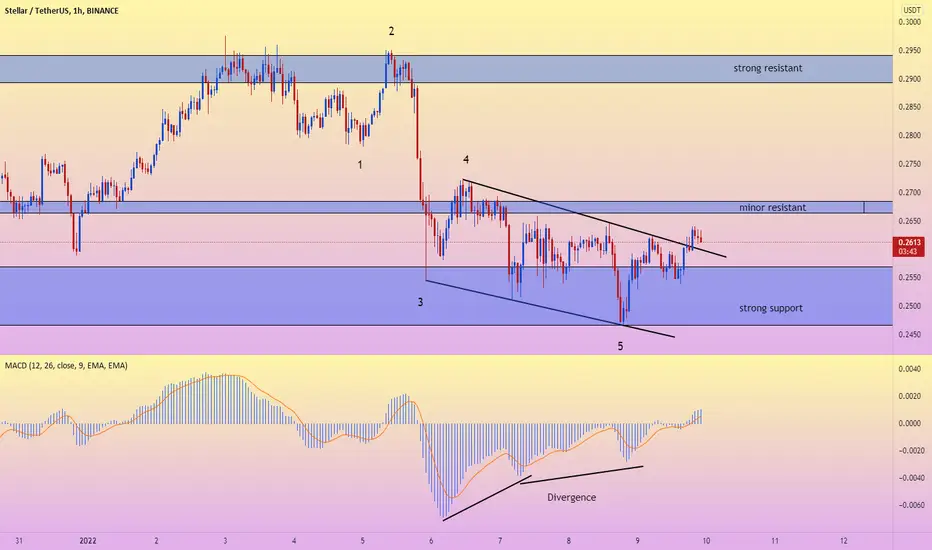
Divergence along with a good patternHello everyone
Before we start a discussion, it is my pleasure to read your opinion on this post's comment section and support this idea with your likes if you enjoyed it !
XLMUSDT :
Possible elliot count was shown in the chart.
please note that at wave 5 we have an ending pattern with a divergence between the price and MACD oscillator.
the evidence support an idea of possible upside short term trend.
the price breaks the ending pattern and triggers the long position.
please remember any analysis can be failed. so, manage your risk and respect your stop loss.
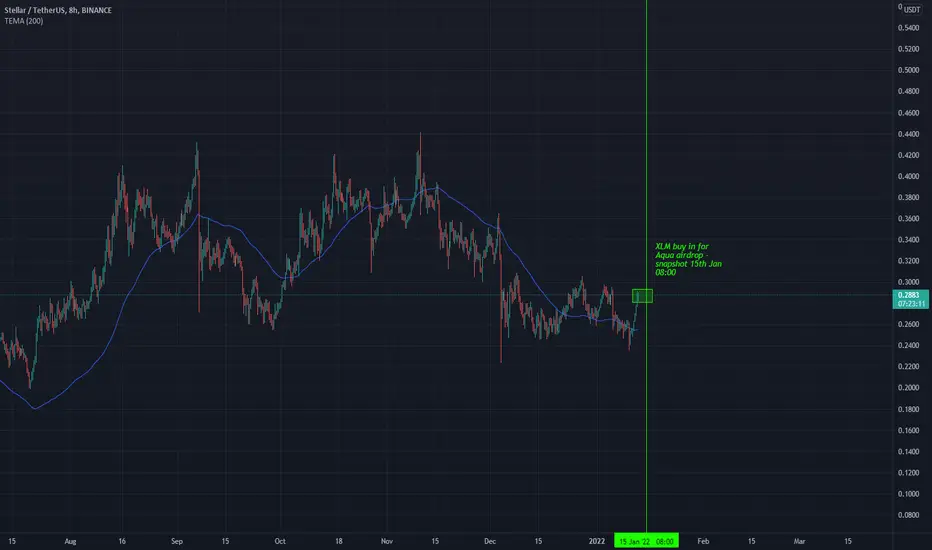
$XLM/$AQUA AirDrop - 15th Jan Interesting project - $AQUA - Liquidity provision for $XLM network -
$XLM stands to gain from expansion of Crypto to remittances market -
*AIRDROP#2*
Key Info:
15th Jan - 00:00 UTC - Snapshot of all relevant wallets.
Eligibility critera participants will need at time of snapshot:
Min 500 x $XLM in private wallet that allows claimable balances (Recommended wallets are LOBSTR, StellarX, StellarTerm, NiceTrade, Account Viewer, or Stellar Laboratory)
AND
Min 1x $AQUA
Participant will get share of 15 Billion $AQUA
Distribution will start on Feb 1, and be divided into equal portions and delivered over 3 yrs.
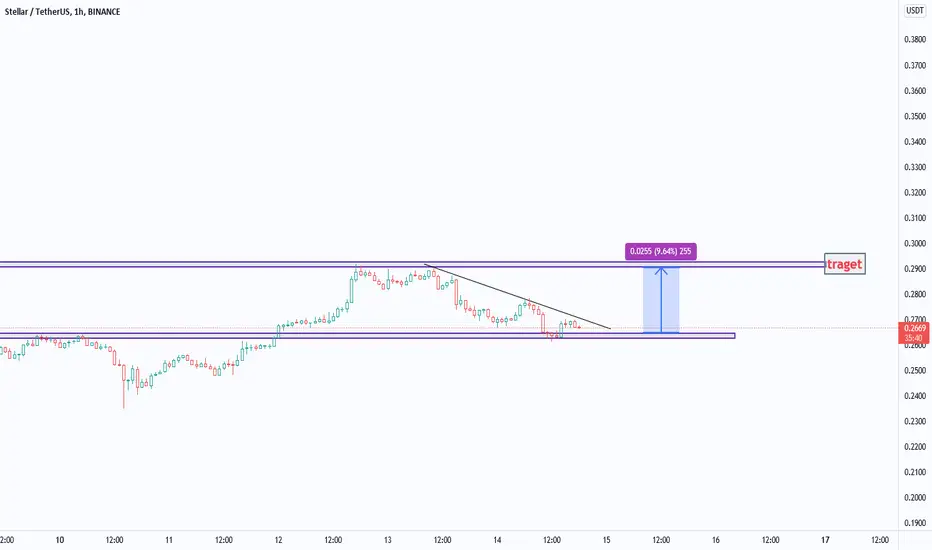
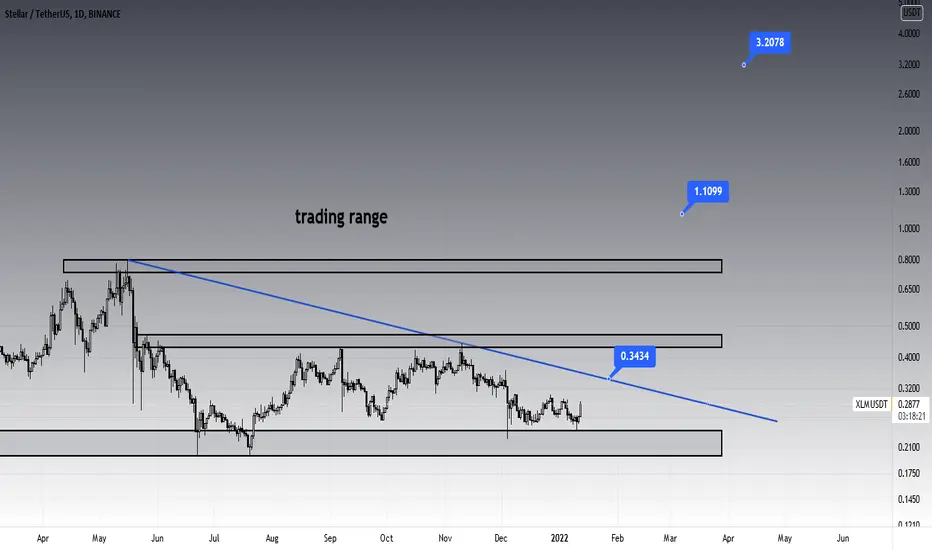
XLMUSDTThe price is in a large range and fluctuates in it, if the ceiling breaks, it can reach the price of $ 1.1 and finally $ 3.2.
This is if bitcoin is to grow well, otherwise this analysis will be flawed
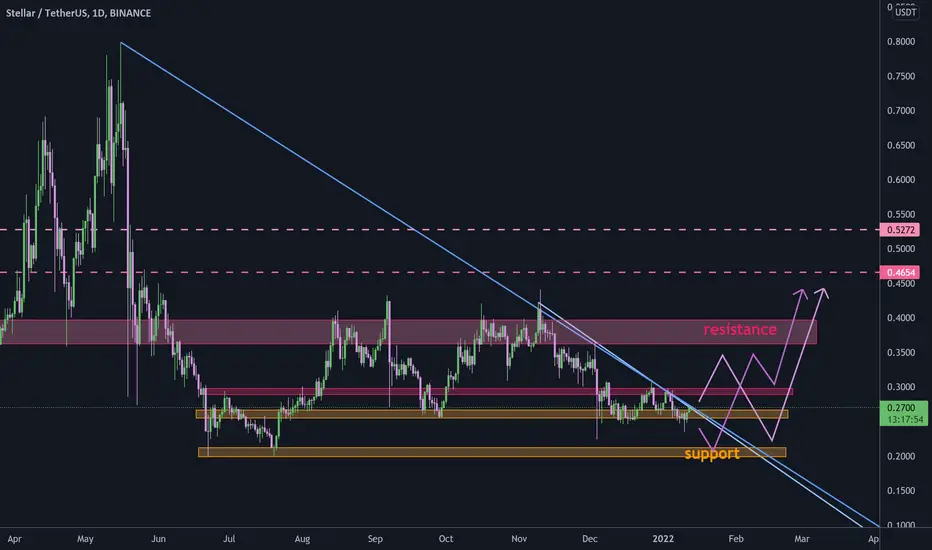
STELLAR IS TRADING IN RANGE RIGHT NOWHello my friends, today I want to talk with you about XLM.
Price is growing to upside of this range.
I'm waiting that Stellar can reach it soon and break.
If this will happen, we will have good signal to open new long position.
As a target we will have next two good levels (0.3650 and 0.4300).
This is article not financial advice, always do your own research.
If you have any questions, you can write it in comments below and I will answer them.
And please dont forget to support this idea with your like and comment, thank you.

XLM - Let's visit $0.25 - $0.24 againHi,
This is iJusctCoint, the one lucky trader who puts his money where his mouth is!
Crypto bounced from lower levels to test the resistance again. We have upward pressure on the 12H and 1D timeframes which is quite healthy.
I expect the price to comeback once again to the lower boundary to test the support.
I plan to capitalize on that potential move down my taking a short position.
Publication marked as NEUTURAL since we don't know our trend just yet.
We may establish a downtrend with a lower low and a lower high or may finally reverse.
I'll trade SHORT and reverse to LONG if support holds.
//
Chart Code:
Red Dashed Lines - Downwards reversal Momentum
Green Dashed Lines - Upwards Reversal Momentum
Green Rectangle - Buying Area
Red Rectangle - Selling Area
Yellow Dotted Lines - Estimate Timerange where price target might get hit
//
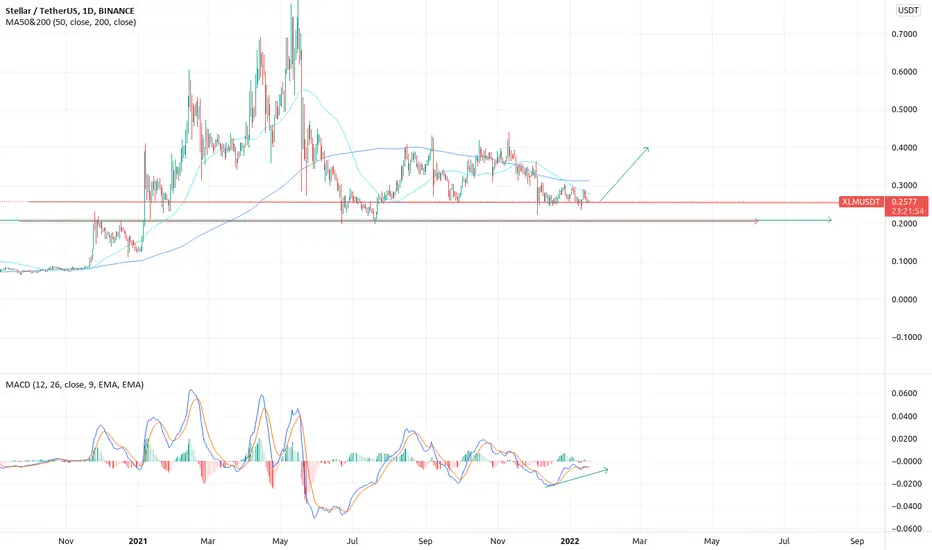
XLM try to break out long term resistance#XLM/USDT
$XLM is trading exactly below weekly and daily descending resistance lines.
if price break out from this descending resistance, it will increase to resistance zone between $0.36 and $0.39.
but if price reject from current descending lines, it will drop to support zone around $0.2 and then maybe try to break out from resistance.