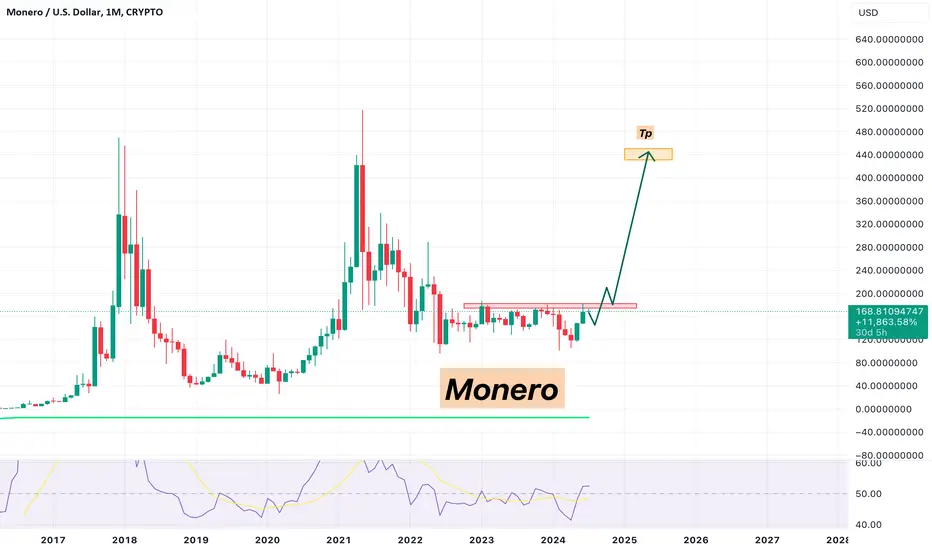
XMR/USD Poised for a Major Bullish Phase**XMR/USD Poised for a Major Bullish Phase**
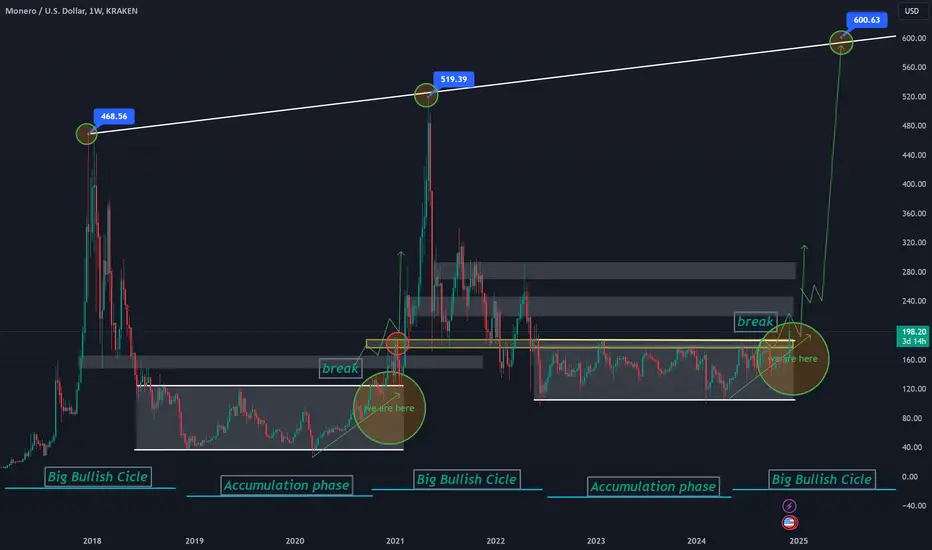
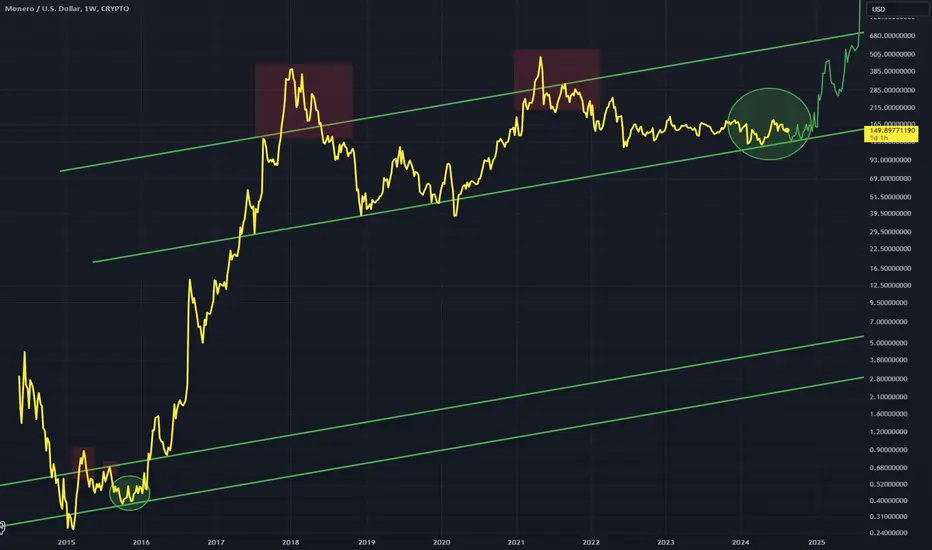
Monero (XMR/USD) has officially broken out of a prolonged **accumulation phase**, signaling the start of a powerful bullish cycle. After successfully breaching the key resistance zone between **$180-$210**—the upper limit of the previous major rally—XMR is now primed for a sustained upward trajectory. This breakout marks a critical turning point, underscoring growing investor confidence and heightened demand for privacy-focused digital assets.
With strong technical momentum and supportive macroeconomic conditions, XMR is expected to embark on a **significant rally**. The next few years could see progressive gains, culminating in a **new all-time high (ATH) of $600** by **May-June 2026**. This projection is fueled by increasing adoption of privacy coins, enhanced network upgrades, and broader market bullishness.
Investors should watch for consolidation phases along the way, but the overall trend points toward **long-term growth**. As Monero continues to carve out its position in the crypto market, this rally could establish a new price floor well above previous highs, reinforcing its strength and utility in a growing decentralized economy.
XMRUSD trade ideas
Dive into Monero (XMR): My Updated Strategy for Success! Monero, the top privacy-focused cryptocurrency, is drawing more attention as concerns about data security rise. If you're eyeing this promising coin, let me share my latest trading strategy and key levels! 🚀
📈 Why Monero?
As demand for anonymity grows, Monero stands out, offering robust privacy features and potential for strong growth. Here's how I’m navigating this opportunity:
📊 Trading Strategy Highlights
🔵 Buy Zone:
💰 165 - 175 – the sweet spot for entry!
🎯 Take-Profit Targets:
1️⃣ 200 – a steady climb.
2️⃣ 257 – solid gains ahead.
3️⃣ 340 – long-term potential unlocked!
🛑 Stop-Loss:
🚨 Set it at 149 to manage risk effectively.
🟩 Risk/Reward Ratio:
📈 1:7 – a setup with exciting upside potential.
🆘 Recommended trading volume: Allocate no more than 5-7% of your portfolio for this trade. 📝
Good luck, and may the market be in your favor! 🚀

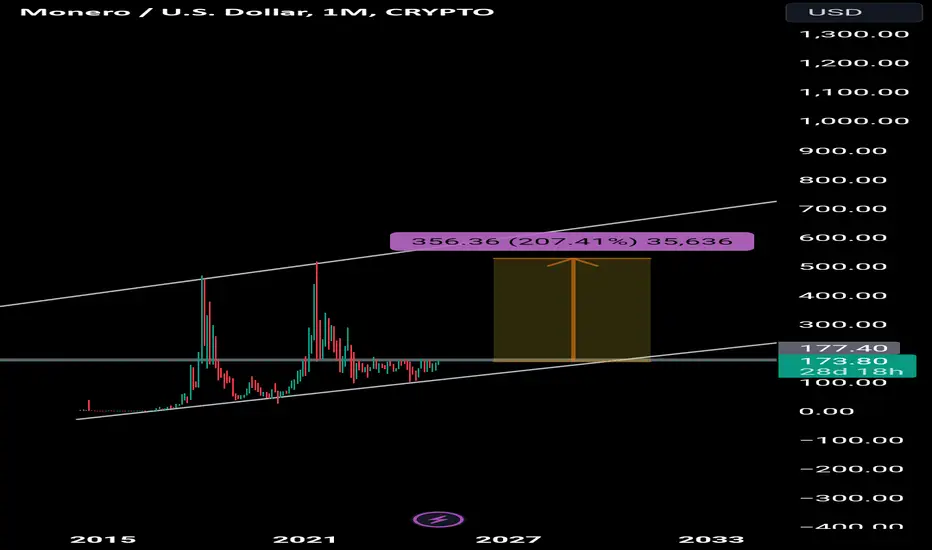
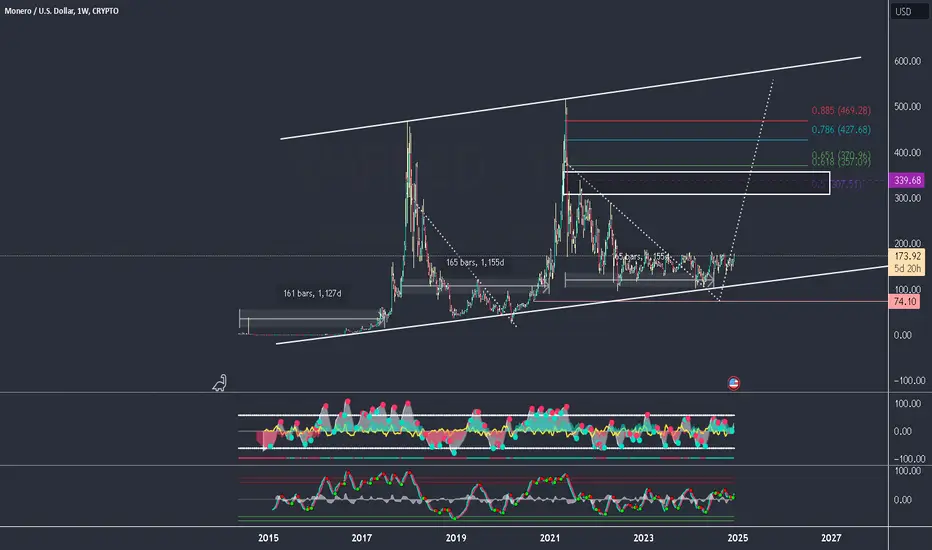
MONERO could get to $339 (+95%) soonMonero is looking very strong with several bullish signs that shows a possible 95% pump to above $339. The target is august 2021 highs, between 0,5% and 0,618% fibonacci levels and strong resistance.
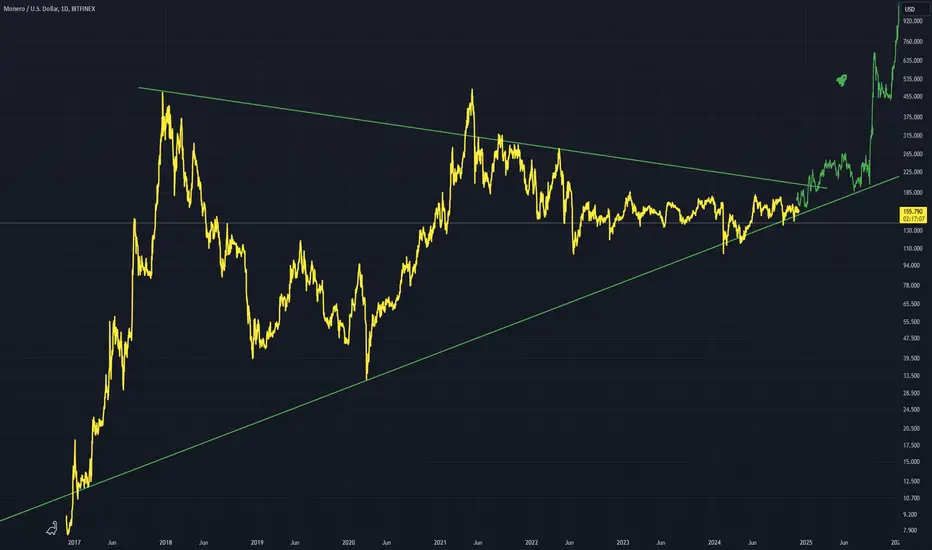
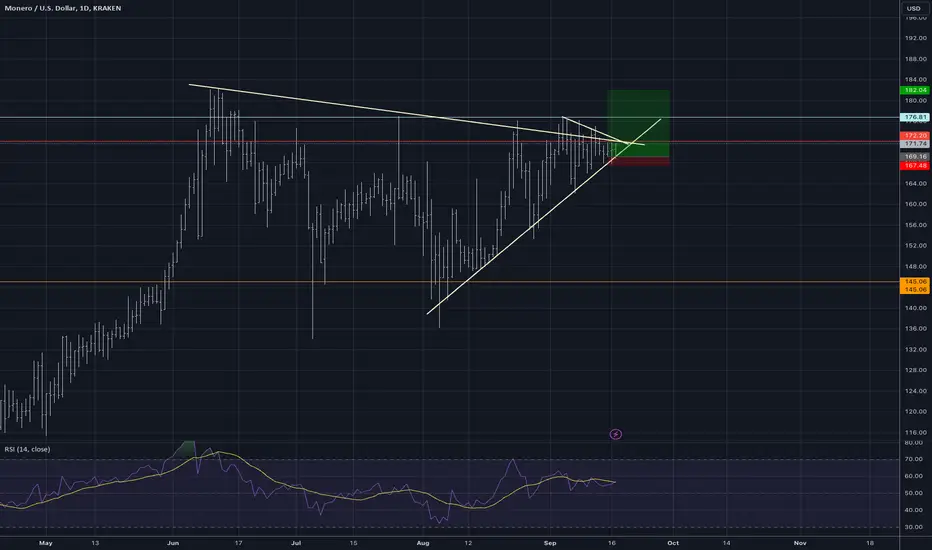
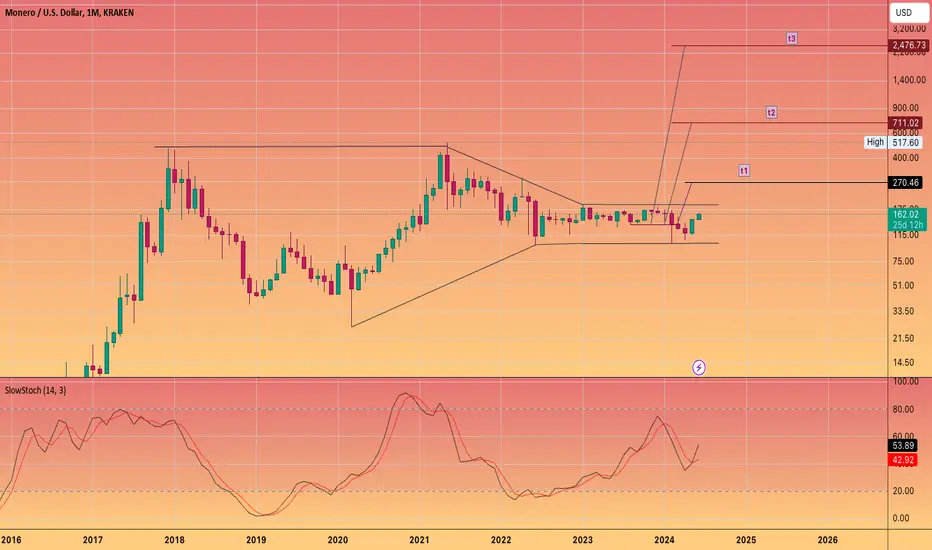
XMRUSD - Big Symmetrical TrianglePrice on this one has been moving sideways since 2022
I expect a strong break out of this larger overarching triangle during this alt season
The sideways movement provides a strong base or support to allow up movement
Daily timeframe
MoneroIt is a comparison of the previous situation before the strong pump. It can be seen that it has many similarities to this day.
Whether the golden circle will be achieved or not, I don't know but I'm waiting that.
Indicators in the update
MD


MONEROSome time ago I realized this insane structure as someone hardly knew about Monero. Yes nothing happened since then. But look at this weekly chart. If you have enough experience with trading you know that this is not a dead chart. I just wanna say "pay attention". Buy and forget. It's cooking. For some reason I don't even know.

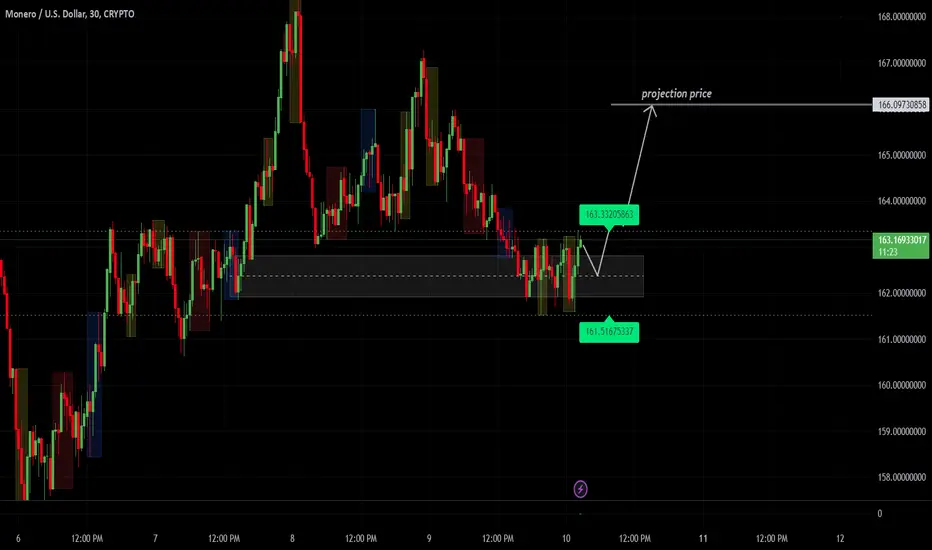
XMR Potential bullish breakout incoming?Monero (XMR/USD) presents a technical setup that could hint at a bullish breakout. It's important to remember that markets are inherently uncontrollable, there are no certainties, and all we can do is evaluate patterns and indicators to identify potential opportunities. Here’s a breakdown of the current setup and how to approach it with a balanced perspective:
• Higher lows and an Uptrend Since Early August:
The chart shows a pattern of higher lows, often a sign of bullish momentum building up. Since early August, XMR/USD has respected an ascending trendline, reflecting steady buying interest. However, markets can change direction quickly, and it’s crucial to keep an open mind and remain flexible as new data comes in.
• Symmetrical Triangle Formation Indicates Potential for a Breakout:
XMR/USD is consolidating within a symmetrical triangle pattern—a formation that suggests a potential breakout could be imminent. The price action is becoming increasingly tight, indicating that a significant move might occur soon. A breakout above the upper trendline around $172-$173 could signal a bullish run, while a breakdown below the lower trendline could indicate a bearish shift. It’s essential to be prepared for either scenario and respond accordingly.
• Relative Strength from XMR/BTC:
The relative strength of XMR against BTC (XMR/BTC) provides additional context to the bullish case. The pair has maintained stability, suggesting potential underlying strength in XMR. However, it’s important to remember that correlations can change, and broader market trends must also be considered when evaluating such setups.
• Managing Risk: Key Levels for Stop Loss and Take Profit:
Risk management is crucial in any trading strategy. In this setup, a stop loss around $167, just below a key support level and the lower trendline of the triangle, is how im managing this trade to limit potential losses if the market moves against the trade. The take profit level is set at $182, targeting a resistance area with about 7.16% potential upside from the current price, providing a favorable risk-reward ratio of 7.6:1. It’s vital to have a firm stop loss in place—traders should never move their stop loss further away to “give the trade more room.” This can lead to increased risk and significant losses.
• Volume and Momentum Indicators:
Volume has been decreasing as the price consolidates within the triangle, a typical pattern before a breakout. A surge in volume will be needed to confirm the breakout direction. Momentum indicators, such as RSI and MACD, are showing signs of potential bullish divergence. However, these signals should be treated cautiously and used alongside other indicators to make a comprehensive decision.
Conclusion:
XMR/USD is presenting a potential opportunity for a bullish breakout, but as with any trade, nothing is guaranteed. Managing your portfolio means assessing probabilities, setting firm stop losses, and staying adaptable to changing market conditions. Always approach trades with a strategy that considers both the potential reward and the risk involved. Stay disciplined, and be prepared to adjust your plans as the market reveals new information. Remember, successful trading is about making calculated decisions based on risk management, not chasing certainty.
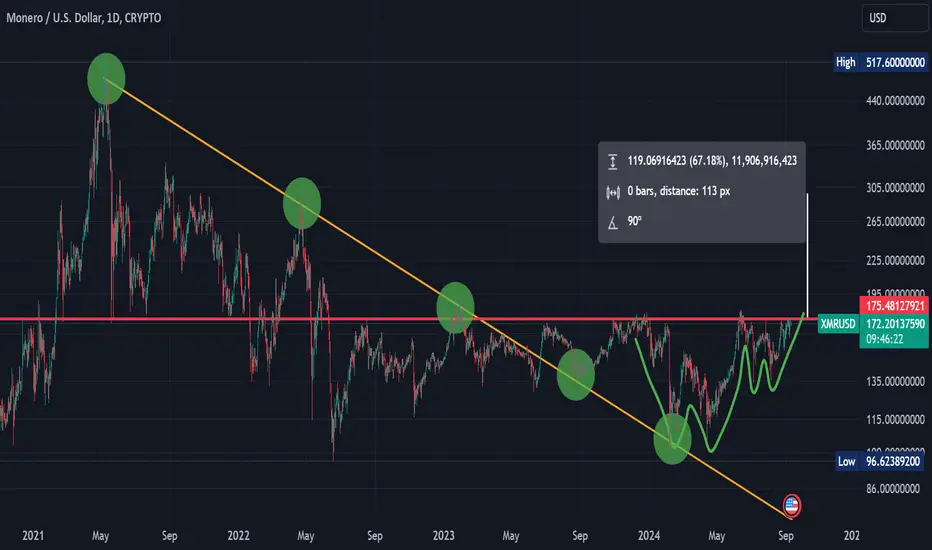
Monero (XMR) Bullish Setup?Some analysis on the Monero chart - Firstly the obvious (orange line) downsloping trendline going back to the May 2021 highs. This was broken in June 2023 with a retest in August '23 and another retest in Feb 2024 after the Binance delisting.
This level became a double-bottom, forming a nice "W" bottom structure.
The next significant level is XMR's current level at around $170-$175, level going way back to 2020.
XMR has used this as support and resistance over the years, and has recently been coming up against it again.
XMR has put in another, smaller "W" structure, which can be viewed as a form of cup-and-handle also.
A measured move on the breakout of this level would be around $300 as shown.
XMR has diverged quite a lot from BTC's price and makes it's own moves, so needs to be viewed as mostly independent.
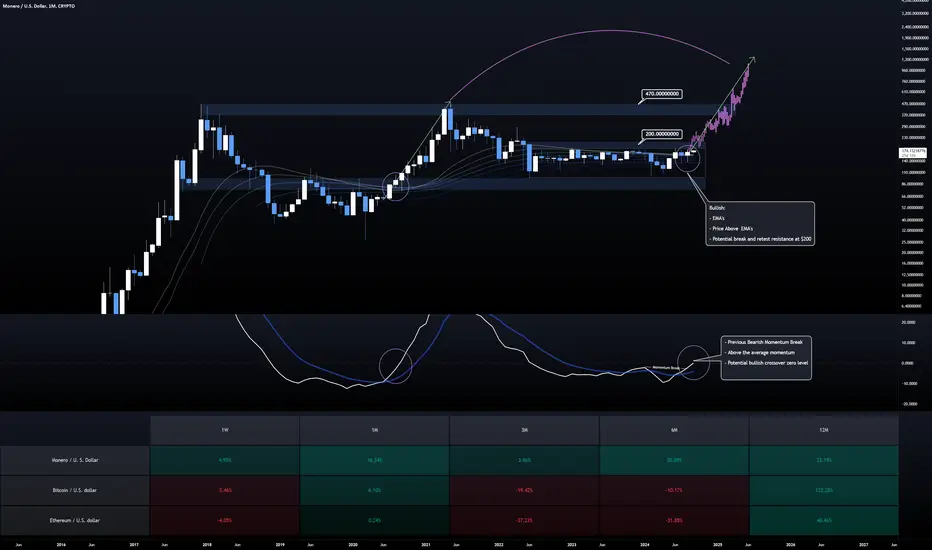
XMR/USDT Approaches $200 Resistance with Bullish Momentum
Technical Analysis:
1. Bullish Structure with Price Above EMAs:
The price is currently above the EMAs, showing strong bullish momentum. The EMAs are trending upwards, acting as dynamic support, and reinforcing the bullish structure.
A potential break and retest of the $200 resistance level is key. If this level is successfully broken, the bullish momentum is likely to accelerate, pushing the price toward higher targets.
2. Key Levels to Watch:
$200 Resistance: The price is approaching the $200 resistance level, a critical zone for bulls. A clean break above this level would confirm further bullish momentum.
$470 Target: If the $200 level is broken and holds as support, the next major target would be the $470 resistance level, representing a significant long-term bullish objective.
3. Momentum and Bullish Crossover:
Momentum indicators show a previous bearish momentum break, and the current momentum is above the zero line, signaling that the bulls are taking control of the market.
There is potential for a bullish crossover forming near the zero level, further confirming the bullish outlook and supporting a continuation of the upward move.
4. Performance Comparison (1W to 12M):
The performance of XMR/USDT compared to BTC/USDT and ETH/USDT over various timeframes highlights its relative strength:
1W Performance: XMR/USDT outperforms both BTC/USDT and ETH/USDT, showing gains of +4.95%, compared to Bitcoin's -3.46% and Ethereum's -4.05%.
1M Performance: XMR/USDT shows +16.34%, significantly stronger than BTC/USDT at +6.10% and ETH/USDT at +0.24%, indicating short-term strength in Monero’s price action.
3M to 6M Performance: Over these mid-term periods, Monero maintains a positive performance of +3.86% and +20.09%, respectively. In contrast, Bitcoin and Ethereum show negative performance, especially in the 6-month range where BTC/USDT is down -10.17% and ETH/USDT is down -31.85%.
12M Performance: XMR/USDT maintains a solid gain of +23.19% over the past year, outperforming both BTC/USDT (+122.28%) and ETH/USDT (+48.46%) over the long term, indicating that Monero has held up well despite broader market volatility.
5. Potential Scenarios:
Bullish Breakout: A successful break above $200 would lead to increased bullish momentum, targeting $470 as the next major level.
Consolidation: If the price stalls at the $200 resistance, consolidation could occur. As long as the price stays above the EMAs, this consolidation phase could present opportunities to enter long positions.
6. Conclusion:
XMR/USDT is currently in a bullish structure, supported by the performance comparison with BTC/USDT and ETH/USDT across multiple timeframes. A break above $200 would confirm the bullish outlook, with a target of $470 as the next major resistance.
Traders should watch for a potential breakout at $200 or a consolidation phase to find optimal entries, with strong support from the EMAs and momentum indicators.
What’s your strategy for trading Monero? Share your insights and let’s explore different trading approaches in the comments below!
_________________________________________________________________
The information and publications within the 3Commas TradingView account are not meant to be and do not constitute financial, investment, trading, or other types of advice or recommendations supplied or endorsed by 3Commas and any of the parties acting on behalf of 3Commas, including its employees, contractors, ambassadors, etc.

XMRUSD - IdeaWeekly chart for XMR
I have tried drawing channels to compare an early structure to the current overarching channel
Both have two peaks and a coalescing area before a massive run up
Bullish alt
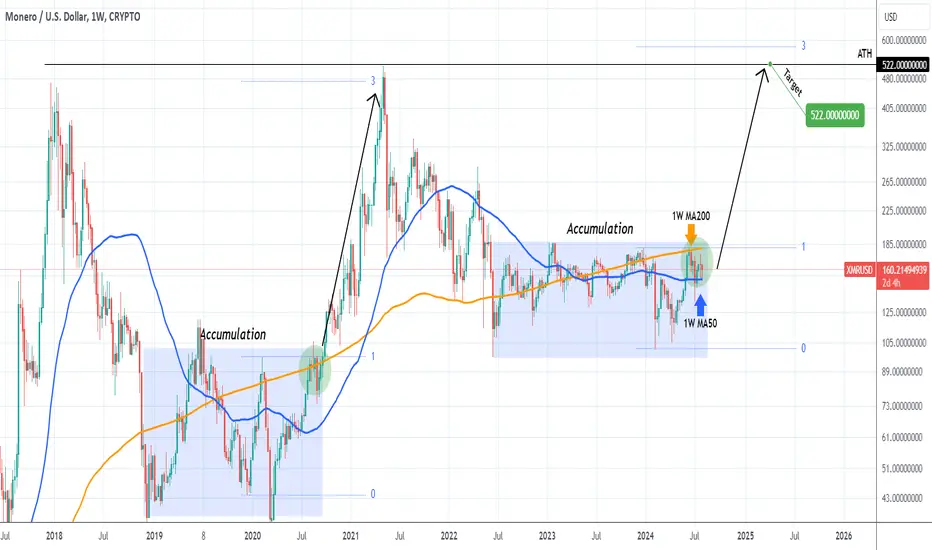
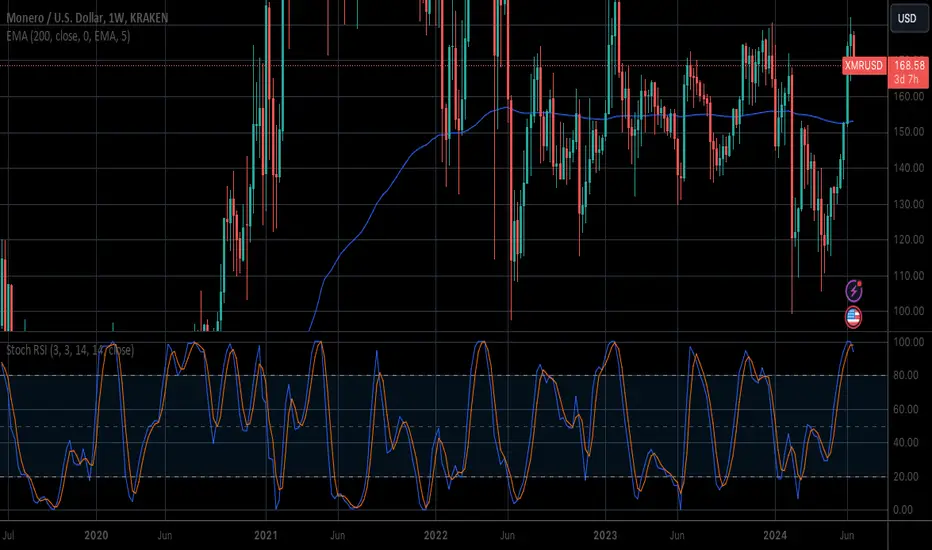
XMRUSD Next break above the 1W MA200 starts the parabolic rally.Monero (XMRUSD) has been consolidating within the 1W MA50 (blue trend-line) and the 1W MA200 (orange trend-line) for the past 2 months. This is at the top of the Accumulation Phase that has been containing the price action since the June 2022 Bear Cycle bottom.
Structurally, it appears that we could be in a similar consolidation as August - September 2020. That was the consolidation the led to the Cycle's Parabolic Rally once the 1W MA200 broke.
As a result, we expect the next 1W candle close above the 1W MA200 to be the bullish break-out signal that might start the new Parabolic Rally. Our long-term Target is 522.00 (the All Time High), even though technically the price might extend a bit higher on the 3.0 Fibonacci extension.
-------------------------------------------------------------------------------
** Please LIKE 👍, FOLLOW ✅, SHARE 🙌 and COMMENT ✍ if you enjoy this idea! Also share your ideas and charts in the comments section below! This is best way to keep it relevant, support us, keep the content here free and allow the idea to reach as many people as possible. **
-------------------------------------------------------------------------------
💸💸💸💸💸💸
👇 👇 👇 👇 👇 👇
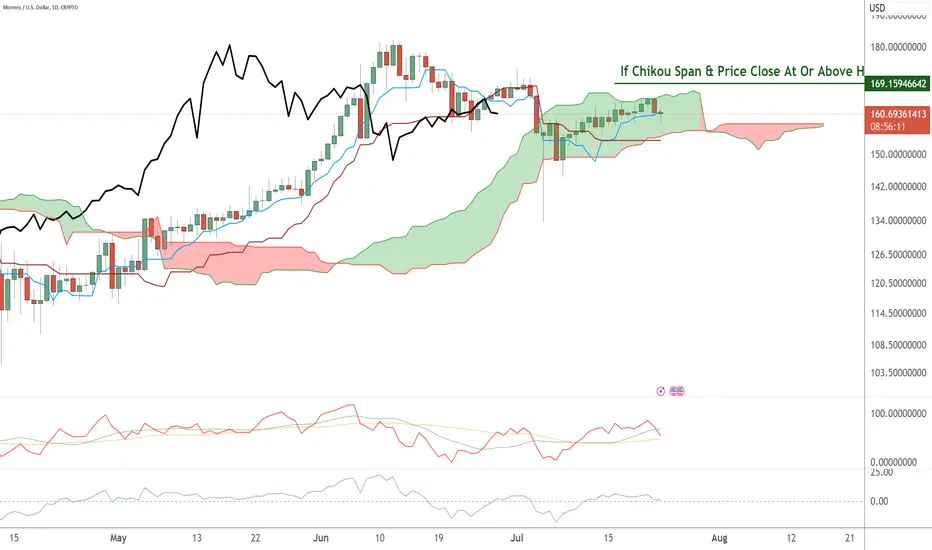
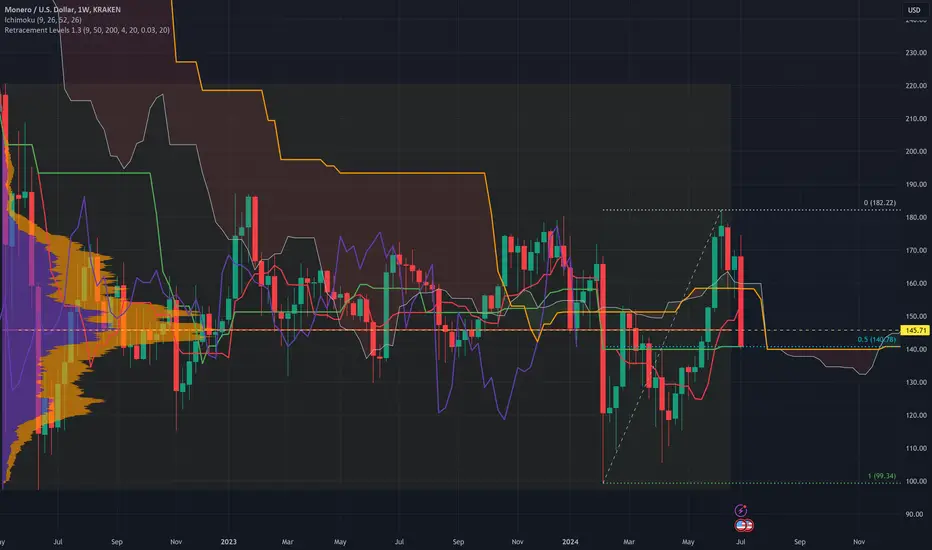
Monero's daily chart looks very bullish👉 Hidden bullish divergence
👉 Significant support around $154
👉 If bulls can close OMXSTO:XMR at or above $169.16, it will confirm an Ideal Bullish Ichimoku Breakout, the first since May 4, 2024.
🎯 2024 targets: $250.65 & $352.59
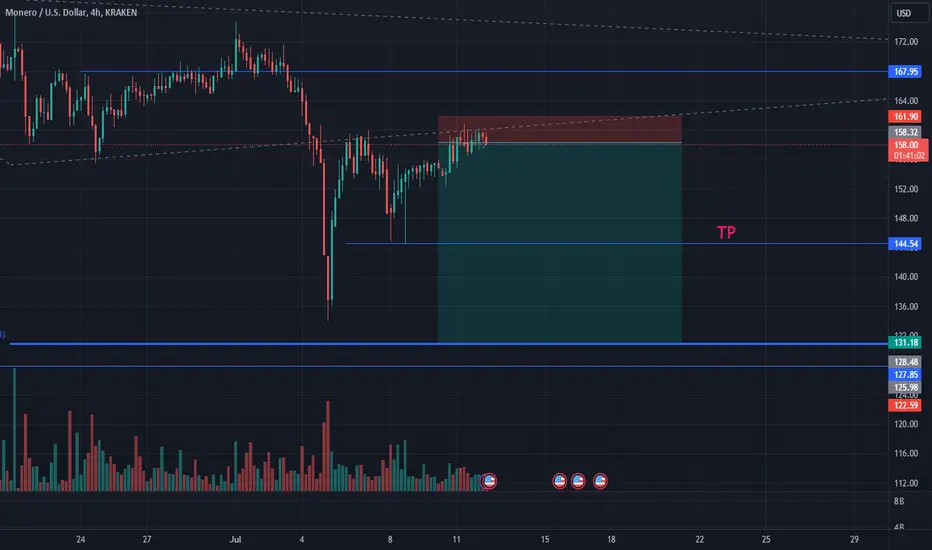
Monero back in "Fair Value"Of all cryptocurrencies I see Monero KRAKEN:XMRUSD differently as a good "store of value" which is private. That makes me a little looser with my trading guidelines for other assets. Monero has also proven difficult to trade in recent years... it has had some volatile swings but overall has broadly kept its value.
The recent cryptocurrency downtrend, led by Bitcoin, has finally caused the otherwise resilient Monero to break back into the 140 range. 140 on Monero for the last several years I have seen as "fair value" to accumulate. This is also the 50% Retracement of the recent trend and the Volume Profile Point of Control.
Monero top cycleResistance Breakout will lead us to the ATH around may 2025 , its a strong coin and im sure it will perform very well.
Dyor
XMR5Y
Stoch RSI is overbought and looking bearish.
ALL
Stoch RSI is in the middle at about 55 and pointing up, but if this changes direction a bigger downtrend may be on the way.
Prediction: I see this going down and retracing. We will wait and see if there is a bigger downtrend being made. A bigger downtrend move may see this around the longterm support of $30.
Who likes rounded bottoms?Get your head out of the gutter, I’m talking about round bases but the kind that breaks out. This chart looks like a storm in a tea cup. Whilst the trash coins (meme coins) are crashing to zero, the cream always rises to the top.
History doesn’t always repeat itself but it often rhymes.

Could Monero make new high?I am wondering and i am sure alot of holders are wondering too!
I believe it has Bullish structure
$187 is the breakout level
That we must monitor very carefully.
The privacy sector in #crypto is abosilutely miniscule compared to #memecoins which totally dwarfs them
Yet privacy is one of the few unique use cases that is very much .. as a system backup..
Fungibility / Privacy is not coming to #Bitcoin anytime soon or ever.
#HVF
@TheCryptoSniper
The Bottom for Monero is inAfter a near 1000day bearrun Monero is poised for the breakout.
The XMR BTC pair is also slowly turning bullish.
Everything is possible on Monero. Just dont forget to sell in March of 2025
