XMRUST trade ideas
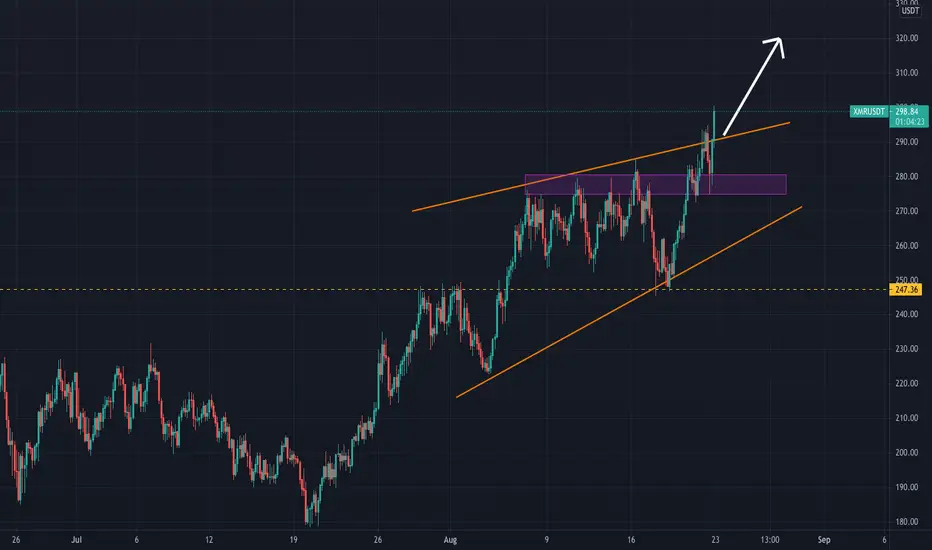
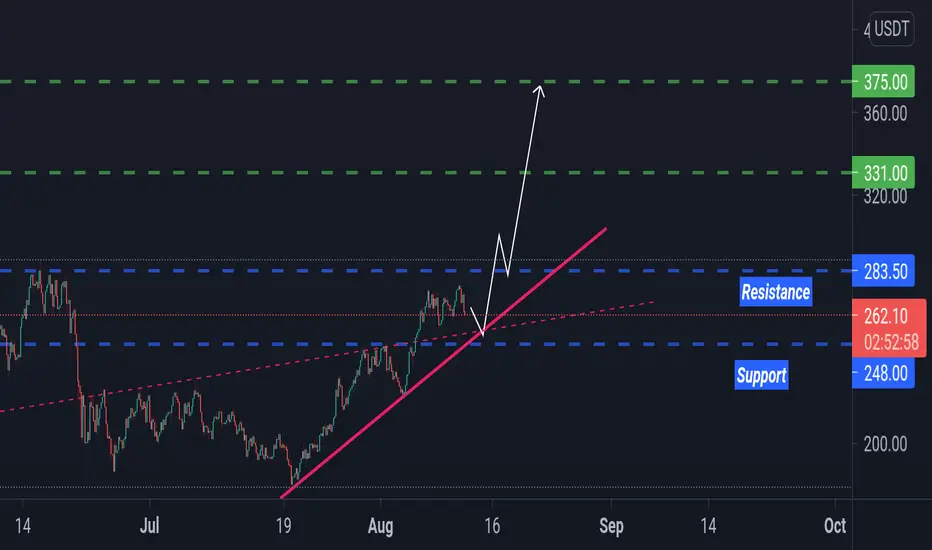
Right-Angled Ascending Broadening Formation Bullish BreakoutIf you're gonna get in on it might as well try to go for a3 to 1 risk to reward stops below $284 this trade is pretty high risk as we're buying at a high but it could be worth it if you're safe.
XMRUSDT 1D : Let's Buy :))) Let's buy Some #XMR ( Monero ) , Shall We ?? Great Move Starts From Yesterday and what a break :)) isn't it ?? ...
In order to buy, the SL (stop loss) and capital management must be observed.
All resistances and TPs (take profits) are marked on the chart.
(DYOR)
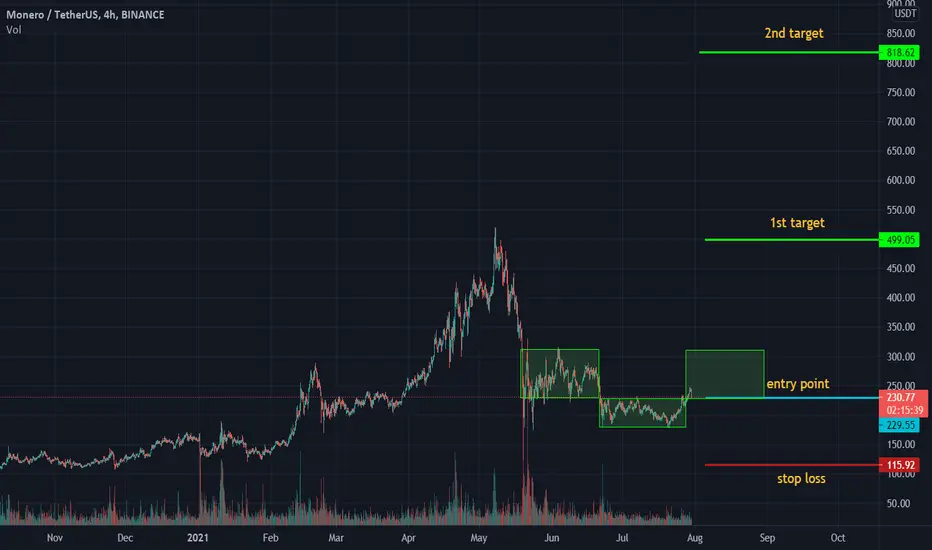
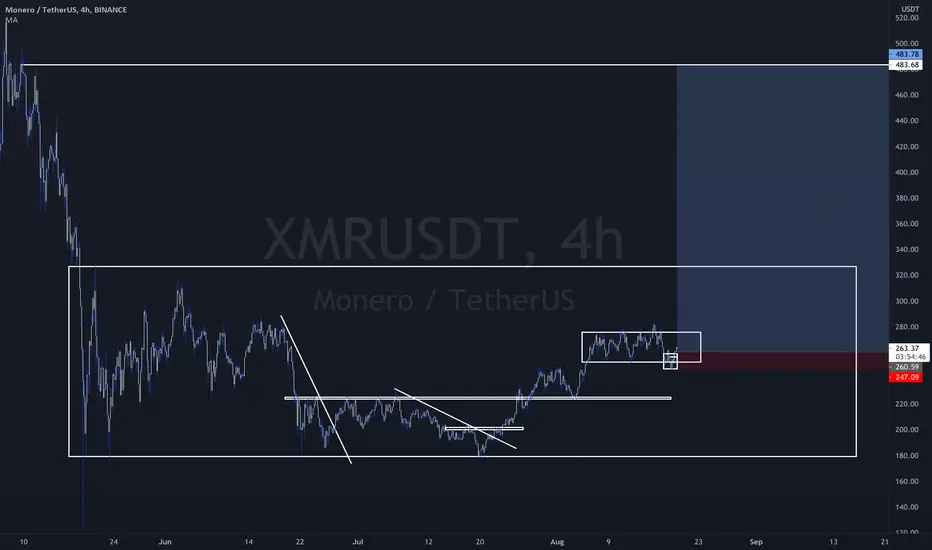
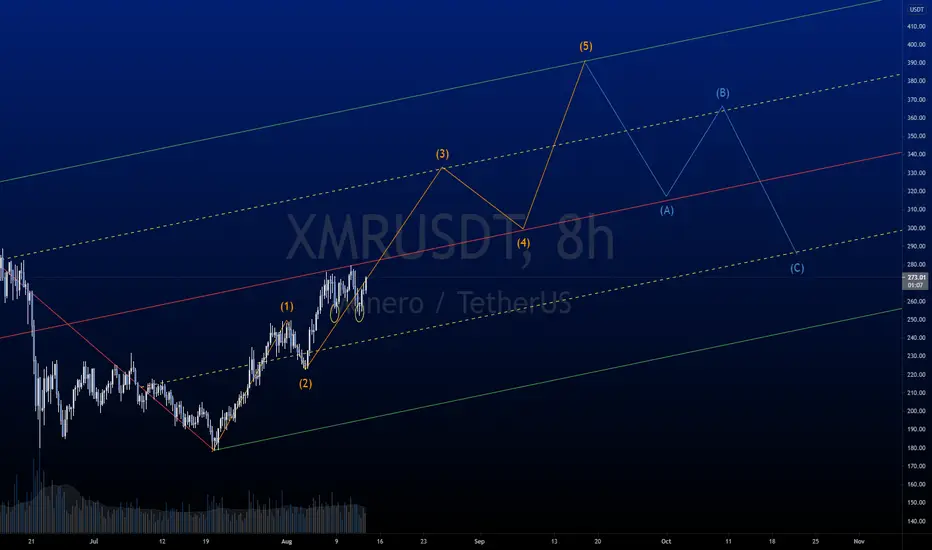
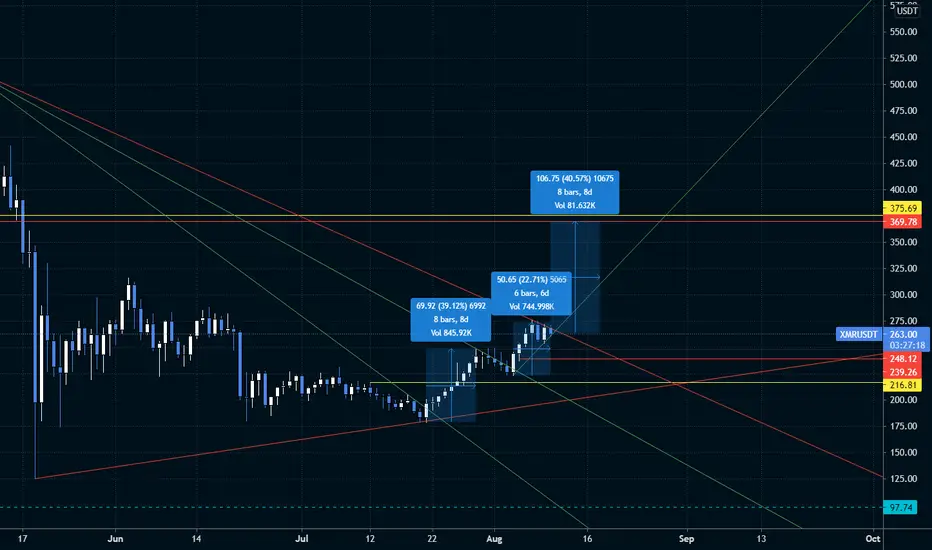
Monero Line Previous S/R repeated with possible Entry ExitsPrevious $XMR move to ATH repeated, showing previous points of Support and Resistance and possible Entry Exits en route to next ATH

XMRUSDT ShortThe price has reached to a very strong resistance zone in 4H, daily and even weekly Timeframe and has started to lose momentum, on the shorter timeframes we can see that a bearish breakout has happened and we are getting lower lows which makes it a good point to get a short position.
NOT FINANCIAL ADVISE


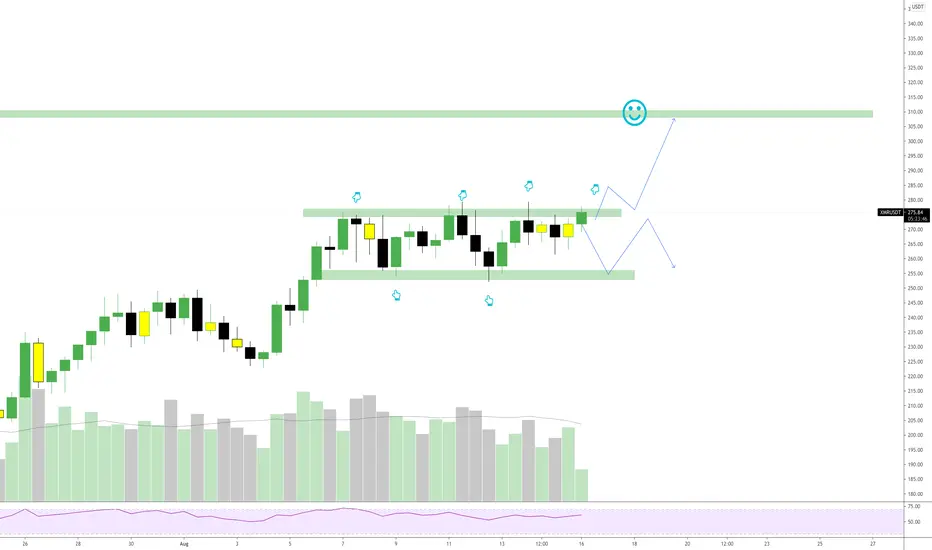
XMRUSDT - IN A BOX ▣▣XMR testing a supply zone for a while now. A good entry would be after a break of resistance cause i believe we will move sharp up for+ 10%!
If we drop again to support (bottom box), that would be IMO another good entry !
Thanks for taking your time to check out my idea 😎😎! Often, my ideas are fast gone from the front page because there are so many ideas on the platform and the algo picks the one with more likes 🤖🤖. I think once I have around 20 likes/idea my idea will be shown in front 🥳🥳. It would be awesome if you could like my idea, (only if you really like it of course) 🤪! I believe that the more we can interact with each other, and share thought about an idea, the more we can learn! 👩🏫🧑🏾🏫👨🏻🏫
Furthermore, I made a challenge for myself, I will add 1 idea for every new follower🦹♀️ So if I have 1 follower each day, I will add 1 idea. If I have 10 followers, I will add 10 🏌️♂️ It’s fun for me and you! More followers = more ideas = powerful community! 💪💪💪 Besides, all the ideas are … FREE 🥳🥳🥳
⚠️⚠️ If you want to know how my previous ideas played out, > push the play button on my previous ideas and check it out 🕵️🕵️
Is there a ticker you want me to look into? Let me know in a DM 📩📩
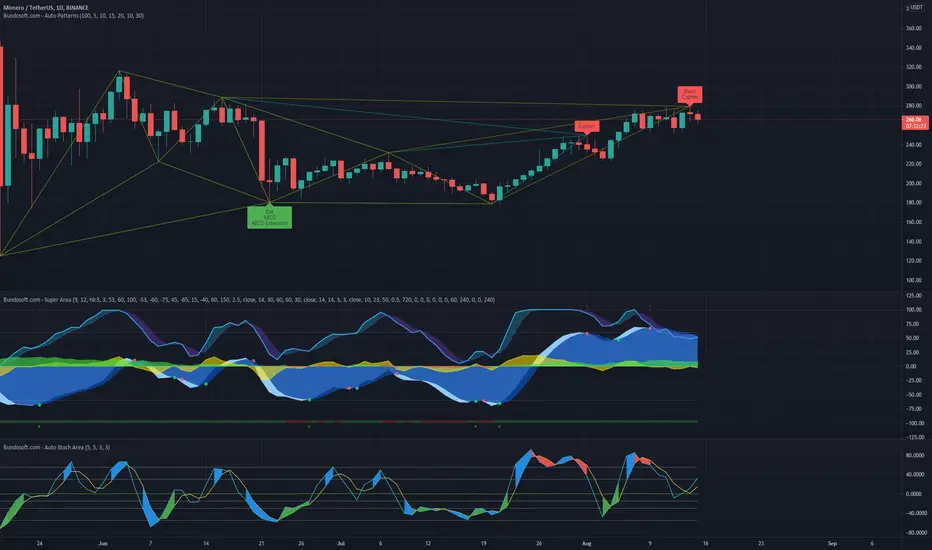
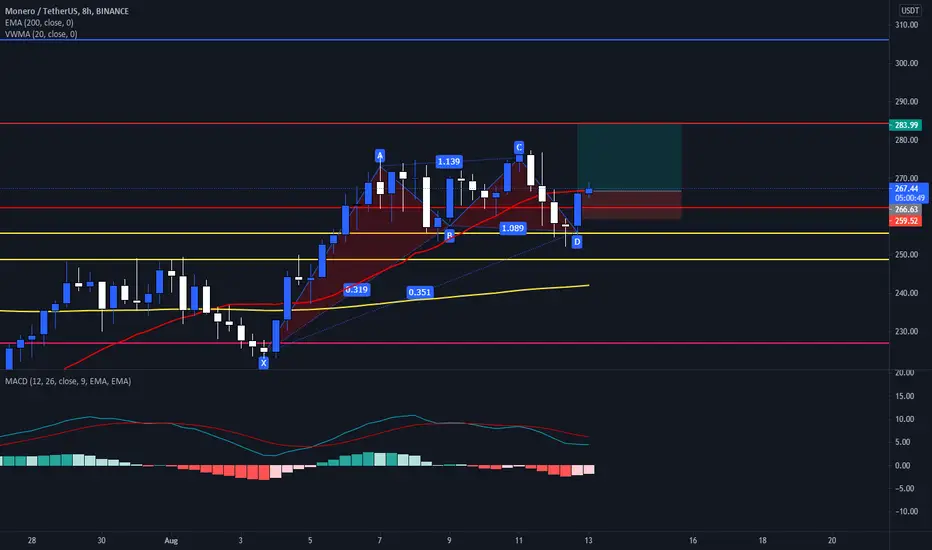
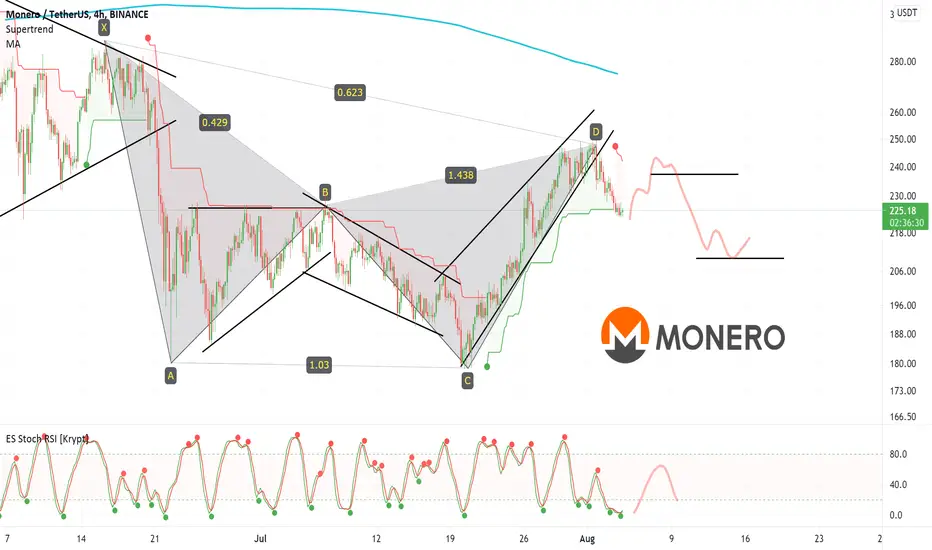
xmr shark cypher patternxmr has formed the shark cypher pattern. and is in the process of reversing.
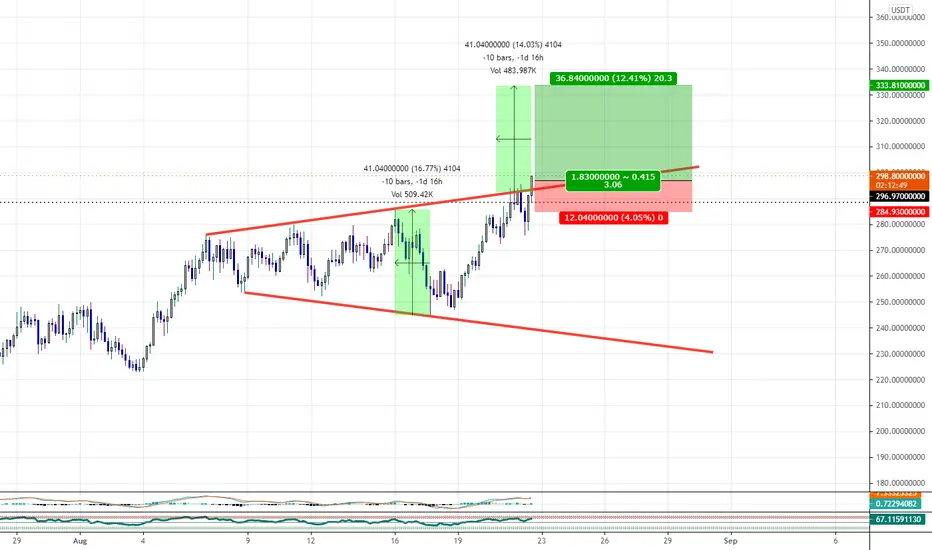
XMRUSDTPrice broke the bullish pennant and is at a key fib extension level. Volume on the left is strong and should push the price bullish. MACD is also above the zero
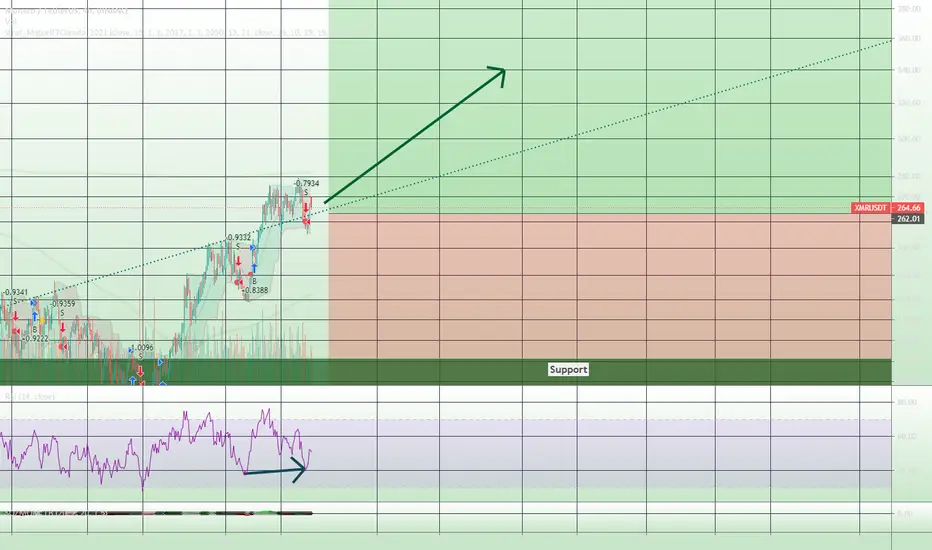
✅XMRUSDT +65%The bot is active and will open a Buy position if the blue sign shows up (arround 280).
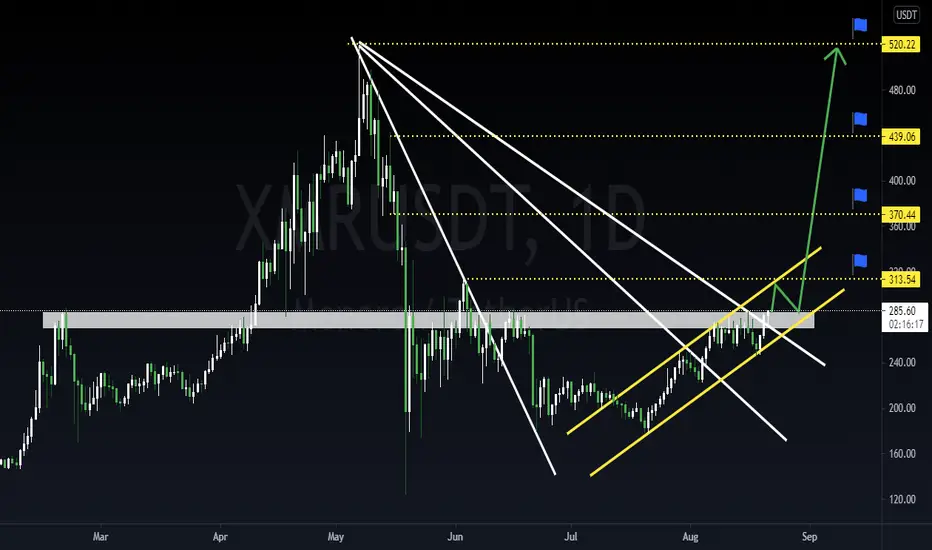
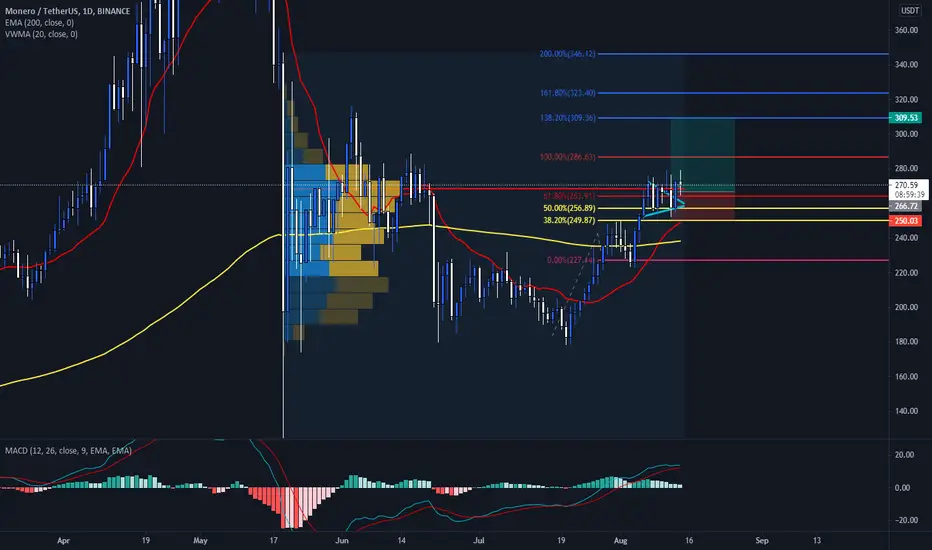
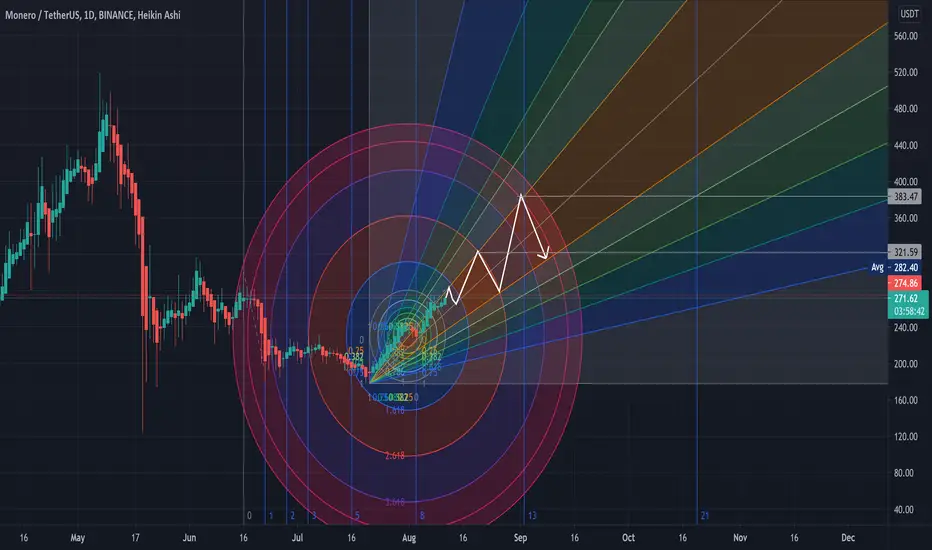
XMR-1D Chart [Fib]Today Monero has caught my attention due to the numerous "Fud" from the feds and disinfo from influencers led to me telling myself maybe it is time for privacy assets to get moonshot!
Back to the chart, XMR has yet to correct a little more to form an unconfirmed ( for now ) pennant if confirmed it should be followed by a massive impulse wave leading it
~320$USD and correct ~290$USD and then pushing back up ~380$USD .
time cycles shows that we currently are in an uptrend and that next critical level should be in ~2 weeks. circles tells us we just broke out of its previous level so expect consolidation soon.
If you wanna know more in detail just comment in the section below
or DM me if you want to suggest a particular chart for next time.
***DON'T FORGET TO DYOR, my charts should be taken lightly and used as a data point along with many others***
Monero's "consolidation" shows untapped potential! <XMR/USDT>The trend breaks are fueling the potential of this coin. Support level untested at a clean 250.

XMRUSDT Waiting for the Resistance zone Breakout!XMRUSDT Technical analysis Update
XMR/USDT currently trading at $249
Waiting for the resistance Breakout
Buy level : Above $251.00
Stop loss: $237.00
TP1: $260
TP2: $270
TP3: $281
TP4: $290
Max Leverage 2x
Always keep Stop loss
Note: please do your own research before investing. Never invest money that you can't afford to lose.

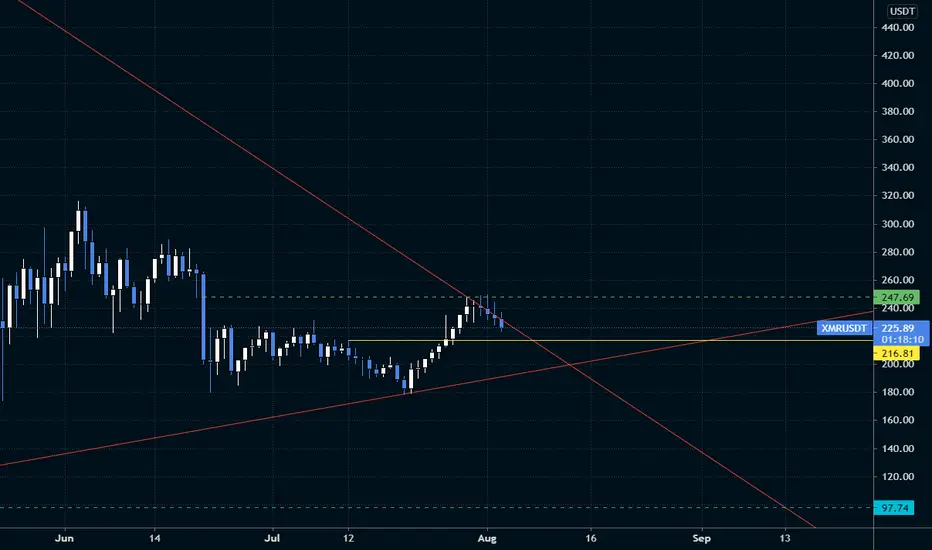
XMR/USDT bearish signs — XMR DOWNMonero is up +36% from last swing low, now making correction to previous swing and I am expecting price to reach zone of 240 before breaking down towards 210-s
Best regards
Artem Shevelev
XMR looking promising to those who shall not be identified Even with all the crypto turmoil around XMR' s chart shows a distinguished opportunity for upwards potential.
Looking ahead there are two pieces that will corroborate the bullish short term for XMR:
-The daily trend line. Already proved very powerful when broken- as it should
-Weekly level closed last week. This should support the move to push the final piece of the move.
XMR/USDT BUY SIGNALPullback is over, time for some uptrend. Perhaps 20%+ is what we should be expecting in the coming few days

XMRUSDT🌟this alt has a great potential to give profit to holders
🌟if you take a good look at its fluctuations you will find out the sequence is repeating itself and therefore you can follow the rhythm of the chart
👉This idea has the confirmation of "advanced price action" 👍
👉For more information don't be shy and get in private chat of trading view 👍
👉Hit share and spread the information in public chats or your twitter for everybody to get profit 👍