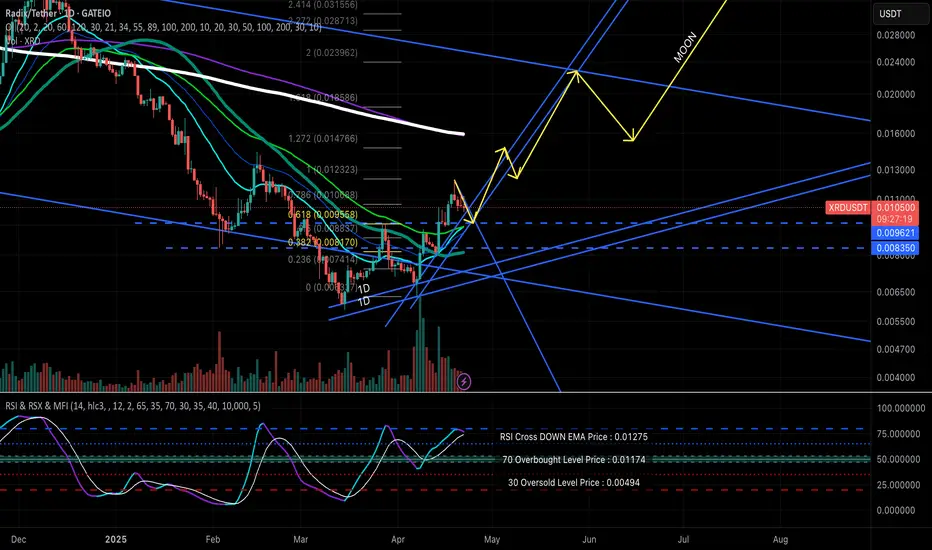
Radix Breakout! Early? Not for long...Radix seems to have found a short-term bottom here, breaking market structure to the upside and attempting to change the daily downtrend into a daily uptrend. Volume has picked up at the bottom, and I am looking for a pullback to retest the breakout of the double bottom formed from March 2025 to Apr
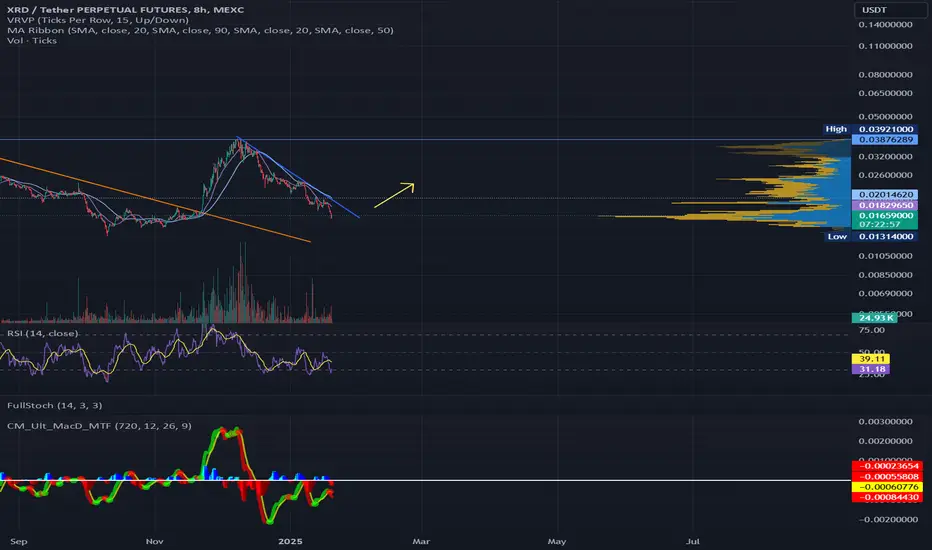
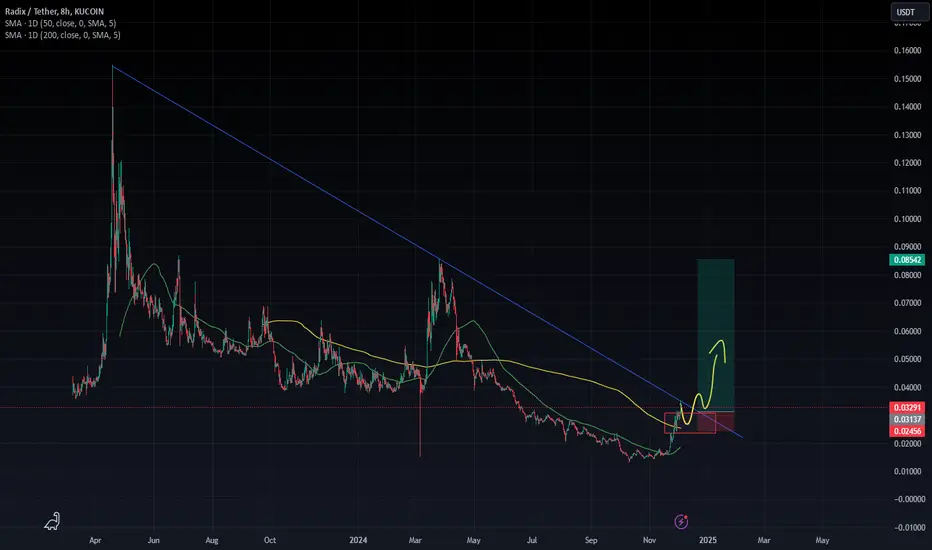
XRD - Needs to break above resistanceA very steep and long downtrend after tagging 0.0392, dropping over 57%
It will need to break the downrend resistance with some volume before it can work its way up again.
MACD is showing some positive divergence. We need to see some follow-through with the price action.
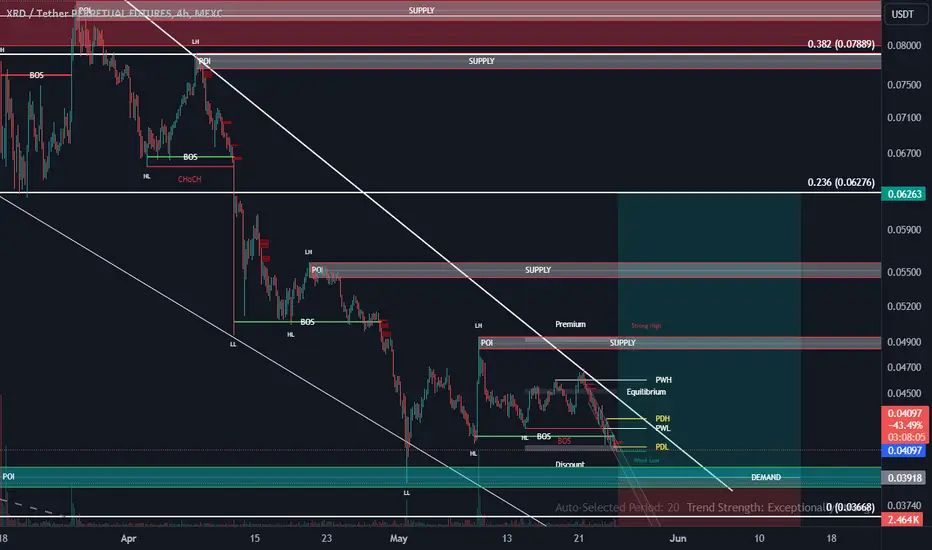
XRD - Next in line to pop to 0.038Coiled spring, hit resistance, pulled back and developed a strong positive divergence on the 4H chart. Following runs on AKT and FTM, this looks primed for a run.
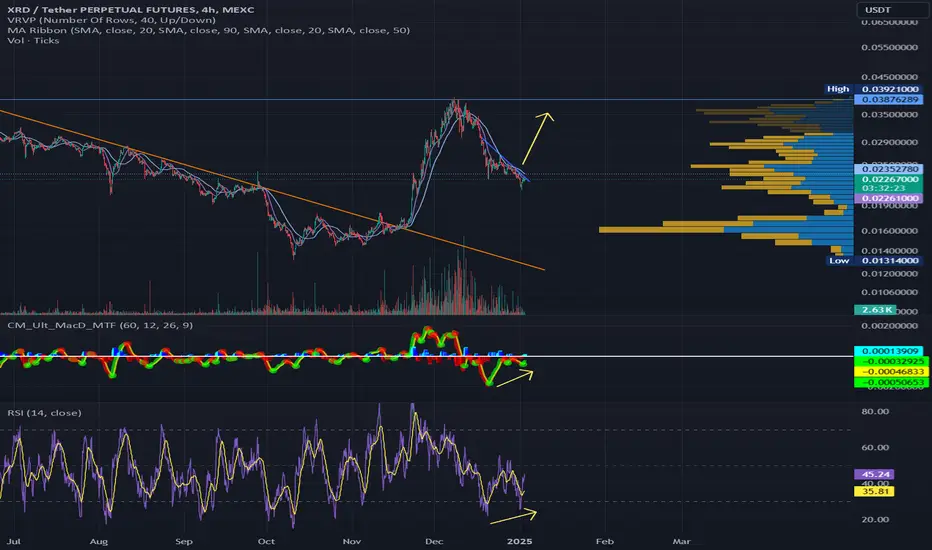
XRD - Decision time, Breakout or BreakdownMomentum indicators favour breakout. Price doing a double bottom on the 4h chart, with RSI and MACD trending higher (a bullish divergence)
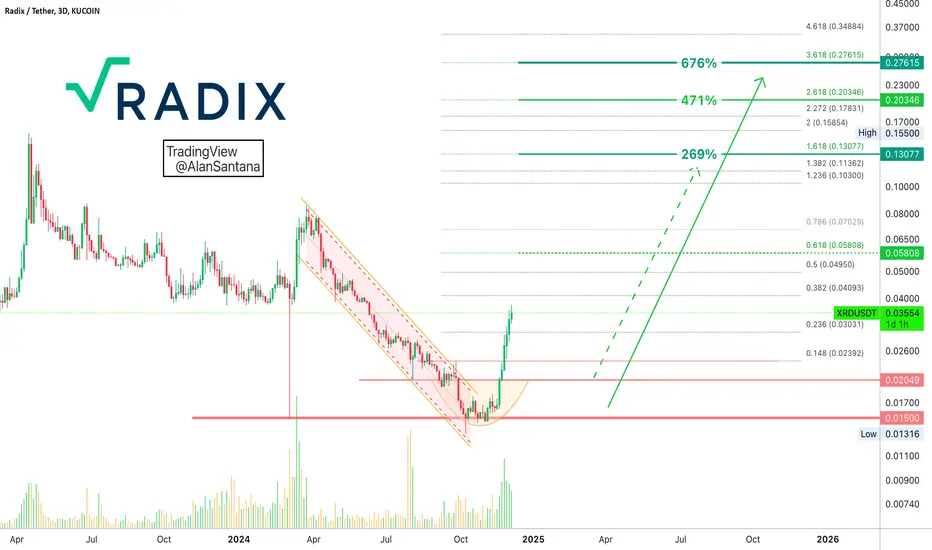
Radix: 676% Potential (It Is Still Early)Some pairs are more exotic than others... At first, and then they become well known.
This is an interesting chart with huge potential for growth.
➖ XRDUSDT (Radix) has been green for the last 16 days, full green; 100%.
This signal tells us that the bulls have full control of this pair, of this char
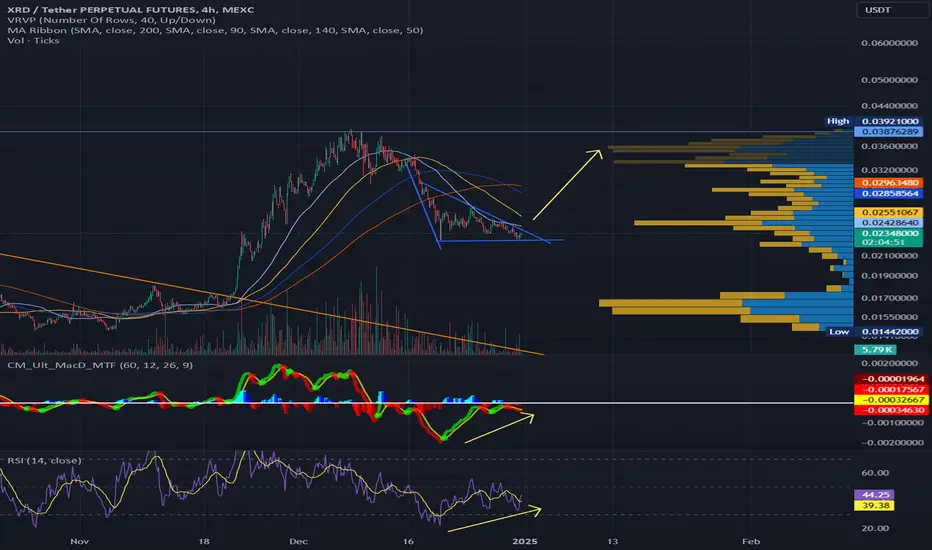
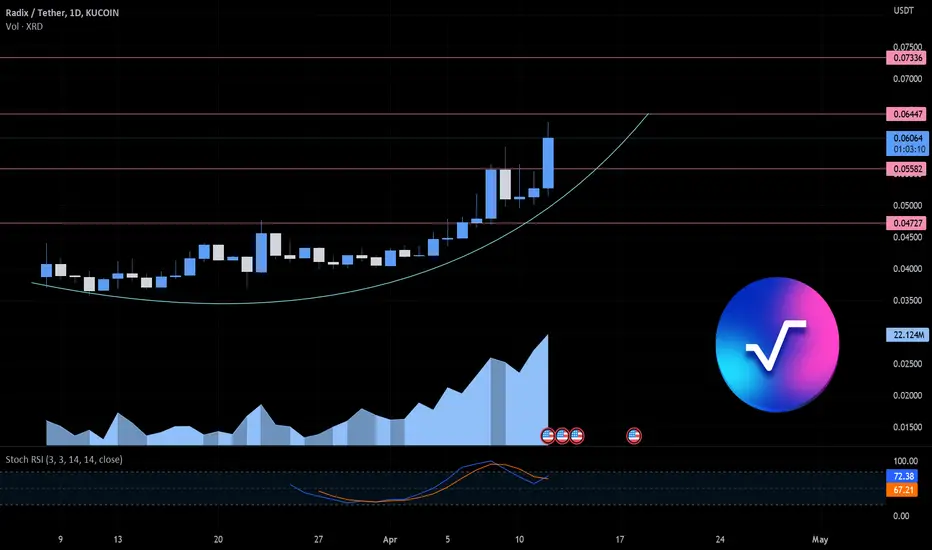
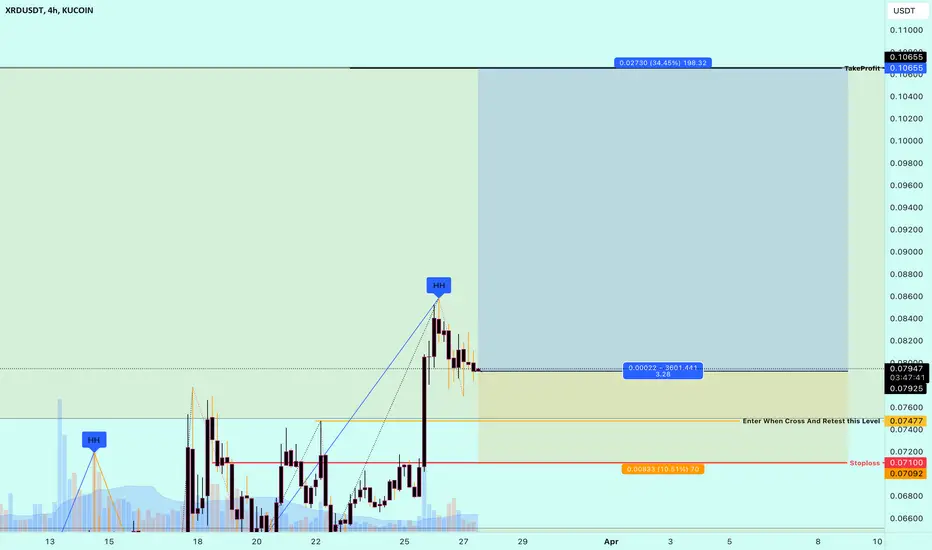
Radix XRD breaking long term wedge. Looking for a 177% GainXRD looks like it is finally breaking a long term wedge for over 1 year. Looking at a 177% for the overall TP. Wait to enter on a pull back in the range or after breaking the wedge and retesting.
Radix | XRDRadix has kicked off 2023 with an impressive performance, as evidenced by XRD’s recent surge that conspicuously stood out atop the cryptocurrency charts.
This surge can be attributed to the rollout of Babylon RCnet, which is Radix’s latest milestone release, incorporating novel features and capabil
XRD long setupALL trading ideas have entry point + stop loss + take profit + Risk level.
hello Traders, here is the full analysis for this pair, let me know in the comment section below if you have any questions, the entry will be taken only if all rules of the strategies will be satisfied. I suggest you keep thi
XRD Growth Spurt: Buy Your Ticket to Profit!Radix (XRD) Coin: Fundamentals and Recent News (as of March 27, 2024)
Fundamentals:
Radix (XRD) is the native token of the Radix network, a public blockchain designed to address scalability and security issues prevalent in existing blockchain technologies.
XRD serves three main purposes:
Securing t
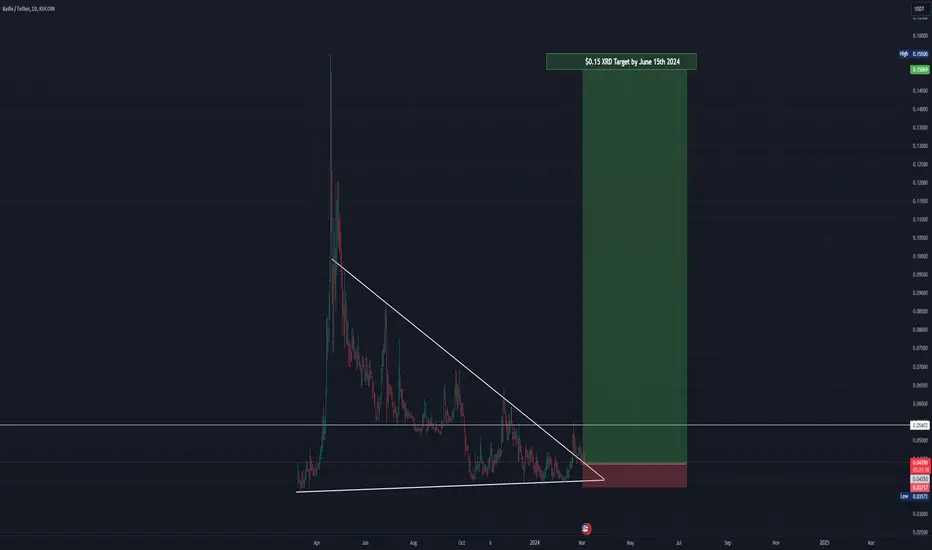
Radix $XRD | Its nearly timeCRYPTOCAP:XRD Radix will go a lot higher than 0.15. But is it important for me to set conservative targets.
Yes in the peak of the bull we should potentially see a $1 Radix.
Let me know if you agree!
See all ideas
Summarizing what the indicators are suggesting.
Oscillators
Neutral
SellBuy
Strong sellStrong buy
Strong sellSellNeutralBuyStrong buy
Oscillators
Neutral
SellBuy
Strong sellStrong buy
Strong sellSellNeutralBuyStrong buy
Summary
Neutral
SellBuy
Strong sellStrong buy
Strong sellSellNeutralBuyStrong buy
Summary
Neutral
SellBuy
Strong sellStrong buy
Strong sellSellNeutralBuyStrong buy
Summary
Neutral
SellBuy
Strong sellStrong buy
Strong sellSellNeutralBuyStrong buy
Moving Averages
Neutral
SellBuy
Strong sellStrong buy
Strong sellSellNeutralBuyStrong buy
Moving Averages
Neutral
SellBuy
Strong sellStrong buy
Strong sellSellNeutralBuyStrong buy
Displays a symbol's price movements over previous years to identify recurring trends.